HAL Id: hal-01990707
https://hal.archives-ouvertes.fr/hal-01990707
Submitted on 23 Jan 2019
HAL is a multi-disciplinary open access
archive for the deposit and dissemination of
sci-entific research documents, whether they are
pub-lished or not. The documents may come from
teaching and research institutions in France or
abroad, or from public or private research centers.
L’archive ouverte pluridisciplinaire HAL, est
destinée au dépôt et à la diffusion de documents
scientifiques de niveau recherche, publiés ou non,
émanant des établissements d’enseignement et de
recherche français ou étrangers, des laboratoires
publics ou privés.
Uranium Mining Applications
T. Marchais, B. Pérot, C. Carasco, P.-G. Allinei, P. Chaussonnet, J.-L. Ma, H.
Toubon
To cite this version:
T. Marchais, B. Pérot, C. Carasco, P.-G. Allinei, P. Chaussonnet, et al.. Detailed MCNP Simulations of
Gamma-Ray Spectroscopy Measurements With Calibration Blocks for Uranium Mining Applications.
IEEE Transactions on Nuclear Science, Institute of Electrical and Electronics Engineers, 2018, 65 (9),
pp.2533-2538. �10.1109/TNS.2018.2797312�. �hal-01990707�
Abstract— AREVA Mines and the Nuclear Measurement Laboratory of CEA Cadarache are collaborating to improve the sensitivity and precision of uranium concentration evaluation by means of ray measurements. This paper reports gamma-ray spectra, recorded with two high-purity germanium detectors, on standard cement blocks with increasing uranium content, and the corresponding MCNP simulations. The detailed MCNP model of detectors and experimental setup has been validated by calculation vs. experiment comparisons. An optimization of detector MCNP models is presented in this paper, as well as a comparison of different nuclear data libraries to explain missing or exceeding peaks in the simulation. Energy shifts observed between the fluorescence X-rays produced by MCNP and atomic data are also investigated, as well as gamma backscattering and beta radiation effects. The validated numerical models will be used in further studies to develop new gamma-ray spectroscopy approaches aiming at reducing acquisition times, especially for ore samples with low uranium content.
Index Terms— Nuclear measurements, gamma-ray spectroscopy, germanium detector, uranium mining, MCNP6
I. INTRODUCTION
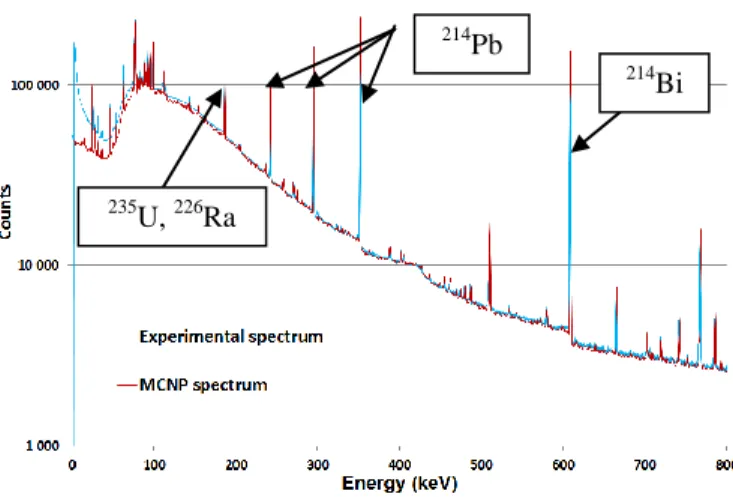
Gamma logging for uranium exploration is currently based on total counting with Geiger Müller gas detectors or NaI(Tl) scintillators. However, the total count rate interpretation in terms of uranium concentration may be impaired in case of radioactive disequilibrium of the natural 238U radioactive chain. Many phenomena can induce disequilibrium, such as radon evaporation, or differential leaching of uranium and its daughter elements (Th, Ra, Rn, etc.) in the ore as it might occur in roll-front uranium deposits. In the case of secular equilibrium, more than 95% of gamma rays emitted by uranium ores come from 214Pb and 214Bi isotopes, which are in the back-end of 238U chain. Consequently, these latter decays might still produce an intense gamma-ray signal even when uranium is present in smaller quantity than in the case of secular equilibrium. Therefore, additional gamma-ray measurements of core samples are performed on samples with
Manuscript submitted on June 1st, 2017. This work was supported by
collaboration between CEA R&D and AREVA Mines.
Thomas Marchais, Bertrand Pérot, Cédric Carasco, Pierre-Guy Allinei, Pascal Chaussonnet and Jean-Luc Ma are with CEA, DEN, Cadarache, Nuclear Measurement Laboratory, F-13108 Saint-Paul-Lez-Durance, France.
Hervé Toubon is with AREVA Mines, F-92084 Paris La Défense Cedex, France.
high energy resolution, high-purity germanium (HPGe) detectors. These detectors allow the detection of imbalances using the ratio of different gamma lines of the 238U decay chain, such as the well-known 1001 keV of 234mPa, one of the first daughters in the beginning of the chain. However due to the low intensity of this gamma ray (0.84%), its detection in ore samples of a few hundred grams with a low uranium concentration may require measurement times of several hours. Therefore, we plan to use more intense peaks at lower energy, such as self- fluorescence X rays of uranium, to reduce acquisition times. Fluorescence is induced by the main gamma-rays emitted in the ore by 214Pb (242, 295, 352 keV),
214Bi (609 keV) and 226Ra-235U (186 keV). After Compton
scattering, these gamma rays produce a high continuum of lower energy photons in the K-edge region of uranium (115.6 keV), resulting in a large photoelectric absorption rate and, subsequently, in the emission of uranium fluorescence X-rays, like the most intense 98.4 keV line. In order to study the potential of these new approaches and to establish a numerical simulation model, a measurement campaign was carried out in the radiometric calibration station of AREVA Mines in Bessines, France [1], using two HPGe detectors with a coaxial and a planar germanium crystal, respectively. This station holds seven cement blocks with increasing uranium contents, up to 1% weight fraction (i.e. 10,000 mg/kg = 10,000 ppmU).
The optimization of the MCNP model of the HPGe detectors will be presented, as well as a comparison of different nuclear data libraries to explain missing or exceeding peaks in the simulation. Energy biases between the fluorescence X-rays produced by MCNP and atomic data will also be investigated. The effects of gamma backscattering in the detector cooling system and of beta decays have been also simulated.
This paper aims at validating the MCNP model of the detectors thanks to experimental data in view to further study new approaches of uranium characterization.
II. THE RADIOMETRIC CALIBRATION STATION
AREVA Mines radiometric calibration station in Bessines aims to measure the counting rate due to gamma radiation emitted by seven independent cubic standard blocks with 70 cm edges (Fig.1). These blocks allow the calibration of radiometric probes, which are inserted in the Ø 8 cm central hole of each block.
Detailed MCNP simulations of gamma-ray
spectroscopy measurements with calibration
blocks for uranium mining applications
T. Marchais, B. Pérot, C. Carasco, P-G Allinei, P. Chaussonnet, J-L Ma, H. Toubon
Fig. 1. Drawing of a standard block [1]
The blocks have been manufactured by mixing fine sand and cement in controlled proportions with well-known uranium ore crushed to less than 150 microns. The uranium content of each cement block has been precisely determined by chemical analysis (Table I) of building material samples, but the uncertainty is not reported for these analyses performed in the 1970’s. Note that uranium concentrations will be validated by gamma spectroscopy in section IV.
TABLE I. CHARACTERISTICS OF THE SEVEN BLOCKS Block
#
Uranium mass fraction from chemical analyses (ppmU) Cement density (g.cm-3) B1 0 1.89 B2 500 1.92 B3 1000 1.89 B4 1900 1.91 B5 2900 1.92 B6 4800 1.93 B7 9700 1.92
The Nuclear Measurement Laboratory of CEA Cadarache (CEA being the French Alternative Energies and Atomic Energy Commission) has carried out a series of gamma-ray spectroscopy measurements on these standard blocks (Fig. 2). This campaign has been performed with a type N, coaxial HPGe detector (GR1020 model from CANBERRA, 4.5 cm diameter, 3.8 cm length), and a planar HPGe detector (“Broad Energy” BE2020 model from CANBERRA, with an entrance surface of 20 cm², a 5.04 cm diameter and a 2.65 cm thickness). Results have confirmed the uranium content of each block, as shown further in Table II. The gamma spectra acquired during this campaign (Fig. 3 and Fig.4) will also be used to validate the MCNP numerical model and to identify new information (X or peaks, Compton continuum, K-edge, etc.) that could be used to improve the assessment of uranium concentration.
Fig. 2. Coaxial HPGe detector (left) and planar (right) measurement setup in Bessines’ calibration station. The coaxial detector head is inserted inside the block hole (see Fig.5) while the planar detector is outside, in contact with the
concrete block (Fig.6)
Fig. 3. Coaxial HPGe gamma-ray spectra of the calibration blocks. Measurement time is 46916 s for block B2, 22258 s for block B3, 4276 s for block B4, 32446 s for block B5, 6111 s for block B6 and 1956 s for block B7.
Fig. 4. Planar HPGe gamma-ray spectra of the calibration blocks. Measurement time is 31019 s for block B3, 30751 s for block B4, 49490 s for
block B5, 50825 s for block B6 and 9024 s for block B7.
III. SIMULATION OF DETECTORS
A. Coaxial germanium detector
The detector was modeled with the MCNP Monte Carlo computer code [2]. The geometric model of detector is based on the manufacturer scheme, on X-ray radiography, and on measurements performed with a multi-energy beam coming from a highly collimated 152Eu gamma source (see Fig. 5) with a 10 cm × 10 cm × 10 cm lead collimator block drilled with a 1 mm × 1 cm slit, which allowed to precisely estimate the position and active area of the crystal. The calculated and experimental detector efficiencies are reported in Fig. 5 for the coaxial detector. The measured efficiency was built with calibration point sources (241Am 59.5 keV line, 109Cd 88.0 keV peak, and 152Eu gamma-rays from 121.8 keV to 1408 keV) at a distance of 50 cm from the detector head. The uncertainty of experimental results are less than 5 % and it is mainly due to the uncertainty on calibration sources (i.e. 1.5 % for 152Eu,
60Co and 88Y, 2.5 % for 241Am, and 5 % for 133Ba). Note that to
obtain the good agreement observed in Fig. 5, a dead layer has been implemented in the model of the germanium crystal, in the back, external edge of the germanium cylinder, to reflect a deficit of charge collection in this region. A copper electrode
214Pb 235 U, 226Ra 214Pb 235U, 226Ra Uranium X-ray
connecting the cooling system and the germanium crystal is also described, as well as the external aluminum cover.
Fig. 5. Above: X-ray radiography and MCNP modeling of the coaxial HPGe detector. Below : experimental and MCNP efficiencies for point sources at a
distance of 50 cm from the detector entrance face.
B. Planar germanium detector
In the same way as the coaxial detector, the planar HPGe detector was simulated with MCNP. This detector is located outside the block and is surrounded by lead shielding to attenuate the background noise coming from the room. In addition, a copper shielding was used to cut fluorescence X-rays of the lead shielding. Similarly to the coaxial HPGe detector, a dead layer has been implemented in the back of the germanium crystal, leading to a good agreement between experimental and simulated efficiencies (see Fig. 6).
Fig. 6. The modeling of the BEGe detector. Experimental and MCNP efficiency of the BEGe detector measured with point sources at a distance of
50 cm from the detector entrance face.
IV. VERIFICATION OF THE URANIUM CONTENT IN THE STANDARD CONCRETE BLOCKS
The global detection efficiency of each detector, including self-absorption in the standard cement blocks, has been calculated with MCNP with a first objective to determine the uranium mass concentration of each block, using the 234mPa gamma ray at 1001 keV. Equation (1) converts the net area of this peak into uranium mass concentration (ppm).
) 2 ln( ) U ( ) ( 10 ) 1 ( 6 238 1/2 238 A mol U N T U M Cm
) keV 1001 ( ) keV 1001 ( ) keV 1001 ( Eff I m Tc S Block n (1) With: UCm : uranium mass concentration of each block (in ppm) )
keV 1001 (
n
S : net area of the peak at 1001 keV measured on the gamma spectrum (number of counts, dimensionless number)
Tc: acquisition “live time” (i.e. real time corrected for pulse processing dead time) of the gamma spectrum (in s)
Block
m
: block mass (in g)) keV 1001 (
I : intensity of emission of the peak at 1001 keV of 234mPa (0.84 %) in the 238U filiation
) keV 1001 (
Eff : detection efficiency calculated with MCNP for each block (number of count in the full-energy peak at 1001 keV per photon of 1001 keV emitted in the block)
) (238
2 /
1 U
T : radioactive half-life of 238U (in s)
A
N : Avogadro constant (6.023.1023 atoms per mole, dimensionless number)
) U (238
mol
M : molar mass of 238U (in g)
: mass fraction of 235U in natural uranium (0.72 %)The mass concentration obtained by gamma-ray spectroscopy using (1) is in good agreement with chemical analysis, as shown in Table II. The reported uncertainty includes those due to detector calibration and modeling, counting statistics on the net area of the peak at 1001 keV, 1001 keV gamma-ray intensity (nuclear data precision), statistical uncertainty of MCNP calculations, and accuracy of the concrete blocks and measurement setup MCNP model.
TABLEII.URANIUM MASS CONCENTRATIONS (IN PPM) OF BESSINES CALIBRATION BLOCKS MEASURED BY GAMMA-RAY SPECTROSCOPY (THIS
WORK) AND CHEMICAL ANALYSIS
BLOCK # Chemical analysis (CA) (in ppmU) Coaxial HPGe (1 σ uncertainty) (in ppmU) Relative difference WITH CA Planar HPGe (1 σ uncertainty) (in ppmU) Relative differenc e WITH CA B1 0 2.1 ( 22 %) N/A N/A N/A B2 500 459 ( 3.7 %) - 8.2 % N/A N/A B3 1000 958 ( 1.9 %) - 4.2 % 905 ( 8.8 %) -9.5 % B4 1900 1960 ( 2.3 %) 3.4 % 1907 ( 6.0 %) 0.4 % B5 2900 2800 ( 3.3 %) - 3.5 % 2742 ( 4.3%) -5.5 % B6 4800 4550 ( 1.8 %) - 5.2 % 4661 ( 3.5 %) -2.9 % B7 9700 9530 ( 2.0 %) - 1.8 % 9882 ( 4.8%) 1.9 %
A. Model of the standard concrete blocks
The simulation of the concrete blocks (Fig.1) is based on a cement chemical composition given by AREVA Mines, including uranium concentrations (and densities) given in Table I. An isotropic gamma source uniformly distributed in the cement block is implemented in MCNP. The natural 238U and 235U radioactive chains are assumed in secular equilibrium. The source term retains only 14 predominant gamma emitters observed in the experimental spectra: 238U,
234Th, 234mPa, 230Th, 226Ra, 214Pb, 214Bi, 210Pb, 235U, 231Th, 227Th, 223Ra, 219Rn, and 211Pb. The intensity and energy of each
gamma ray are taken from the JEFF 3.1.1 library [3], and only the lines with energy higher than 40 keV are modeled. B. Coaxial germanium detector spectra
Fig. 7 shows a good general agreement between simulated and experimental spectra for the coaxial detector, only small differences being observed for minor peaks. For instance, the 89.5 keV peak was initially absent from the simulated spectrum due to a missing emission line of 214Pb at 89.8 keV in the JEFF 3.1.1 library (Bi K2 X-ray, intensity of 0.67% in
ENSDF [4]), combined with an underestimation emission of
214
Bi at 89.2 keV (Po K3 X-ray, 0.085% in JEFF 3.1.1 instead
of 0.116% in ENSDF). After implementing ENSDF data, the calculated 89.5 keV peak was found in satisfactory agreement with experiment (Fig. 8).
Fig. 7. Experimental and MCNP spectra of block B5 using ENSDF database.
We can also note in Fig. 8 that a peak is missing in the simulation at 110.4 keV, in the broad bump including both 110.4 and 111.3 keV uranium fluorescence X-rays (Kβ3 and
Kβ1, respectively [5]). Indeed, MCNP manual [6] indicates that
for elements with atomic number Z > 37, the X-ray emission Kβ3 is not simulated, and Kβ1 X-ray includes all transition
intensities from layers L to K, which explains the absence of the 110.4 keV peak (Kβ3) and a higher intensity at 111.3 keV
(Kβ1).
Fig. 8. Experimental and MCNP spectra of block B5 at low energy using ENSDF database
Fig. 8 also shows a significant energy shift between calculation and experiment concerning uranium fluorescence X-rays. Therefore, we have performed further simulations for 53 materials with atomic numbers between 40 (zirconium) and 92 (uranium) irradiated by a 1 MeV photon beam.The energy shift between MCNP and the expected fluorescence X-ray energy [4] shown in Fig. 9 as a function of Z reproduces the observation previously made in [7].
Fig. 9. Energy shift between the energy of fluorescence X-rays calculated with MCNP and the theoretical values taken from [4].
In further studies, this energy shift will be corrected when processing MCNP output data to allow a better agreement with the experimental spectrum.
C. Planar germanium detector spectra
In the same way as the coaxial detector, the planar HPGe spectrum was simulated with ENSDF database and the same conclusion can be drawn for the shift of fluorescence X-rays (Fig.11).
XKα2 XKα1 XKβ1
214Bi 214Pb
Fig. 10. Experimental and MCNP spectra of block B5 using ENSDF database.
The agreement between MCNP and experiment is again satisfactory, but we observe an underestimation of the Compton continuum below approximately 80 keV (Fig.10 and Fig.11). This phenomenon can be seen mainly on broad energy BEGe detectors (CANBERRA).
Fig. 11. Experimental and MCNP spectra of block B5 at low energy.
VI. INFLUENCE OF MINOR CONTRIBUTIONS
A. Beta radiations
The beta radiation was simulated for the planar HPGe detector and for cement block B5 (2906 ppmU). Bremsstrahlung
phenomenon (braking radiation) is expected to induce a photon contribution at low energy (less than 300 keV). The beta source (Fig.12) was simulated using a dedicated software developed in the Nuclear Measurement Laboratory, based on BTSPEC software [8][9] and JEFF 3.1.1 library. The beta source induced by the 238U chain (Fig.12) has been implemented in the SDEF source card of MCNP.
Fig. 12. Beta source of the 238U chain.
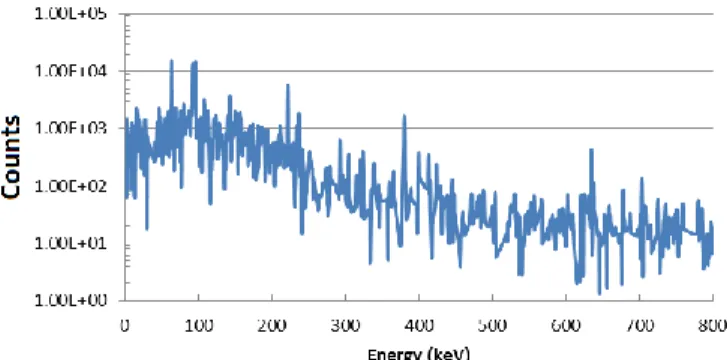
Since a very little number of Bremsstahlung photons reach the detector and no variance reduction is easily applicable for this type of simulation, we observe large calculation statistical uncertainty in each channel of the MCNP spectrum (about 30 %) when only the beta source is simulated (Fig.13). As noted above, the contribution of beta radiation is mainly located below 300 keV and it is very small compared to the number of counts in the gamma spectrum (Fig.10), from which it only represents approximately 0.36 %.
Fig. 13. Spectrum obtained when only beta source is simulated in block B5.
In conclusion, beta emissions will not be simulated in further studies.
B. Backscattered radiations
The cooling system was simulated for the planar HPGe detector and for block B5 (2906 ppmU). The geometry of the
BEGe detector and its liquid nitrogen cryostat and cradle is shown in Fig.14.
Fig. 14. Schematic drawing of the BEGe detector with dimensions in mm (and, in brackets, in inches).
214Bi 214
Pb
235
with the cooling system (right). The copper cold finger of the detector has been implemented, as well as the block containing liquid nitrogen. In addition, the length of the lead shield increases from 20 cm to 35 cm in order to reflect more realistically the experiment carried out at Bessines.
Fig. 15. Simplified (left) and more realistic (right) planar HPGe geometries.
The gamma spectrum calculated with this new geometry does not differ significantly from the previous one. Therefore, to highlight the (small) effect of gamma backscattering, Fig.16 reports the difference between the spectra with and without the cooling system and longer lead shield.
Fig. 16. Contribution on the spectrum of the cooling system
As previously for beta radiations, we can conclude that simulating gamma backscattering in this type of study is not mandatory as its contribution to the total signal is very small (about 0.87 %).
VII. CONCLUSION AND PROSPECTS
Seven calibration cement blocks with known uranium concentrations have been measured by high resolution gamma-ray spectroscopy at AREVA Mines calibration station, in Bessines, France. These measurements have then been simulated with MCNP computer code. A detailed model of two germanium detectors (a coaxial and a planar one) has been carried out thanks to calibration measurements with standard point sources of 109Cd, 152Eu, and 241Am. Then, the uranium mass concentrations of the blocks, originally determined by chemical analysis, has been confirmed by gamma-ray spectroscopy with the 1001 keV gamma ray of
234mPa, in the 238U radioactive chain. Finally, we obtained a
good agreement between the overall gamma spectra of the blocks calculated with MCNP and the ones measured in
nuclear data. A small bias in the energy of fluorescence X-rays produced by MCNP was also noticed, which will be corrected in future studies. In addition, gamma backscattering and beta radiation have been also simulated, showing negligible contributions to the total signal.
We will now use the validated MCNP model to study new gamma-ray spectroscopy methods, in view to characterize uranium faster than with the reference 1001 keV line. Indeed, its low intensity (0.84 %) leads to hours of acquisition time for ore samples of a few hundred grams with uranium concentration lower than 1 % mass fraction. To this purpose, we plan to use the low-energy lines of 234Th (63.3 and 92.4 keV) as well as information already present in the gamma spectrum that is not yet used, such as uranium self-fluorescence X rays (K and Ktransitions) and the K-edge or
Compton Continuum variations in the 100 keV region, as observed in Fig. 3 and Fig. 4.
REFERENCES
[1] http://www.areva.com/EN/operations-598/bessines-a-standardsetting-industrial-facility
[2] MCNP6TM, User’s manual – Version 1.0 - LA-CP-13-00634, Rev. 0 – May 2013 – Denise B. Pelowitz, editor
[3] A. Santamarina, D. Bernard, Y. Rugama, and OECD Nuclear Energy Agency, The JEFF-3.1.1 nuclear data library: JEFF report 22, validation results from JEF-2.2 to JEFF-3.1.1. Issy-les-Moulineaux, France: Nuclear Energy Agency, Organisation for Economic Cooperation and Development, 2009.
[4] The Lund/LBNL Nuclear Data Search, Version 2.0, February 1999, S.Y.F. Chu, L.P. Ekström and R.B. Firestone, LBNL, Berkeley, USA, and Lund University, Sweden, http://nucleardata.nuclear.lu.se/toi/
[5] M.C. Miller, X-ray Fluorescence, Chapter 10 of Passive Nondestructive Assay of Nuclear Materials (1991) pp. 313-335, NUREGCR5550, Los Alamos National Laboratory.
[6] Morgan C. White, Los Alamos National Laboratory, Los Alamos, - “Photoatomic Data Library MCPLIB04 : A New Photoatomic Library Based On Data from ENDF/B-VI Release 8” - LA-UR-03-1019- Dec. 2002.
[7] Cook, Matthew Tyler, "Hybrid K-edge Densitometry as a Method for Materials Accountancy Measurements in Pyrochemical Reprocessing." PhD diss., University of Tennessee, 2015.
http://trace.tennessee.edu/utk_graddiss/3329
[8] G.C. Panini, F. Leszczynski: NEA Package BTPLOT, Implementation and extension to ENDF-6 format on the IBM RISC/6000 computer environment of ENEA - March 1996
[9] A. Tobias: A Retrieval System for Spectral Data from ENDF/B Format Decay Data Files - RD/B/5170N81 CNDC(81)P9 - October 1981 [10] Gordon GILMORE, John HEMINGWAY – “Practical gamma-ray
spectrometry” - 1995
[11] T. Jensen, T. Aljundi, C. Whitmore, H. Zhong, and J. N. Gray, “X-Ray, K-Edge Measurement of Uranium Concentration in Reactor Fuel Plates,” Ames Lab., IA (United States), IS--5129, Nov. 1997,
http://dx.doi.org/10.2172/671994
[12] P. Pin and B. Perot, “Characterization of Uranium in Bituminized Radioactive Waste Drums by Self-Induced X-Ray Fluorescence,” IEEE