HAL Id: hal-01687095
https://hal.archives-ouvertes.fr/hal-01687095
Submitted on 18 Jan 2018
HAL is a multi-disciplinary open access
archive for the deposit and dissemination of
sci-entific research documents, whether they are
pub-lished or not. The documents may come from
teaching and research institutions in France or
abroad, or from public or private research centers.
L’archive ouverte pluridisciplinaire HAL, est
destinée au dépôt et à la diffusion de documents
scientifiques de niveau recherche, publiés ou non,
émanant des établissements d’enseignement et de
recherche français ou étrangers, des laboratoires
publics ou privés.
Maximization of measurement sensitivity and reading
range of passive RF sensors from complex impedance
optimization
Victor Engelhardt, Camille Jouvaud, Francois Sarrazin, Christophe
Delaveaud, Hervé Aubert
To cite this version:
Victor Engelhardt, Camille Jouvaud, Francois Sarrazin, Christophe Delaveaud, Hervé Aubert.
Maxi-mization of measurement sensitivity and reading range of passive RF sensors from complex impedance
optimization.
2017 IEEE SENSORS, Oct 2017, Glasgow, United Kingdom.
3p.,
Maximization of Measurement Sensitivity and
Reading Range of Passive RF Sensors from
Complex Impedance Optimization
Victor ENGELHARDT
∗†, Camille JOUVAUD
∗†, Franc¸ois SARRAZIN
∗†,
Christophe DELAVEAUD
∗†and Herv´e AUBERT
‡∗CEA-LETI, Grenoble, France
†University of Grenoble-Alpes, Grenoble, France
‡LAAS-CNRS, University of Toulouse, CNRS, INPT, Toulouse France
Email: [email protected]
Abstract—This paper reports a method to improve the per-formances of passive Radiofrequency sensors in terms of read-ing range and measurement sensitivity. More specifically the impedance profile of the sensing device that maximizes the measurement sensitivity and reading range is derived. This profile allows predicting the largest achievable reading range and the highest measurement sensitivity that can be achieved by a given sensor antenna. The proposed original method is illustrated through the design of a wireless and passive temperature sensor. Experimental results are reported for validation purposes.
I. INTRODUCTION
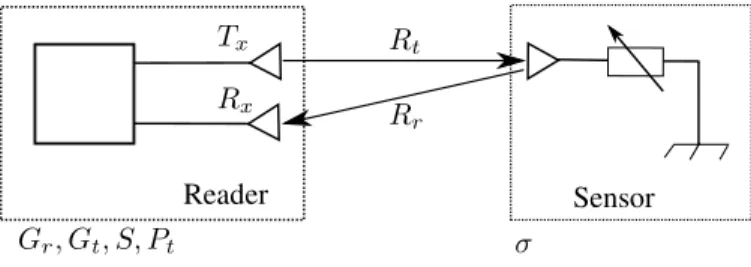
The Internet of Things is a promising research area for the next years. 50 billions of connected objects are expected in 2020. Among them, wireless sensors are required for applications like body and environmental monitoring. The variety of applications leads to a huge panel of technical constraints. In this context, chipless and passive (i.e., battery-less) Radiofrequency sensors present numerous advantages, such as, unlimited energy autonomy, long-term measurement stability and low cost of fabrication. The wireless interrogation of such sensors can be performed from the measurement of radar signature. As illustrated in Fig. 1, the technique consists in transmitting an electromagnetic wave in the direction of the sensor and deriving the measurand, i.e., the physical or chemical quantity of interest, from the signal backscattered by the Radiofrequency sensor (see, e.g., [1]). It allows the simultaneous wireless interrogation of many sensors, the real-time monitoring of each sensor and provides a simple sensor identification technique. However the well-known limitations of such sensors are the short reading range (typically of few tens meters) and the low measurement sensitivity with respect to the measurand. In this communication, a novel approach is reported for maximizing both the reading range and the measurement sensitivity of passive Radiofrequency sensors.
II. READINGRANGEMAXIMIZATION OFPASSIVE
RADIOFREQUENCYSENSORS
The Radiofrequency (RF) power Pr received by the reader
from the electromagnetic backscattering of a target (here a
Reader Sensor Gr, Gt, S, Pt σ Tx Rx Rt Rr
Fig. 1. Wireless Interrogation Setup of RF Passive Sensors
passive RF sensor assumed to be polarization matched) is given by [2]: Pr= σ GtGrλ2 (4π)3R2 tR 2 r Pt, (1)
whereσ is the Radar Cross Section (RCS) of the target, Gtand
Grare the gains of the radar’s transmitting (Tx) and receiving
(Rx) antennas, respectively,Rtis the distance between theTx
antenna and the sensor,Rris the distance between the sensor
and theRx antenna,Ptdenotes the power transmitted by the
reader and λ is the free space wavelength at the operating frequency. If the transmission and reception share the same antenna (Gt= Gr= G), the reading range R = Rt= Rr is
then derived as follows : R = 4 s σG 2λ2P t (4π)3S (2)
where S is the receiver sensitivity, that is, the minimum power required by the radar reader for processing a specified received signal having a specified signal-to-noise ratio. The passive RF sensor shown in Fig. 1 is typically composed of an antenna and a sensing device, that is, a load impedance which changes when the measurand varies. The RF electromagnetic field backscattered by the sensor antenna can be decomposed into two scattering modes: (1) the so-called structural mode As which does not depend on the sensing device impedance
and, (2) the antenna mode which is related to the impedance
mismatch at the input port of the antenna. The RCS of the RF sensor can be written as follows [3]:
σ = λ 2 G2 a 4π |Γ − As| 2 (3) with Γ = (Z − Z∗
a)/(Z + Za) where Za and Ga denote
the impedance and the gain of the sensor antenna while Z is the sensing device impedance. According to Eq. 2, the reading range is a function of σ and consequently, there are two possibilities for enhancing this range: (1) to increase the gain Ga and/or (2) to maximize the factor |Γ − As|2 from
the appropriate choice of the sensing device impedance. The latter possibility requires the knowledge of the key parameter As. Several works have been reported on the derivation of this
parameter for simple geometrical structures (see, e.g., [4]). For complex antenna geometry, a graphical approach exists [5] and consists in simulating the antenna loaded by three different impedances. Once As= asexp(iθAs) is found, the complex
impedanceZmin such asΓ(Zmin) = As derives as follows :
Zmin=
Z∗
a+ ZaAs
1 − As
(4) According to Eq. 3, when the antenna is loaded by this complex impedanceZmin, the electromagnetic backscattering
from the RF sensor is theoretically canceled. Moreover, from Eq. 3 the impedanceZmax that maximizes the RCS (and the
reading range) can also be derived as follows : Zmax=
Z∗
a+ Zaexp(i(θAs+ π))
1 − exp(i(θAs+ π))
(5) III. MAXIMIZATION OFPASSIVESENSORSENSITIVITY
The objective is here to determine how the complex impedance of the sensing device must vary in response to a measurand variation in order to maximize the measurement sensitivity. The first stage (n = 0) consists of computing the Radar Cross Section when the antenna is loaded by the impedance Z0 = Zmax given by Eq. 5; In the second stage
(n = 1), the impedance Z0 is replaced by the impedance
Z1= Z0+∆Z with ∆Z = ǫeiθ1 whereǫ << ||Zmax−Zmin||
is fixed andθ1is determined such that the Radar Cross Section
differenceσ(Z0) − σ(Z1) is maximal; The third stage (n = 2)
consists in replacingZ1 byZ2= Z1+ ∆Z with ∆Z = ǫeiθ2
whereθ2 is chosen such thatσ(Z1) − σ(Z2) is maximal, and
so on... The process is stopped at the stage N (n = N − 1) whenσ(ZN) is minimal. For any n ∈ [0, N ] the measurement
sensitivity|σ(Zn) − σ(Zn−1)|/ǫ is maximized. Consequently,
as the measurand varies, the complex impedance of the sensing device must take values in the set {Z0, ..., ZN} for achieving
the highest measurement sensitivity with respect to the mea-surand.
IV. APPLICATION TO THEDESIGN OFRF TEMPERATURE
SENSORS
For illustration purposes we present now the design of a wireless and passive temperature Radiofrequency (869.8 MHz) sensor by applying the method described in Sections II and
(a) Top view (b) Bottom view
Fig. 2. Photography of the antenna used for the RF temperature sensor application
TABLE I
COMPLEXIMPEDANCE OF THELOADINGSENSINGDEVICEWHICH
MINIMIZES(Zmin)ANDMAXIMIZES(Zmax)THERCSOF THESENSOR
ANTENNA AT869.8MHZ
Impedance of the loading sensing device [Ω] RCS of the sensor [mm2]
Zmin= 0.26− 66i 82.65 Zmax= 41.25i 2.42.104
III. The chosen antenna, shown in Fig. 2, is composed of a planar loop printed at one side of a ROGERS 3003 Substrate of dimension 30 × 30 × 0.75mm3
. A Split Ring Resonator (SRR) is printed at the other side of the substrate. The input impedanceZa at 868 MHz of this antenna is found to be of
53.9 Ω + i3.4 Ω. Using the method proposed in Section II, the two impedances Zmin andZmax that respectively minimize
and maximize the RCS of the sensor are first computed. The obtained values are reported in Table I, as well as the corresponding RCSs. The complex impedance Zopt of the
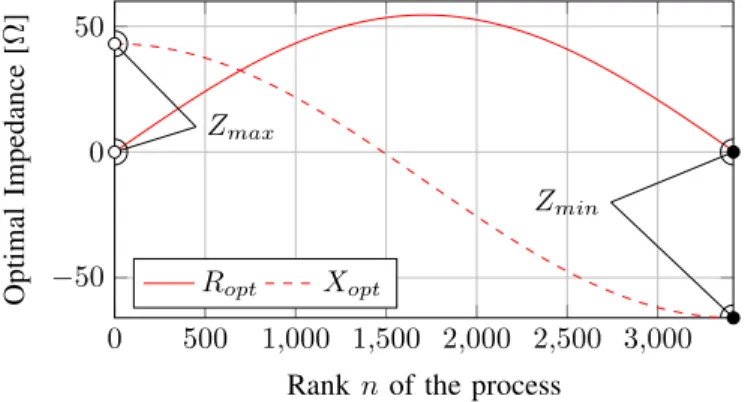
sensing device that allows achieving the highest measurement sensitivity with respect to the measurand is derived from the method described in Section III. The real (Ropt) and imaginary
(Xopt) parts of this complex impedance are presented in Fig. 3.
These results are very useful to select the sensing device which is the most appropriate to the chosen antenna for maximizing the measurement sensitivity. As the measurand varies, the resistance of the sensing device must ideally range from0 Ω to 50 Ω while its reactance must vary between 40 Ω and − 60 Ω.
0 500 1,000 1,500 2,000 2,500 3,000 −50 0 50 Zmax Zmin
Rankn of the process
O p ti m al Im p ed an ce [Ω ] Ropt Xopt
Fig. 3. Real (solid curve) and imaginary (dashed curve) parts of the impedance Zoptfound by the process presented Section III for maximizing
0 500 1,000 1,500 2,000 2,500 3,000 0 1 2 3 4
Rankn of the process
|Γ − As | 2 ¡
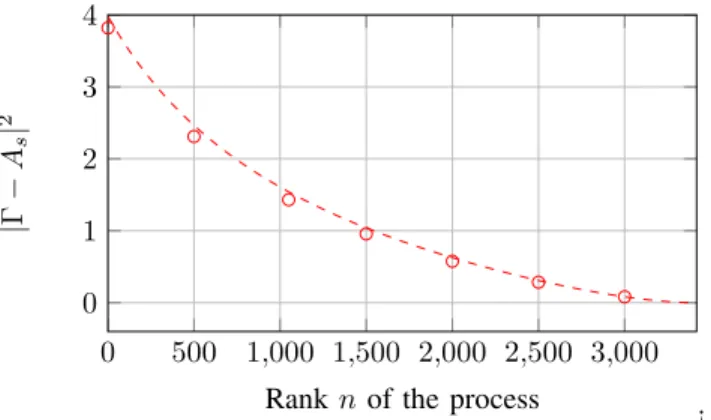
Fig. 4. |Γ − As|2 versus the rank n of the process described Section
III (dashed line). Circles indicate the values obtained from the full-wave electromagnetic simulation (CST) of the chosen antenna loaded by the complex impedance Zopt at rank n=1, 500, 1 000, 1 500, 2 000, 2 500
and 3 000
Next the factor |Γ − As|2 is computed for the complex
impedanceZopt. The results are shown in Fig. 4 and are found
in very good agreement with results obtained from the full-wave electromagnetic simulation (CST Microfull-wave Studio) of the chosen antenna loaded by the complex impedanceZopt. In
order to reach the highest measurement sensitivity when the temperature varies, we must ideally select a sensing device having the impedanceZopt. A resistance variation close to the
required one is achieved by the high frequency HFT1220-12R0 thermistor. The resistance of this sensing device varies from 3 Ω to 61.5 Ω when the temperature varies between −40◦C
and 80 ◦C. The reactance of this thermistor does not range
from 40 Ω to −60 Ω, as required. We shall not report in this paper the design of the required reactance. However adding a temperature-independent reactance of 40 Ω in series with the thermistor is sufficient for enhancing the reading range and measurement sensitivity. As a matter of fact, it can be observed from Fig. 5 that the RCS of the antenna loaded by the thermistor in series with this reactance is higher than the RCS of the antenna loaded by the thermistor alone. Moreover the measurement sensitivity is significantly improved when the reactance is present (∆σ/∆T is of 226 mm2
/◦C with the
reactance and of 114 mm2
/◦C without reactance). Sections
II and III were applied to the chosen antenna and the corre-spondingZminandZmaxwere calculated. For experimentally
illustrating the advantageous impact of a reactance in series with the resistive thermistor, the RCS of the antenna loaded by an inductor of 10 nH in series with various resistances were measured. The measurement was performed in an anechoic chamber. A Vector Network Analyzer with two calibrated antennas were used as a reader. The RF sensor was placed at 4 meters in front of the reader. Measurement results are displayed in Fig. 6. The largest achievable RCS of the sensor is found to be of 24000mm2
as predicted from simulation. Moreover it can be derived from this result and Eq. 2 that the reading range is increased by 25% when the reactance is present. −40 −20 0 20 40 60 80 10,000 15,000 20,000 25,000 Temperature [◦C] R C S [m m 2]
Fig. 5. Computed RCSs of the antenna at 868 MHz loaded by the thermistor in series with this reactance (blue curve) and of the antenna loaded by the thermistor only (red curve)
0 10 20 30 40 50 5,000 10,000 15,000 20,000 25,000 Top view Resistor and Inductor Bottom view Resistance [Ω] R C S [m m 2]
Fig. 6. Measured RCSs at 868 MHz of the antenna loaded by a resistance in series with an inductor of 10 nH as a function of the resistance value. Measurement results are in blue while simulation results are in red
V. CONCLUSION
In this paper, a new method was introduced to maximize both the reading range and the measurement sensitivity of wireless and passive Radiofrequency sensors. An application to the design of a temperature sensor was reported. Simulation and measurement results were in good agreement. It was shown that an appropriate choice of sensing device reactance allows improving simultaneously the wireless measurement sensitivity and reading range. Moreover the proposed method allows selecting the optimal sensing device for a given sensors antenna.
REFERENCES
[1] S. Bouaziz, F. Chebila, A. Traille, P. Pons, H. Aubert, and M. M. Tentzeris, “Novel Microfluidic Structures for Wireless Passive Tempera-ture Telemetry Medical Systems Using Radar Interrogation Techniques in Ka-Band,” IEEE Antennas and Wireless Propagation Letters, vol. 11, pp. 1706–1709, 2012.
[2] C. Balanis, Modern Antenna Handbook. Wiley.
[3] R. Green, The General Theory of Antenna Scattering, Columbus, 1963. [4] S. Dike and D. King, “The Absorption Gain and Back-Scattering Cross
Section of the Cylindrical Antenna,” Proceedings of the IRE, vol. 40, no. 7, pp. 853–860, Jul. 1952.
[5] C. C. Yen, A. E. Gutierrez, D. Veeramani, and D. v. d. Weide, “Radar Cross-Section Analysis of Backscattering RFID Tags,” IEEE Antennas and Wireless Propagation Letters, vol. 6, pp. 279–281, 2007.