Received: October 2, 2015; Accepted: December 19, 2015
© The Author 2015. Published by Oxford University Press. All rights reserved. For Permissions, please email: journals.permissions@oup.com. doi:10.1093/carcin/bgv251
Advance Access publication December 30, 2015 Original Manuscript
169
original manuscript
The tumoral A genotype of the MGMT rs34180180
single-nucleotide polymorphism in aggressive gliomas
is associated with shorter patients’ survival
Anne Fogli
1,2,3,4, Emmanuel Chautard
5,6, Catherine Vaurs-Barrière
1,2,3, Bruno Pereira
7,
Mélanie Müller-Barthélémy
5, Franck Court
1,2,3, Julian Biau
5,6, Afonso Almeida Pinto
8,
Jean-Louis Kémény
9, Toufic Khalil
10,11, Lucie Karayan-Tapon
12,13,14, Pierre Verrelle
5,6,15,
Bruno Marques Costa
16,17and Philippe Arnaud
1,2,3,*1INSERM-U1103 and 2CNRS-UMR 6293, Clermont-Ferrand 63001, France, 3GReD Laboratory, Clermont Auvergne University, Clermont-Ferrand 63000, France, 4Biochemistry and Molecular Biology Department, Ferrand Hospital, Clermont-Ferrand 63003, France, 5Clermont Auvergne University, EA 7283 CREaT, Clermont-Ferrand 63000, France, 6Radiotherapy Department, Jean Perrin Center, Clermont-Ferrand 63011, France, 7Biostatistics Department, DRCI, Clermont-Ferrand Hospital, Clermont-Ferrand 63003, France, 8Department of Neurosurgery, Braga Hospital, Braga 4710-243 São Victor, Portugal, 9Department of Anatomopathology, Clermont-Ferrand Hospital, Clermont-Ferrand 63003, France, 10Department of Neurosurgery, Clermont-Ferrand Hospital, Clermont-Ferrand 63003, France, 11Clermont Auvergne University, EA 7282 IGCNC, Clermont-Ferrand 63000, France, 12INSERM-U935, Poitiers 86021, France, 13Poitiers University, Poitiers 86000, France,
14Cancer Biology Laboratory, Poitiers Hospital, Poitiers 86021, France, 15INSERM U2021 CNRS UMR3347, Curie Institute, Orsay 91405, France, 16School of Health Sciences, Life and Health Sciences Research Institute (ICVS), Braga 4710-057, Portugal and 17ICVS/3B’s-PT Government Associate Laboratory, Braga/Guimarães, Braga 4710-057, Portugal
*To whom correspondence should be addressed. Tel: +33 4 73 17 83 80; Fax: +33 4 73 27 61 32; Email: philippe.arnaud@udamail.fr
Correspondence may also be addressed to Anne Fogli. Tel: +33 4 73 17 81 78; Fax: +33 4 73 27 61 32; Email: anne.fogli@udamail.fr
Abstract
Malignant gliomas are the most common primary brain tumors. Grade III and IV gliomas harboring wild-type IDH1/2 are the most aggressive. In addition to surgery and radiotherapy, concomitant and adjuvant chemotherapy with temozolomide (TMZ) significantly improves overall survival (OS). The methylation status of the O6-methylguanine-DNA methyltransferase (MGMT) promoter is predictive of TMZ response and a prognostic marker of cancer outcome. However, the promoter regions the methylation of which correlates best with survival in aggressive glioma and whether the promoter methylation status predictive value could be refined or improved by other MGMT-associated molecular markers are not precisely known. In a cohort of 87 malignant gliomas treated with radiotherapy and TMZ-based chemotherapy, we retrospectively determined the MGMT promoter methylation status, genotyped single nucleotide polymorphisms (SNPs) in the promoter region and quantified MGMT mRNA expression level. Each of these variables was correlated with each other and with the patients’ OS. We found that methylation of the CpG sites within MGMT exon 1 best correlated with OS and MGMT expression levels, and confirmed MGMT methylation as a stronger independent prognostic factor compared to MGMT transcription levels. Our main finding is that the presence of only the A allele at the rs34180180 SNP in the tumor was significantly associated with shorter OS, independently of the MGMT methylation status. In conclusion, in the clinic, rs34180180 SNP genotyping could improve the prognostic value of the MGMT promoter methylation assay in patients with aggressive glioma treated with TMZ.
Introduction
Malignant gliomas are the most common primary brain tumors. The World Health Organization (WHO) classifies them in four grades, based on their malignancy. Malignant anaplastic astro-cytoma (WHO grade III) and glioblastoma multiforme (GBM; WHO grade IV) are rapidly progressive and aggressive cancers with a short patient survival time after diagnosis. The standard management includes surgery, radiotherapy and concomitant temozolomide (TMZ) chemotherapy, followed by adjuvant TMZ. Treatment with this alkylating agent significantly improves both overall and progression-free survival of patients with newly diagnosed GBM, although the response is heterogene-ous (1,2). Molecular markers to predict TMZ effectiveness have been identified. For instance, the methylation status of the O6 -methylguanine-DNA methyltransferase (MGMT) gene promoter appears to be predictive of the TMZ response in patients with newly diagnosed GBM (3–5). This predictive feature has recently been confirmed also in patients with grade III glioma harboring wild type (about 30% of all grade III gliomas) (6), but not mutant Isocitrate Dehydrogenase 1 (IDH1) (7).
The predictive value of MGMT promoter methylation can be explained by the function of MGMT, a conserved DNA repair protein that removes DNA adducts, such as those induced by alkylating agents, and restores the normal nucleotide (8). Therefore, MGMT can antagonize TMZ genotoxic effects, lead-ing to tumor resistance. Accordlead-ingly, malignant gliomas in which MGMT expression is repressed by promoter methylation are more likely to respond to alkylating anticancer drugs (9). Consequently, much effort has been focused on the identifica-tion of the MGMT promoter regions the methylaidentifica-tion of which correlates best with gene repression. This led to the discovery that the methylation status of few CpG sites in the downstream promoter region that overlaps with exon 1 and a cis-acting enhancer sequence best reflects MGMT expression status (10– 13). Although methylation of this region is consistently associ-ated with better clinical response to TMZ treatment (5,12,14), it remains to be established whether it also best correlates with overall survival (OS) (12,13,15).
Moreover, a clinical decision should not be based only on the MGMT promoter methylation status, because discrepan-cies between methylation status and MGMT expression level have been observed in up to 20% of patients with GBM (10,16). This suggests the existence of an additional methylation-inde-pendent mechanism of MGMT expression regulation. Gene alterations could account for this mechanism. For instance, loss of heterozygosity (LOH) at chromosome 10q, where MGMT is located (10q26.1), is frequently found in patients with GBM (17) and has been associated with a better response to TMZ-based therapy (18). Similarly, a recent study on 61 patients with GBM showed that 70% of them had a loss of 10q26.1 and further stressed that silencing of MGMT results from combined effect of genetic loss and methylation (19). More subtle genetic defects could also influence MGMT transcriptional activity. For instance, in colorectal carcinoma (20) and lung cancer (21), the c.-56 C>T
(rs16906252) single-nucleotide polymorphism (SNP) located in the downstream MGMT promoter region strongly influences MGMT methylation and expression. Its effect in malignant glio-mas remains controversial. In patients with GBM, association of the T allele of rs16906252 with MGMT promoter methylation and longer survival was recently shown in two studies (14,22) but not in two others (5,23). The effect on MGMT expression and/or clinical outcome of the other referenced SNPs within or close to the MGMT promoter is poorly documented. Only one recent study described some haplotypes (several associated SNPs) in the promoter/enhancer region of MGMT that variably influence MGMT promoter activity and consequently its expression (24).
To identify MGMT-associated molecular markers that could help refining/improving or even substitute the MGMT methyla-tion assessment as a predictor of TMZ effectiveness, we ret-rospectively analyzed a cohort of 87 patients with malignant aggressive glioma who were treated with radiotherapy and alkylating agent-based chemotherapy after tumor resection. We determined MGMT methylation status and expression lev-els and the SNP genotype in its promoter region. Each of these molecular markers was correlated with each other and with the patients’ OS. Our study confirms that MGMT promoter meth-ylation is associated with a significant survival benefit in these patients. Moreover, the variant c.-368G>A (rs34180180) located in the MGMT promoter was significantly associated with glioma aggressiveness. OS was shorter in TMZ-treated patients with tumors carrying only the A allele. The deleterious effect of the c.-368G>A variant on survival was robust and independent of the MGMT promoter methylation status.
Materials and methods
Patients and samplesGlioma samples (n = 87) resected between 2007 and 2014 were obtained from three institutions: the Neurosurgery Unit at the Clermont-Ferrand University Hospital Center, France (n = 50) (‘Tumorothèque Auvergne Gliomes’, ethical approval DC-2012-1584), the Neurosurgery unit at the Poitiers University Hospital Center, France (n = 10) (Tumorothèque Poitiers DHOS/OPRC/FCnotif-tumoro-jun04: ethical approval 04056) and the Neurosurgery Department, Hospital de Braga, Portugal (n = 27). This study was approved by the ethics committees and the respective competent authorities. Patients signed a written individual informed consent accord-ing to institutional guidelines and samples were anonymized.
Tumor samples were the remaining material after the standard diag-nostic/prognostic analyses. Immediately after surgery, samples were snap-frozen and stored in liquid nitrogen. Random sections of each tumor were analyzed under a light microscope after hematoxylin–eosin staining to determine the extent of necrosis and the percentage of tumor cells. The 87 glioma samples all had more than 50% of tumor cells. Tumor his-tological diagnosis and grading were based on the WHO criteria. Four non-tumoral control samples of the corpus callosus (n = 1) and frontal cortex (n = 3) (white matter enriched in astrocytes and oligodendrocytes from which gliomas originate) were from the Brain and Tissue Bank of the Maryland (mean age of the donors: 27.3 ± 2 years). The four controls samples and 50/87 gliomas were homogenized by cryogenic grinding. Each homogenate was equally distributed in vials and used for matched genomic DNA and RNA extraction. For the other 37 gliomas, only genomic DNA was available. DNA was isolated from (i) frozen tissues (n = 27 sam-ples from Braga hospital and 50 samsam-ples from Clermont-Ferrand hospital) using the QIAamp DNA Mini Kit (Qiagen, Hamburg, GmbH), according to the manufacturer’s recommendations, or (ii) from paraffin-tissue blocks (n = 10 samples from Poitiers hospital) using the FFPE DNA Extraction Kit (Qiagen, Hamburg, GmbH). All samples were stored at −80°C until use.
OS was calculated as the number of days between the surgery date and the patient’s death. Tumor resection was classified as gross total resec-tion (GTR), when no enhanced contrast was detected 48 h postsurgery, or Abbreviations
GBM glioblastoma multiforme
HR hazard ratio
LOH loss of heterozygosity
OS overall survival
SNP single-nucleotide polymorphism
TMZ temozolomide
as partial resection (PR), when enhanced contrast was still detected 48 h postsurgery.
IDH1 mutation analysis and MGMT SNP genotyping IDH1 genotyping was performed by EpigenDx (Worcester, MA) in 50 tumor samples (EpigenDx pyrosequencing assays ADS1703 and ADS1704). In the other 37 samples, we analyzed the most frequent IDH1 mutations in exon 4 (codon 132) using PCR-RFLP (25).
For MGMT SNP genotyping, tumor (n = 87) and, when available, blood (n = 27) genomic DNA samples were PCR-amplified using 0.5 µM of each primer (5′–3′: AGGCTCTGGCAGTGTCTAGG and AAAGGCTGGGCAACACCT and the Kapa 2G Robust Hotstart Ready mix (Kapabiosystems, Boston) according to the manufacturer’s instructions (annealing temperature: 60°C). The obtained 938-bp MGMT fragment encompassing 16 SNPs (from rs1625649 to rs149452540) was sequenced by GATC Biotech (Mulhouse, France).
MGMT methylation analysis
The MGMT promoter and exon 1 methylation status in 50 tumors and the four controls was determined by EpigenDx (Worcester, MA) using the bisulfite based-pyrosequencing assays ASY514FS1/ASY514FS3/ASY470FS1. Data were provided as the methylation percentage of the 21 CpG sites analyzed (their GRCh37:Hg19 coordinates are provided in Supplementary Figures 1 and 2, available at Carcinogenesis Online).
For the other 37 tumor DNA samples, MGMT methylation status was analyzed using the PyroMark MGMT kit (Qiagen). Chemically methylated and unmethylated human genomic DNA controls (EpiTect PCR Control DNA Set, Qiagen) were included in each batch. Briefly, 40 ng of tumor DNA were bisulfite-modified using the EZ DNA methylation kit (Zymo Research, Orange, CA) according to the manufacturer’s recommendations. The CpG pyrosequencing methylation assay using the Qiagen kit was performed on a PSQ 96 MA system (Qiagen) according to the manufacturer’s proto-col. The PyroMark MGMT kit quantifies the level of methylation of five individual CpG sites within exon 1 of MGMT using the Pyromark CpG soft-ware (Qiagen). The MGMT promoter was defined as unmethylated when the mean methylation of the five CpG sites was <8%, and as methylated when ≥8% (14).
MGMT expression analysis
Total RNA was isolated from 50 tumors using the RNeasy Mini Kit (Qiagen, Hamburg, GmbH). The RNA quality was tested on an Agilent Bioanalyzer (Agilent) according to the manufacturer’s instructions and only samples with RIN >6 (n = 35) were retained for RT-QPCR analysis.
Two independent reverse transcription reactions were performed using 250 ng of RNA and the High Capacity cDNA Reverse Transcription kit (Applied Biosystems) according to the manufacturer’s instructions. Quantitative PCR was performed on a Taqman 7300 apparatus using the Taqman Probe technology (Applied Biosystems) with specific primers and probes (Taqman Gene Expression Assay): FAM Hs01037698_ml (MGMT) and VIC Hs02800695_ml (HPRT1). About 4 µl of cDNA (diluted 1:5) were ampli-fied with 1× Taqman Gene Expression Master Mix (Applied Biosystems) and 1× Taqman Gene Expression Assay in a final volume of 20 µl. The pro-gram included an initial step of incubation with uracil-DNA glycosylase (UDG) at 50°C for 2 min and a step of enzyme activation at 95°C for 10 min followed by 40 cycles of 95°C for 15 s, 60°C for 1 min. The cycle of threshold (Ct) values were used to calculate MGMT expression, normalized to HPRT1 levels. Expression levels were calculated using the 2−ΔΔCt equation with
ΔCt = Ct (MGMT gene) – Ct (HPRT1 gene) and ΔΔCt = ΔCt (tumor) – mean ΔCt (non-neoplastic tissues) (26). For each condition, the presented data were obtained from two independent qPCR experiments, each analyzed in duplicate.
Copy-number variation assay
The copy-number assay has been performed using the CytoScan HD array from Affymetrix.This technology analysed more than 2.6 millions copy number markers among them 750 000 SNP and 1.9 million non-polymor-phic markers, in order to ensure high-resolution coverage of the genome. Array processing, and normalization were performed by the Genosplice platform, using GAP (Genome Alteration Print) software (27). Data analyses
were conducted using the R software. Using this technology, we can detect copy-neutral LOH: 8/25 (32%) in our cohort.
Statistical analysis
Statistical analysis was performed using the Stata software, version 13 (StataCorp, College Station, TX). Tests were two-sided, with a type I error set at α = 0.05. Baseline characteristics are presented as mean ± stand-ard deviation (SD) or as median (interquartile range) for each inde-pendent group for continuous data, and as number of patients and the associated percentages for categorical parameters. When appropriate, quantitative variables have been categorized according to statistical dis-tribution, clinical relevance and sensitivity analyses. Variables were com-pared between groups using the Chi-squared or Fisher’s exact test for categorical variables, and the Student’s t test or Mann–Whitney test for quantitative variables, with normality verified by the Shapiro–Wilk test and homoscedasticity by the Fisher–Snedecor test. To study the relation between quantitative parameters (expression and methylation status), Pearson or Spearman correlation coefficients were estimated according to the statistical distribution. OS was defined as the interval from surgery to death, regardless of the cause of death. OS curves and estimates were constructed using the Kaplan–Meier method. To test the prognostic value of the patients’ characteristics in univariate context, OS curves were com-pared between groups using log-rank test or Prentice modified Wilcoxon log-rank test when the ratio of hazards were higher at early survival times than at late ones. The log-rank test was used in univariate analyses to test the prognostic value of the patients’ characteristics. Multivariate analy-sis (Cox proportional hazards regression) was used to take into account the adjustment for possible confusing factors, according to the univari-ate analysis and the clinical relevance (age, sex, grade, MGMT status). The proportional hazard hypotheses were verified using the Schoenfeld’s test and plotting residuals. The interactions between possible predictive fac-tors were also tested. Results are expressed as hazard ratios (HRs) and 95% confidence intervals (CIs).
Results
Clinical features of the cohort
The 87 aggressive gliomas used in this study were classified as grade IV GBM (n = 59; mean age at diagnosis: 62.8 ± 9.3 years, range: 40–81 years) and grade III glioma (n = 28; mean age: 58.1 ± 11.5 years, range: 29–75 years) and all had wild-type IDH. All patients were treated by surgery followed by chemo-therapy (TMZ), according to the local procedures. The median age at surgery for the entire cohort was 61.3 years (range: 29–81 years). The demographic and clinical features are pre-sented in Table 1.
OS was similar in patients with GBM [median: 18.6 months (13.2–45.4)] or with grade III glioma [median: 17.2 months (10.5– 24.3)], with a median survival of 18.2 months for the entire cohort [11.0–35.9] (Figure 1). Therefore, the 87 tumors were referred as ‘aggressive gliomas’. Despite the poor prognosis of aggressive glioma and as described previously (4), five patients (5.7%) displayed extended survival (>4 years) and were consid-ered as long-term survivors (Figure 1).
MGMT methylation and MGMT mRNA expression The CpG island located in the 5′ region of MGMT includes 98 CpG sites (Supplementary Figure 1, available at Carcinogenesis Online) that are normally unmethylated. Methylation of exon 1, which is embedded in the CpG island, is associated with MGMT expression in brain tumors and response to TMZ (5,10–13). However, it is not clear whether it also best correlates with OS (12,13,15). Therefore, to determine whether methylation of a specific region within the MGMT promoter best correlated with OS, we selected 21 CpG sites that cover the downstream pro-moter region (CpG #72 to #78) as well as two ‘upstream’ regions
(CpG #7 to #14 and CpG #22 to #27) selected because their meth-ylation is documented to be associated with MGMT expression (Supplementary Figure 1, available at Carcinogenesis Online) (10– 12). We then assessed their methylation status by pyrosequenc-ing analysis in the 50/87 tumor samples with sufficient amounts of high-quality DNA.
We found a strong correlation between the methylation status of ten CpG sites and OS (*P ≤ 0.05) (univariate analyses,
Supplementary Figure 2, available at Carcinogenesis Online). Three of these CpG sites (#10, *P = 0.039; #26, *P = 0.03; and #27, *P = 0.03) were located upstream of the ATG. The other seven were in a row within exon 1, between positions +14 and +46 after the ATG codon (#72, **P = 0.009; #73, **P = 0.009; #74, ***P ≤ 0.001; #75, **P = 0.004; #76, *P = 0.025; #77, **P = 0.008; and #78,
*P = 0.03) (Supplementary Figure 1, available at Carcinogenesis Online). In addition, the mean methylation of these seven CpGs best correlated with OS (**P = 0.002). Methylation of five of these seven CpG sites (#74 to #78) can be assessed also using a standardized commercial kit (PyroMark MGMT Kit, Qiagen) that was used for the 37 remaining tumors with lim-ited amount of DNA. Therefore, for the successive analyses concerning MGMT promoter methylation, we used the mean percentage of methylation at these five CpG sites for all the 87 samples.
In the whole cohort, the level of methylation ranged from 0 to 60.6% (mean: 14 ± 17%, median: 3.1%) (Table 1). With the methyla-tion cut-off value of 8%, which is generally used in the literature to evaluate MGMT promoter methylation status (4,14), we found a 2-year survival rate of 58.7% in patients with MGMT promoter methylation (≥8%) and of 20.2% for patients with unmethyl-ated MGMT (<8%) (**P = 0.004; Table 2). The median survival was 16.8 months for patients with MGMT methylation <8% (61.6%) and 27.6 months for patients with MGMT methylation ≥8% (38.4%). The HR for death was 0.39 (95% CI: 0.21–0.74), indicating a 61% relative reduction in the risk of death for patients with MGMT methylation ≥8%. These results confirm that MGMT meth-ylation status is a positive prognostic factor in patients with aggressive glioma.
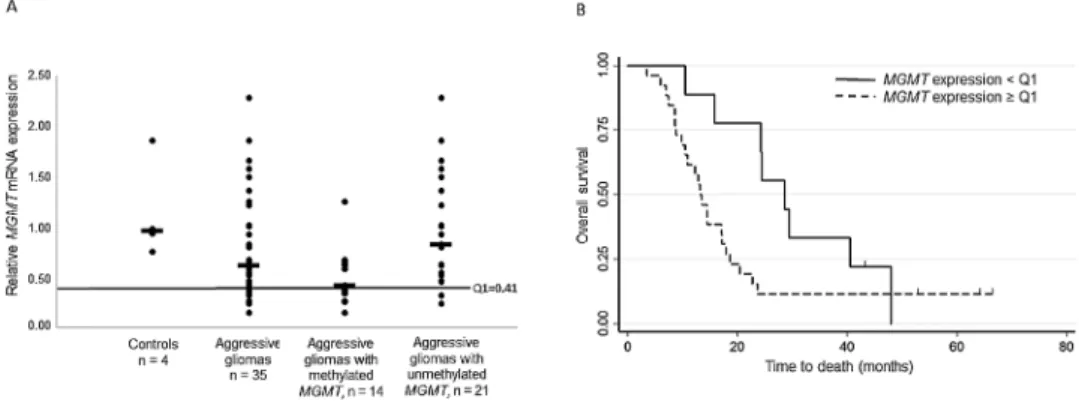
To test the prognostic effect of MGMT expression relative to MGMT promoter methylation, we then quantified MGMT tran-script level in the 35 tumors with high-quality mRNA. MGMT expression in the tumors was reduced by ~40% compared to control brain tissue samples (Figure 2A). When we used the first quartile of MGMT expression as cut-off (Q1 = 0.41 fold change compared to control) and the Tarone–Ware test for equality of survivor functions, we found a significant survival advan-tage for patients with low-expressing tumors (<Q1) (HR = 2.14 and 95% CI: 0.93–2.92; *P = 0.02, Table 2). The 2-year survival rate was 77.7% in patients with low MGMT mRNA expression (<Q1) and 11.5% in patients with high MGMT expression (≥Q1). The median survival was 28.5 months for patients with MGMT expression < Q1 (25.7%) and 13.2 months for patients with MGMT expression ≥ Q1 (74.2%). Kaplan–Meier survival curves (Figure 2B) validated MGMT expression as a significant prog-nostic marker at 2 years.
We then evaluated the robustness of MGMT expression as a prognostic marker relative to MGMT promoter methylation. Overall, MGMT expression correlated negatively with the pro-moter methylation status (Pearson correlation: r = −0.6, ***P ≤ 0.001). The median mRNA expression (in fold change) in meth-ylated (≥8%) and unmethmeth-ylated (<8%) tumors was 0.42 (range: 0.15–1.26) and 0.83 (range: 0.24–2.29), respectively, in comparison with 0.62 in the whole cohort and to 0.96 (range: 0.76–1.86) in the four control samples (Figure 2A).
We observed discordant findings in nine patients (25.7%): MGMT methylation (≥8%) co-occurred with high mRNA expres-sion (≥Q1) in seven patients, and methylation <8% with low expression levels (<Q1) in two patients.
Multivariate Cox analysis (see Methods) (Table 2) highlighted that MGMT expression was still linked to survival, independently of MGMT methylation (HR = 7.40, 95% CI: [1.42–38.69], *P = 0.02). However, MGMT methylation was a stronger independent prognos-tic factor (HR = 0.28, 95% CI: 0.11–0.73, **P = 0.009). After adjusting for MGMT expression, MGMT promoter methylation still showed a statistically significant effect on overall survival (analysis of group comparisons by Cox regression, *P ≤ 0.05; Table 2). This confirms the robustness of MGMT promoter methylation as an independent prognostic factor in our population of aggressive gliomas.
Table 1. Demographic and molecular features of the 87 patients with
aggressive glioma
Characteristicsa Nb of patients %
Sex
Male 51/87 59
Female 36/87 41
Age at diagnosis (years) 87/87 Mean (SD) 61.3 (10.2) Range 29–81 Treatment R + TMZ = ‘Stupp’ 87/87 100 Resection Total 43/84 51 Partial 41/84 49
Presence of IDH1 mutation 0/87 0 Presence of LOH on 1Oq 25/25 100 Presence of 1p19q codeletion 3/47 6 MGMT promoter methylation 86/87 Non-methylated (<8%) 53/86 61.6 Methylated (≥8%) 33/86 38.4 MGMT expression 35/87 Mean (SD) 78% (40) Median 62% Range 15–229% First quartile = Q1 41% Polymorphic SNP genotypes in tumors
rs1625649 Only C:35/49 72 Only A:10/49 20 A/C:4/49 8 rs113813075 Only A:1/50 2 A/C:2/50 5 Only C: 47/50 93 rs34180180 Only A: 7/87 8 A/G: 4/87 4.6 Only G: 76/87 87.4 rs34138162 Only A:1/50 2 A/C:1/50 2 Only C:48/50 96 rs181536588 Only A:1/47 2 Only T:46/47 98 rs16906252 Only C:73/80 91 C/T: 2/80 3 Only T: 5/80 6 Overall survival (months)
Median 18.2
Range 11.0–35.9
aMGMT methylation is the mean of the methylation of five CpG sites located
between the Hg19 coordinates: 131265507 to 131265526 (CpG sites #74 to #78 in
Supplementary Figure 1, available at Carcinogenesis Online).
Nevertheless, this prognostic marker is not 100% specific. Eight patients with high level of MGMT promoter methylation (>30%) had a shorter OS (below 16.8 months, the median OS in patients
with unmethylated promoter), and three patients with unmethyl-ated MGMT promoter (<8%) were still alive after 27.6 months (the median OS for patients with methylated promoter) (Figure 3A). Figure 1. Kaplan–Meier survival curves of our cohort (87 patients with aggressive glioma). (A) Kaplan–Meier survival curves of patients with grade III glioma (n = 28 patients, median OS: 17.2 months) or GBM (n = 59 patients, median OS: 18.6 months) (WHO glioma classification). (B) Kaplan–Meier survival curves of the whole cohort of 87 patients with aggressive glioma (median OS: 18.2 months).
Figure 2. MGMT mRNA expression is correlated with OS. (A) MGMT mRNA expression measured as fold change relative to HPRT1 (see, Material and Methods) in controls (normal brain tissue; n = 4), aggressive gliomas (n = 35 tumors with good quality mRNA) and aggressive gliomas with methylated (≥8%; n = 14) or non-methylated MGMT promoter (<8%; n = 21). Horizontal bars indicate the medians (0.96, 0.62, 0.42 and 0.83, respectively). The black line indicates the cut-off value (first quartile, Q1 = 0.41 fold change) used to distinguish tumors with low (<Q1) or high (≥Q1) MGMT mRNA expression. (B) Kaplan–Meier survival curves based on the classification of patients according to the tumor MGMT mRNA expression: high (≥Q1; n = 14) or low (<Q1; n = 21), with Q1 = 0.41 (fold change).
Table 2. Association between demographic characteristics, molecular markers and overall survival in our cohort
Demographic and molecular features
Univariate analysis Multivariate analysis
Log-rank P (OS) Hazard ratio 95% CI P (OS) Hazard ratioa 95% CI
Sex (female versus male) 0.70 0.9 0.52–1.56 — — —
Age at diagnosis (years) 0.03 1.02 1.01–1.05 0.02 1.04 1.01–1.08 Resection (complete versus partial) 0.24 0.72 0.42–1.25 0.79 1.12 0.47–2.62
MGMT expression (≥ versus < Q1) 0.02 2.14 0.93–2.92 0.02 7.40 1.42–38.69 MGMT methylation (≥ versus < 8%) 0.004 0.39 0.21–0.74 0.009 0.28 0.11–0.74 Polymorphic SNP rs1625649 0.20 NA NA — — — rs113813075 0.15 NA NA — — — rs34180180
Only A versus A/G 0.06 NE NE NE NE NE
Only A versus only G <0.001 0.17 0.07–0.44 0.02 0.18 0.04–0.70 Only A versus only G + A/G <0.001 0.17 0.06–0.42 0.01 0.17 0.04–0.69
rs34138162 0.006a NA NA — — —
rs181536588 <0.001a NA NA — — —
rs16906252 (T/T+C/T versus C/C) 0.56 0.77 0.32–1.82 — — —
CI, confidence interval; NA, not available; NE, not evaluated (the four patients with the A/G genotype for rs34180180 are all alive).
aThe significant effect was due to the low number of tumors with low-frequency genotypes (2/50 patients with the A allele for rs34138162; and 1/47 patient with the
A allele for rs181536588).
Presence of only the A allele at the c.-368G>A (rs34180180) SNP is associated with shorter survival in aggressive gliomas
With the aim of identifying methylation-independent MGMT gene-related factors that could be associated with survival, we investigated 16 SNPs (from rs1625649 to rs149452540) located in the MGMT promoter and exon 1. Most of the less frequent vari-ants of these SNPs show low allelic frequency in the European populations (Supplementary Table 1A, available at Carcinogenesis Online). Consistently, only six of the 16 SNPs were polymorphic in our cohort (Table 1, Supplementary Figure 1 and Supplementary Table 1B, available at Carcinogenesis Online). Among them, none was found associated with MGMT expression and only rs16906252 was associated with MGMT methylation (**P = 0.003), in agreement with previous studies (14,22). More interestingly, the c.-368G>A SNP (rs34180180), for which 12.6% of our patients carried the A allele (A/G genotype: n = 4; A allele only: n = 7), was the only SNP significantly associated with patient survival (Table 2) and we thus focused our analyses on it.
To evaluate LOH, we performed copy number variation anal-yses, using the Cytoscan HD array from Affymetrix, in 25/87 (28%) tumor samples, including four of the seven tumors carry-ing only the A allele of rs34180180 (‘only A’) (data not shown). All displayed LOH at chromosome 10, suggesting that this alteration might be widespread in our cohort. Moreover, comparison of the SNP genotyping results in tumor and blood samples revealed a LOH of the G-carrying allele in two other ‘only A’ tumors (blood DNA: A/G and tumor DNA: A allele only). This indicates that at least six of the seven ‘only A’ tumors were hemizygous A/-.
We then split our cohort in three groups, according to the tumor genotype at the rs34180180 SNP: ‘only A’ (n = 7), A/G (n = 4), or ‘only G’ allele (n = 76). The Kaplan–Meier survival curve indi-cated that OS was clearly reduced in ‘only A’ carriers (log-rank test, ***P ≤ 0.001) (Figure 4). Their median survival time was significantly shorter (8.52 months compared with 18.48 months for ‘only G’ patients). We excluded the four patients with the A/G genotype, who are all still alive, from further statistical analyses because of the short follow-up (mean of 10.8 months, two times shorter than the median survival time of ‘only G’ patients) and low number.
To measure the robustness of the rs34180180 genotype (‘only A’ and ‘only G’) as a prognostic factor and its possible association with MGMT promoter methylation, we compared the methyla-tion status between groups. MGMT promoter mean methylamethyla-tion
was not significantly different between groups (20.1% in ‘only A’ and 14.2% in ‘only G’ tumors; P = 0.23). Cox multivariate analysis (see Methods) indicated that the MGMT promoter methylation status and rs34180180 genotype were independent prognostic factors with an adjusted HR of 0.28 (**P = 0.009, 95% CI: 0.11–0.74) for the methylation status (≥8%) and 0.18 (*P = 0.02, 95% CI: 0.04–0.70) for the ‘only G’ genotype (Table 2). Moreover, the risk of death was reduced by 82% in the ‘only G’ carriers compared with the ‘only A’ carriers. The reduction of the death risk was 72% in patients with methylated MGMT promoter compared with patients with unmethylated promoter without any synergic effect (Table 2, see HRs). In conclusion, the tumoral rs34180180 A genotype in aggressive gliomas is a strong biomarker of poor prognosis, independently of MGMT promoter methylation, resec-tion type, age at diagnosis and MGMT expression.
Discussion
In aggressive gliomas with wild-type IDH1, MGMT promoter methylation predicts a better response to alkylating agent-based chemotherapy and longer survival (3,4,28,29). Here, we provide evidence that, besides DNA methylation, the tumor genotype of Figure 3. Distribution of the patients depending on the tumor MGMT promoter methylation, MGMT expression, OS and rs34180180 genotypes. (A) OS (in months) in function of MGMT promoter methylation (mean %), n = 87 gliomas; rs34180180 genotype: A, red; A/G, green; G grey. (B) OS (in months) in function of MGMT mRNA expression (fold change), n = 35 gliomas; rs34180180 genotype: A, red; G, black; MGMT promoter methylation: <8% (dots) or ≥8% (triangles).
Figure 4. A allele only at the rs34180180 SNP in gliomas is associated with shorter survival. Kaplan–Meier survival curves based on the patients’ classifica-tion according to the rs34180180 SNP genotype: tumors with only A (n = 7), with A/G (n = 4) and with only G (n = 76).
the rs34180180 SNP, located in the MGMT promoter, is associated with survival in aggressive glioma.
In most studies, MGMT promoter methylation is assessed by analyzing a handful of CpG sites located in exon 1, in the downstream part of the GpG island (2,5,14). Methylation in this region has been consistently best correlated with MGMT expres-sion status, compared to other part of the MGMT CpG island (10–13). However, only few studies comprehensively evaluated whether methylation in this region also correlates best with sur-vival in patients with aggressive glioma (12). To gain insight into this important issue we used the quantitative pyrosequencing approach, which is currently the most sensitive and reproduc-ible technique (15,30,31) to analyze this downstream promoter region and two other regions selected for their correlative asso-ciation with MGMT expression (10–12). Although we observed a strong correlation between CpG methylation and survival for all three regions, methylation of the CpG sites #72 to #78, which are located in the downstream region, best correlated with survival in univariate and multivariate (with exception of #76) analyses (Supplementary Table 1, available at Carcinogenesis Online). The availability of a commercial pyrosequencing kit to test the CpG sites #74 to #78, and though encompassing #76, further facilitates this approach and allows comparing results from one laboratory to another. Using the mean methylation of the CpG sites #74 to #78 and 8% as a cut-off, we found that in our cohort, MGMT methylation is significantly associated with MGMT expression and that the mean methylation value is a more robust prognostic factor than MGMT expression. Our observations support and confirm that, currently, pyrosequenc-ing analysis of the DNA methylation status of the CpG sites #72 to #78 is the most relevant approach in the clinic to evaluate the outcome of patients with aggressive glioma harboring wild-type IDH1 and treated with alkylating agents.
However, the correlation between MGMT promoter methyla-tion, MGMT expression and clinical outcome shows some dis-crepancies. Specifically, we observed in nine patients (25.7%) discordances between MGMT promoter methylation and gene expression, in agreement with the ratio of 20% observed in other studies (10,16). While MGMT expression from non-tumor cells could have contributed to overestimate tumor MGMT expression in the seven patients with methylated MGMT promoter, this can-not explain the low mRNA expression in the two glioma sam-ples with low promoter methylation. Similarly, eight patients with high MGMT promoter methylation (>30%) in the tumor had a survival time shorter than 16.8 months (the median survival in patients with unmethylated tumor). Conversely, three patients with unmethylated promoter (<8%), survived above 27.6 months (the median survival for patients with methylated MGMT pro-moter) (Figure 3A). This suggests a methylation-independent mechanism of MGMT expression regulation and response to TMZ treatment. The observation that some patients with long survival have unmethylated MGMT promoter and weak MGMT expression further supports this hypothesis (Figure 3B).
LOH at chromosome 10q, the most frequent genetic altera-tion found in patients with GBM (60–90%) (17), can directly influ-ence MGMT expression. The 25 samples (28%) analyzed in this study all displayed LOH, strongly suggesting that it is largely widespread in our cohort. Its prominence indicates that LOH at chromosome 10q cannot be used to discriminate patients relative to MGMT expression and response to TMZ treat-ment. By focusing on MGMT SNPs, we found that rs34180180 is significantly associated with patient survival in our cohort. Independently of the MGMT methylation status, age at diagnosis and surgical resection type, the presence of only the A allele in
the tumor is a strong bad prognostic factor. Strikingly, among the 616 healthy Caucasian genomes sequenced in the ‘1000 genome’ and ‘Hapmap’ projects, none display the homozygous A/A genotype at rs34180180 (78 A/G; 538 G/G). In addition, we found that at least six of the seven ‘only A’ tumors are hemizy-gous A/-. This supports the hypothesis that in these patients, the presence of only one A allele in the tumor results from LOH for the G-carrying allele, as confirmed for the two patients for whom we had matched blood DNA.
Concerning the identification of a putative methylation-inde-pendent mechanism of MGMT expression regulation, rs34180180 is located 367 bp upstream of the ATG, in a 35bp region of the CpG island depleted of methylable CpG sites (Supplementary Figure 1, available at Carcinogenesis Online) and enriched in pre-dicted transcription factor binding sites, as determined using ALGGEN (http://alggen.lsi.upc.es/). Specifically, the G to A transi-tion at rs34180180 leads to the loss of a predicted binding site
(TTGGCCCA) for NF-1 and C/EBP (CCAAT/enhancer binding
fac-tor) and the creation of a c-JUN binding site (TGACAAA). C-JUN
is a members of the AP-1 family of transcription factors and a proto-oncogene involved in cancer onset and progression (32). C-JUN RNA and protein are up-regulated in aggressive gliomas, further contributing to the malignant properties of glioblas-toma cells (33). We could hypothesize that in ‘only A’ tumors, C-JUN, or another transcription factor, contributes to MGMT up-regulation, independently of the DNA methylation pattern at the MGMT CpG island, ultimately leading to TMZ resistance and decreased survival. In agreement, among the seven ‘only A’ tumors, three are methylated (23, 32 and 60% of methylation) and the four (including one with methylated promoter) with enough RNA showed high MGMT expression (≥Q1).
Unlike two others recent studies (14,22), we did not observed an association between the T allele at rs1606952 and a longer survival in our cohort, although we detected an association with promoter methylation (**P = 0.003). It can be noticed that the number of patient carrying the T allele (7/80) is probably too limited to detect an association with survival. Nonetheless, with a similar number of patients carrying the A allele only at rs34180180 SNP (7/87) we observed an association with shorter patients’ survival, underscoring the robustness of the prog-nostic value for this tumor genotype. In addition, and despite the small sample size, results associated to rs34180180 tumor genotype fulfill the criterions defined by Feise (34) with respect to statistical significance but also to magnitude of effect with a median survival of 8.52 months for ‘only A’ compared with 18.48 months, for ‘only G’ patients (HR = 0.17 [0.07 – 0.44],
Table 2). Moreover, a sensitivity analysis (simulations about rs34180180 on survival) reinforces the existence of a robust trend for an association between rs34180180 tumor geno-type and patient’s survival. Our pioneer study at rs34180180 SNP paves thus the way for further validation in independent cohorts. Because of the absence of this non-exonic SNP in open-access resources (i.e: exomes and SNP arrays) available at the cancer genome atlas database (TCGA) (http://cancergenome. nih.gov/), dedicated molecular studies have to be conducted on other cohorts of aggressive gliomas.
In summary, we show that the A/- genotype of the MGMT rs34180180 SNP, resulting from the loss of the G-carrying allele, is associated with shorter OS. This is irrespective of the tumor MGMT methylation status and therefore, can account for the discordance between this marker and clinical out-come in some patients. In the clinic, rs34180180 genotyping (a simple test) might improve the prognostic value of the MGMT promoter methylation assay in TMZ-treated patients
with aggressive glioma and may help to individualize clinical decision-making.
Supplementary material
Supplementary Figures 1 and 2 and Supplementary Table 1 can be found at http://carcin.oxfordjournals.org/
Funding
Agence National de la Recherche (ANR 2010 JCJC 1601 ‘Bivandev’); the ‘Fondation ARC pour la Recherche sur le Cancer’ (EML20120904843); La Ligue contre le Cancer comités Puy de Dôme et Ardéche; the ‘Conseil régional d’Auvergne’ grants awarded to P.A; the Plan Cancer-INSERM (CS14085CS ‘Gliobiv’) awarded to P.V, L.K.T and P.A. and a Fundação para a Ciência e Tecnologia (PTDC/SAU-GMG/113795/2009) grant awarded to B.M.C.
Acknowledgements
We thank Laurent Parry and Stéphanie Maupetit-Méhouas for technical assistance with pyrosequencing. We thank the CHU Clermont-Ferrand’s Neurosurgery service (Prof. JJ. Lemaire) for its precious help in completing this study.
Conflict of Interest Statement: None declared.
References
1. Stupp, R. et al. (2005) Radiotherapy plus concomitant and adjuvant temozolomide for glioblastoma. N. Engl. J. Med., 352, 987–996. 2. Stupp, R. et al. (2009) Malignant glioma: ESMO clinical
recommenda-tions for diagnosis, treatment and follow-up. Ann. Oncol., 20, 126–128. 3. Hegi, M.E. et al. (2005) MGMT gene silencing and benefit from
temozo-lomide in glioblastoma. N. Engl. J. Med., 352, 997–1003.
4. Reifenberger G. et al. (2012) Predictive impact of MGMT promoter meth-ylation in glioblastoma of the elderly. Int. J. Cancer, 131, 1342–1350. 5. Felsberg, J. et al. (2009) Prognostic significance of molecular markers
and extent of resection in primary glioblastoma patients. Clin. Cancer Res., 15, 6683–6693.
6. Yan, H. et al. (2009) IDH1 and IDH2 mutations in gliomas. N. Engl. J. Med., 360, 765–773.
7. Wick, W. et al. (2013) Prognostic or predictive value of MGMT promoter methylation in gliomas depends on IDH1 mutation. Neurology, 81, 1515–1522.
8. Pegg, A.E. (2000) Repair of O(6)-alkylguanine by alkyltransferases. Mutat. Res., 462, 83–100.
9. Silber, J.R. et al. (2012) O(6)-methylguanine-DNA methyltransferase in gli-oma therapy: promise and problems. Biochim. Biophys. Acta, 1826, 71–82. 10. Everhard, S. et al. (2009) Identification of regions correlating MGMT
promoter methylation and gene expression in glioblastomas. Neuro. Oncol., 11, 348–356.
11. Malley, D.S. et al. (2011) A distinct region of the MGMT CpG island criti-cal for transcriptional regulation is preferentially methylated in glio-blastoma cells and xenografts. Acta Neuropathol., 121, 651–661. 12. Shah, N. et al. (2011) Comprehensive analysis of MGMT promoter
methylation: correlation with MGMT expression and clinical response in GBM. PLoS One, 6, e16146.
13. Bady, P. et al. (2012) MGMT methylation analysis of glioblastoma on the Infinium methylation BeadChip identifies two distinct CpG regions associated with gene silencing and outcome, yielding a prediction
model for comparisons across datasets, tumor grades, and CIMP-sta-tus. Acta Neuropathol., 124, 547–560.
14. McDonald, K.L. et al. (2013) The T genotype of the MGMT C>T (rs16906252) enhancer single-nucleotide polymorphism (SNP) is asso-ciated with promoter methylation and longer survival in glioblastoma patients. Eur. J. Cancer, 49, 360–368.
15. Quillien, V. et al. (2012) Comparative assessment of 5 methods (methyl-ation-specific polymerase chain reaction, MethyLight, pyrosequencing, methylation-sensitive high-resolution melting, and immunohisto-chemistry) to analyze O6-methylguanine-DNA-methyltranferase in a series of 100 glioblastoma patients. Cancer, 118, 4201–4211.
16. Kreth, S. et al. (2011) O-methylguanine-DNA methyltransferase (MGMT) mRNA expression predicts outcome in malignant glioma independent of MGMT promoter methylation. PLoS One, 6, e17156.
17. Furnari, F.B. et al. (2007) Malignant astrocytic glioma: genetics, biology, and paths to treatment. Genes Dev., 21, 2683–2710.
18. Wemmert, S. et al. (2005) Patients with high-grade gliomas harboring deletions of chromosomes 9p and 10q benefit from temozolomide treatment. Neoplasia, 7, 883–893.
19. Ramalho-Carvalho, J. et al. (2013) Altered expression of MGMT in high-grade gliomas results from the combined effect of epigenetic and genetic aberrations. PLoS One, 8, e58206.
20. Ogino, S. et al. (2007) MGMT germline polymorphism is associated with somatic MGMT promoter methylation and gene silencing in colorectal cancer. Carcinogenesis, 28, 1985–1990.
21. Leng, S. et al. (2011) The A/G allele of rs16906252 predicts for MGMT methylation and is selectively silenced in premalignant lesions from smokers and in lung adenocarcinomas. Clin. Cancer Res., 17, 2014– 2023.
22. Rapkins R.W. et al. (2015) The MGMT promoter SNP rs16906252 is a risk factor for MGMT methylation in glioblastoma and is predictive of response to temozolomide. Neuro Oncol, 17, 1589–1598.
23. Zawlik, I. et al. (2009) Promoter methylation and polymorphisms of the MGMT gene in glioblastomas: a population-based study. Neuroepide-miology, 32, 21–29.
24. Xu, M. et al. (2014) Influence of promoter/enhancer region haplotypes on MGMT transcriptional regulation: a potential biomarker for human sensitivity to alkylating agents. Carcinogenesis, 35, 564–571.
25. Elsayed, G.M. et al. (2014) Prognostic value of IDH1 mutations identified with PCR-RFLP assay in acute myeloid leukemia patients. J. Egypt. Natl. Canc. Inst., 26, 43–49.
26. Livak, K.J. et al. (2001) Analysis of relative gene expression data using real-time quantitative PCR and the 2(-Delta Delta C(T)) method. Meth-ods, 25, 402–408.
27. Popova, T. et al. (2009) Genome Alteration Print (GAP): a tool to visual-ize and mine complex cancer genomic profiles obtained by SNP arrays. Genome Biol., 10, R128.
28. Siegal, T. (2015) Clinical impact of molecular biomarkers in gliomas. J. Clin. Neurosci., 22, 437–444.
29. Wick, W. et al. (2014) MGMT testing–the challenges for biomarker-based glioma treatment. Nat. Rev. Neurol., 10, 372–385.
30. Karayan-Tapon, L. et al. (2010) Prognostic value of O6-methylguanine-DNA methyltransferase status in glioblastoma patients, assessed by five different methods. J. Neurooncol., 97, 311–322.
31. Christians, A. et al. (2012) Prognostic value of three different meth-ods of MGMT promoter methylation analysis in a prospective trial on newly diagnosed glioblastoma. PLoS One, 7, e33449.
32. Eferl, R. et al. (2003) Liver tumor development. c-Jun antagonizes the proapoptotic activity of p53. Cell, 112, 181–192.
33. Blau, L. et al. (2012) Aberrant expression of c-Jun in glioblastoma by internal ribosome entry site (IRES)-mediated translational activation. Proc. Natl. Acad. Sci. USA, 109, E2875–E2884.
34. Feise, R.J. (2002) Do multiple outcome measures require p-value adjust-ment? BMC Med. Res. Methodol., 2, 8.