HAL Id: in2p3-01317114
http://hal.in2p3.fr/in2p3-01317114
Submitted on 4 Jul 2016HAL is a multi-disciplinary open access archive for the deposit and dissemination of sci-entific research documents, whether they are pub-lished or not. The documents may come from teaching and research institutions in France or abroad, or from public or private research centers.
L’archive ouverte pluridisciplinaire HAL, est destinée au dépôt et à la diffusion de documents scientifiques de niveau recherche, publiés ou non, émanant des établissements d’enseignement et de recherche français ou étrangers, des laboratoires publics ou privés.
To cite this version:
C. Michelagnoli. The performance of AGATA: From the LNL demonstrator to the GANIL setup. 12th International Conference on Nucleus - Nucleus Collisions, Jun 2015, Catania, Italy. pp.10004, �10.1051/epjconf/201611710004�. �in2p3-01317114�
The performance of AGATA: From the
LNL demonstrator to the GANIL setup
Caterina Michelagnoli
GANIL CEA/DSM-CNRS/IN2P3, Caen, France
Abstract
The performance of the Advanced–GAmma–Tracking–Array
AGATA is demonstrated through selected examples from the differ-ent recdiffer-ent experimdiffer-ental campaigns.
1
Introduction
In order to perform nuclear structure studies in extreme conditions of neu-tron/proton asymmetry and angular momentum, in the last decade, the challenge of the realization of the gamma–ray spectroscopy dream has been taken on by two international collaborations, AGATA (Advanced–GAmma– Tracking–Array) [1] in Europe and GRETA (Gamma–Ray Energy Tracking Array) in the US [2]. The dream consists in covering the whole 4 π solid angle by germanium material and track the path of the gamma rays inside the detector medium, corresponding to maximum efficiency and “infinite” position resolution, in addition to an excellent energy resolution.
On this purpose, the digitally recorded waveforms from highly– segmented HPGe detectors are treated with Pulse–Shape–Analysis (PSA) techniques in order to extract the position of the interaction points in the detector with a 4 mm position resolution (at 1 MeV) [3,4]. These interaction points (hits) are grouped in events on the basis of the timestamp. Differ-ent gamma rays in the same evDiffer-ent and their ordered path are reconstructed via tracking algorithms. An efficiency four times larger than standard arrays
digital electronics. For the first time an almost continuous angular distribu-tion of gamma interacdistribu-tion points will be available, allowing for a “perfect” Doppler correction and new degree of sensitivity in the determination of nuclear structure observables.
This contribution focuses on the AGATA array. It run its Demonstrator phase in 2009–2010 [5] and first physics campaign with stable beams at the Legnaro National Laboratories, consisting mainly in the spectroscopy and lifetime measurements in neutron–rich nuclei produced in deep–inelastic re-actions at the PRISMA magnetic spectrometer. It then moved to GSI for the PreSpec campaign at the FRS separator and used for the first mea-surements with fast moving radioactive ion beams (beta up to 70%). It is now running its first experimental campaign at GANIL (France) coupled to the large acceptance magnetic spectrometer VAMOS [6]. Details on the AGATA project can be found in the reference paper [1]. It the following, the focus will be on particular aspects, that bring to new physics opportunities already with a sub–system of the whole array.
2
High count–rate capabilities
The use of digital electronics to preprocess the detector preamplifier signals allow to preserve a good efficiency and energy resolution even for count–rates larger than 10 kHz (typical limitation when using analogue electronics). In Fig. 1 an example of the output of the detector preamplifier on the core contact of an AGATA detector in response to a count rate of 30 kHz is shown (in red), together with the corresponding amplitudes reconstructed via the trapezoidal filter, corresponding to two different risetimes of the trapezoid (in blue and black). The proper choice of the risetime (and of the filter parameters in general), together with the baseline restoration, allow for extracting the amplitudes from the signals and avoiding pileup. A detailed study of the efficiency and resolution of an AGATA detector as a function of the count rate is reported in [7].
3
Correction for neutron damage
The operation of the germanium detectors in position–sensitive mode allows for the correction for the effects of the damage of the germanium crystalline
Figure 1: Response of the core preamplifier of an AGATA HPGe detector to an average 30 kHz count rate, during an in–beam experiment (in red). The ampli-tudes extracted from the signals when using a trapezoidal filter with two different risetimes are reported in black and blue. In the right panel, a zoom of the region indicated by the dashed rectangle is reported. The shorter risetime acts as a pile–up rejector.
structure due to the interaction of fast neutrons. Such an effect results in an incomplete charge collection causing a worsening of the energy resolution.
Since the charge loss due to neutron damage is proportional to the length of the path to the electrodes, the interaction points resulting from PSA can be used together with a modeling of charge trapping to correct for such an effect [8]. In Fig. 2 the energy spectra corresponding to the 1.3 MeV line (60Co calibration source) before and after the correction are compared. This procedure is available and used for the detectors that suffers from neutron damage and applied in the data flow (or offline processing) after the PSA, before the data are passed to the global level stage, where event building and tracking are performed.
4
Some benefits from position resolution
The position resolution of AGATA can be used for the determination of nuclear structure observables with a new degree of sensitivity, giving access to new physics opportunities. Few selected examples from the Legnaro and GANIL campaigns will be given in the following.
Figure 2: Segment spectra corresponding to the 1.3 MeV line (60Co calibration source) –see schematic representation of an AGATA detector in the inset for seg-ment labeling. The left tail consequent to inefficiency in charge collection due to neutron damage is evident in the spectra in red (no correction applied) and it is significantly reduced in the spectra in blue, obtained after correction for neutron damage (resolution for the sum of all segments from 5.9 keV to 2.9 keV after cor-rection. The data are taken during the Legnaro campaign (picture taken from [9]).
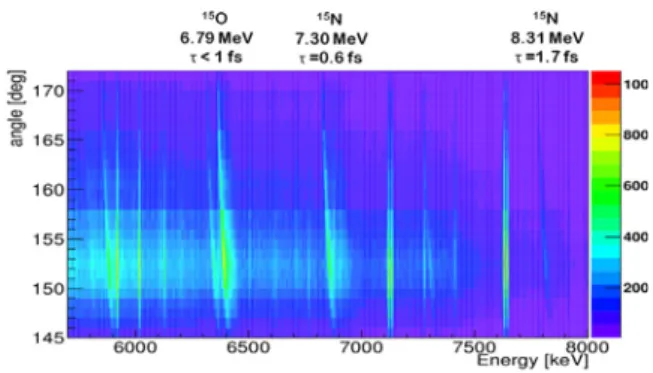
Figure 3: Tracked gamma–ray energy sorted according to the angle of the recon-structed first interaction point, from the experiment for the measurement of the lifetime of the 6.79 MeV state in15O. The “straight” lines correspond to the emis-sion at rest by a radioactive source (present while beam–on–target for monitoring of gain instabilities). The tilted broad lines correspond to gamma rays emitted from short (≈ fs) lived states. The lifetimes are obtained with Doppler Shift Attenuation technique over an almost continuous distribution of angles.
Figure 4: (taken from [11]) Experimental asymmetry as a function of the azimuthal angle of Compton scattering measured for the deexcitation of the first 2+ state in 104Pd populated by Coulomb excitation. The gamma linear polarization is obtained with a fit to the experimental data [11].
4.1 Sub–femstosecond lifetime of interest in nuclear astro-physics
The position resolution of AGATA can be used to measure nuclear level lifetimes via Doppler Shift techniques exploiting a continuous distribution of angles. It is well known that especially in the case of the Doppler Shift Attenuation Method (DSAM) the contribution of the detector response func-tion, namely the finite angular coverage of the detectors, is one of the main factors that limits the sensitivity. A new sub–femtosecond upper limit has been recently obtained for the 6.79 MeV state in15O [10]. The experiment was performed during the Demonstrator campaign in Legnaro. The reaction of14N beam on a2H target has been used to populate the state of interest. The effect of fs lifetimes can be observed by analysing the line–shape of the gamma rays, emitted by the reaction products slowing down in a gold layer, as a function of the observation angle. In Fig. 3 the energy of the recon-structed gamma rays sorted according to the angle of the first interaction point is reported with an unprecedented angular resolution of 2 degrees (see figure caption for details).
4.2 AGATA as a Compton polarimeter
The second point of interaction of a gamma ray in its attenuation path in the germanium medium can be used to determine the linear polarization of gamma rays emitted by aligned nuclear states. The asymmetry in the distribution of the Compton scattered gamma rays as a function of the azimuthal angle can be used to determine the linear polarization. A test of AGATA modules as Compton polarimeters has been performed in the Legnaro campaign [11], using the Coulomb excitation of the first excited
Figure 5: Gamma–ray spectra corresponding to the 98Zr nucleus produced in the fission of a238U beam on a9Be target at 6.6 MeV/u and identified in the magnetic spectrometer VAMOS. The comparison of performance in gamma–ray detection between the EXOGAM (lower panel, data taken from [13]) and AGATA (upper panel, data taken from December 2014 commissioning runs) arrays is shown. The FWHM at 1.2 MeV is reported.
states in 104,106Pd targets by a 12C beam. As evident from Fig. 4 (taken from [11]), with respect to standard clover detection system, this asymmetry can be analysed as a continuous function of the angle. This results in a larger analysing power, that allows for the measurement of gamma linear polarization in cases of weaker nuclear alignments or, in general, for rarer phenomena. This is the case of the study of the photon entanglement through the measurement of the relative polarization of the 511 keV gamma rays emitted by the singlet positronium [12].
4.3 Doppler correction capabilities
In Fig. 5 the advantages of using PSA and tracking techniques for the detec-tion of gamma rays with respect to tradidetec-tional arrays are shown, by using the comparison of spectra obtained in the same experimental conditions, exception made for the gamma array. The 98Zr nucleus was populated in the fission process in inverse kinematics of 238U beam on a 9Be target at 6.6 MeV/u. The same reaction has been recently used in GANIL for the study of isotopically–identified neutron–rich fission fragments at the VA-MOS++ magnetic spectrometer [13]. Here a spectrum obtained from those data is used for comparison. The gain of almost a factor of two in energy resolution is evident.
(a) AGATA at GANIL (eight triple clusters).
(b) Hit pattern from 24 crystals.
Figure 6: The AGATA array installed for the first campaign at the VAMOS spec-trometer at GANIL (spring/summer 2015). Eight triple clusters are mounted at backward angles with respect to the axis of the VAMOS spectrometer. The cor-responding hits reconstructed via PSA are also shown (in the XY plane) together with the simulation of the 1 π array foreseen for the forthcoming experimental campaign at GANIL.
5
The AGATA+VAMOS campaign at GANIL
The commissioning runs in GANIL took place in November–December 2014 and the Doppler correction capabilities and physics correlations between the gamma and magnetic spectrometers were verified and tested for differ-ent range of velocities and A and Z of the emitting nuclei [14].
Nowadays 8 triple clusters of the AGATA array are available, Fig. 6. The AGATA array positioned at backward angles with respect to the beam line coupled to the magnetic spectrometer VAMOS++ were used in the first campaign with stable beams at GANIL, in March–July 2015. The sensi-tivity of this unique combination was used to measure lifetimes and other spectroscopic properties of neutron rich nuclei produced by fission and deep– inelastic reactions in different region of the nuclear chart.
References
[1] S. Akkoyun et al., Nuclear Instruments and Methods in Physics Re-search Section A668, 26 (2012)
[3] F. Recchia et al., Nuclear Instruments and Methods in Physics Research Section A604, 555 (2009)
[4] P.A. S¨oderstrom et al., Nuclear Instruments and Methods in Physics Research Section A638, 96 (2011)
[5] A. Gadea et al., Nuclear Instruments and Methods in Physics Research Section A654(1), 88 (2011)
[6] M. Rejmund et al., Nuclear Instruments and Methods in Physics Re-search Section A646(1), 184 (2011)
[7] F. Recchia et al., LNL Annual Report 2010 p. 60 (2011)
[8] B. Bruyneel et al., The European Physical Journal A 49 (2013) [9] C. Michelagnoli, Ph.D. thesis, University of Padova (2013) [10] C. Michelagnoli et al., submitted to PRL
[11] P. Bizzeti et al., The European Physical Journal A51(4) (2015) [12] P. Bizzeti et al., private communication
[13] A. Navin et al., Physics Letters B728, 136 (2014), ISSN 0370-2693 [14] C. Michelagnoli et al., in preparation

![Figure 4: (taken from [11]) Experimental asymmetry as a function of the azimuthal angle of Compton scattering measured for the deexcitation of the first 2 + state in](https://thumb-eu.123doks.com/thumbv2/123doknet/12910752.372415/6.722.222.470.96.222/experimental-asymmetry-function-azimuthal-compton-scattering-measured-deexcitation.webp)


