HAL Id: cea-02509656
https://hal-cea.archives-ouvertes.fr/cea-02509656
Submitted on 17 Mar 2020HAL is a multi-disciplinary open access archive for the deposit and dissemination of sci-entific research documents, whether they are pub-lished or not. The documents may come from teaching and research institutions in France or abroad, or from public or private research centers.
L’archive ouverte pluridisciplinaire HAL, est destinée au dépôt et à la diffusion de documents scientifiques de niveau recherche, publiés ou non, émanant des établissements d’enseignement et de recherche français ou étrangers, des laboratoires publics ou privés.
Evaluation of the concrete shield compositions from the
2010 criticality accident alarm system benchmark
experiments at the cea valduc silene facility
T. Miller, C. Celik, M. Dunn, J. Wagner, K. Mc Mahan, N. Authier, X.
Jacquet, G. Rousseau, H. Wolff, J. Piot, et al.
To cite this version:
T. Miller, C. Celik, M. Dunn, J. Wagner, K. Mc Mahan, et al.. Evaluation of the concrete shield compositions from the 2010 criticality accident alarm system benchmark experiments at the cea valduc silene facility. ICNC 2015 - International Conference on Nuclear Criticality Safety, Sep 2015, Charlotte, United States. �cea-02509656�
EVALUATION OF THE CONCRETE SHIELD COMPOSITIONS FROM
THE 2010 CRITICALITY ACCIDENT ALARM SYSTEM BENCHMARK
EXPERIMENTS AT THE CEA VALDUC SILENE FACILITY
T. M. Miller, C. Celik, M. E. Dunn, J. C. Wagner, and K. L. McMahanOak Ridge National Laboratory P. O. Box 2008, MS-6170 Oak Ridge, Tennessee 37831, USA
millertm@ornl.gov; celikc@ornl.gov; dunnme@ornl.gov; wagnerjc@ornl.gov; and mcmahankl@ornl.gov
N. Authier, X. Jacquet, G. Rousseau, H. Wolff, J. Piot, L. Savanier, and N. Baclet Commissariat à l’Énergie Atomique et aux Énergies Alternatives —Centre de Valduc
Service de Recherche en Neutronique et Criticité 21120 Is sur Tille, France
nicolas.authier@cea.fr; xavier.jacquet@cea.fr; guillaume.rousseau@cea.fr; herve.wolff@cea.fr; jerome.piot@cea.fr; laurence.savanier@cea.fr; nathalie.baclet@cea.fr
Y.-K. Lee, V. Masse1, J.-C. Trama, E. Gagnier, F. Gabriel, and P. Blanc-Tranchant Commissariat à l’Énergie Atomique et aux Énergies Alternatives —Centre de Saclay
DEN/DANS/DM2S/SERMA 91191 Gif sur Yvette Cedex, France
yi-kang.lee@cea.fr; veronique.masse@cea.fr; jean-christophe.trama@cea.fr; emmanuel.gagnier@cea.fr; franck.gabriel@cea.fr; patrick.blanc-tranchant@cea.fr
R. Hunter
Cavendish Nuclear Limited 2100 Daresbury Park
Daresbury, Warrington, WA4 4HS, England richard.hunter@cavendishnuclear.com
S. Kim and G. M. Dulik
Lawrence Livermore National Laboratory P. O. Box 808
Livermore, California 94551, USA kim53@llnl.gov; dulik1@llnl.gov K. H. Reynolds
Y-12 National Security Complex P. O. Box 2009
Oak Ridge, Tennessee 37831, USA reynoldskh2@y12.doe.gov
ABSTRACT
In October 2010, a series of benchmark experiments were conducted at the French Commissariat à l’Énergie Atomique et aux Énergies Alternatives (CEA) Valduc SILENE facility. These experiments were a joint effort between the United States Department of Energy Nuclear Criticality Safety Program and the CEA. The purpose of these experiments was to create three benchmarks for the verification and validation
1 V. Masse is presently at CEA/DEN/DADN/GIP.
Notice: This manuscript has been authored by UT-Battelle, LLC, under Contract No. DE-AC05-00OR22725 with the U.S. Department of Energy. The United States Government retains and the publisher, by accepting the article for publication, acknowledges that the United States Government retains a non-exclusive, paid-up, irrevocable, world-wide license to publish or reproduce the published form of this manuscript, or allow others to do so, for United States Government purposes. The Department of Energy will provide public access to these results of federally sponsored research in accordance with the DOE Public Access Plan ( http://energy.gov/downloads/doe-public-access-plan).
of radiation transport codes and evaluated nuclear data used in the analysis of criticality accident alarm systems.
This series of experiments consisted of three single-pulsed experiments with the SILENE reactor. For the first experiment, the reactor was bare (unshielded), whereas in the second and third experiments, it was shielded by lead and polyethylene, respectively. The polyethylene shield of the third experiment had a cadmium liner on its internal and external surfaces, which vertically was located near the fuel region of SILENE. During each experiment, several neutron activation foils and thermoluminescent dosimeters (TLDs) were placed around the reactor. Nearly half of the foils and TLDs had additional high-density magnetite concrete, high-density barite concrete, standard concrete, and/or BoroBond shields. CEA Saclay provided all the concrete, and the US Y-12 National Security Complex provided the BoroBond. Measurement data from the experiments were published at the 2011 International Conference on Nuclear Criticality (ICNC 2011) and the 2013 Nuclear Criticality Safety Division (NCSD 2013) topical meeting. Preliminary computational results for the first experiment were presented in the ICNC 2011 paper, which showed poor agreement between the computational results and the measured values of the foils shielded by concrete. Recently the hydrogen content, boron content, and density of these concrete shields were further investigated within the constraints of the previously available data. New computational results for the first experiment are now available that show much better agreement with the measured values.
KEYWORDS CAAS, Shielding benchmark, Neutron activation, Photon dose
1. INTRODUCTION
Two previous papers [1,2] have been published concerning the criticality accident alarm systems (CAAS) benchmark experiments performed in October 2010 at the French Commissariat à l’Énergie Atomique et aux Énergies Alternatives (CEA) Valduc SILENE facility, so only a brief overview will be given here. These experiments were a joint effort between the United States Department of Energy (DOE) Nuclear Criticality Safety Program and the CEA. The purpose of these experiments was to create three benchmarks for the verification and validation of radiation transport codes and evaluated nuclear data used in the analysis of CAAS.
This series of experiments consisted of three single-pulsed experiments with the SILENE reactor. For the first experiment, the reactor was bare (unshielded), while in the second and third experiments the reactor was shielded by lead and polyethylene, respectively. The polyethylene shield of the third experiment had a cadmium liner on its internal and external surfaces, which vertically was located near the fuel region of SILENE. During each experiment, several neutron activation foils and thermoluminescent dosimeters (TLDs) were placed around the reactor. Nearly half of the foils and TLDs had additional high-density magnetite concrete, high-density barite concrete, standard concrete, and/or BoroBond shields. CEA Saclay provided all the concrete, and the US Y-12 National Security Complex provided the BoroBond. In reference 1, measurement results for the neutron activation foils and TLDs from the first experiment (pulse 1) of the SILENE CAAS benchmark experiments are presented in Table III and Table IV, respectively. In Table V of reference 1, SCALE 6.1 [3] and TRIPOLI-4® [4] simulation results are presented for the fast neutron activation products measured during this experiment. The general conclusion in that paper was that the simulation of the fast neutron activation products agreed fairly well with the experimentally measured values. The exceptions to this conclusion were the foils behind the high-density concrete shields and all the 56Fe(n,p)56Mn reactions.
Reference 2 explains why the simulation of the 56Mn activity within the iron foils in reference 1 did not compare well to the experimentally measured values. The explanation is that the iron foils were modeled
as pure iron, with naturally occurring isotopic abundances, when in fact these foils contained a 0.3 weight percent impurity of 55Mn. This impurity was another pathway to produce 56Mn via the 55Mn(n,γ)56Mn reaction that must also be modeled for simulations to produce results similar to the experimental values. After this impurity was added to the iron foil and both the 56Fe(n,p)56Mn and 55Mn(n,γ)56Mn reactions were tallied, the simulated results of the 56Mn activity behind the high-density concrete shields were improved but still did not match the experimental values very well. However, this trend was similar to the trend observed for all the activation products whose production is dominated by thermal neutrons.
The remainder of this paper presents the analysis performed to further evaluate the available data concerning the composition and density of the concrete shields used during the SILENE CAAS benchmark experiments. It is an analysis of the data provided at the time of the experiments and does not include any additional measurements after the collection of these original data. In other words, no new measurements have been performed. Presented are the best-estimate compositions and densities of the concrete shields that produce reasonable results for all neutron activation products (fast and thermal) and photon doses measured during these experiments. Computational results from four radiation transport codes, SCALE 6.2 beta 3, TRIPOLI-4®, MCNP6 [5], and COG11 [6], are presented and compared with the experimentally measured values for the first experiment (also referred to as pulse 1 or the bare/no reflector experiment).
2. DESCRIPTION OF CONCRETE SHIELDING BLOCKS AND MEASURED PROPERTIES
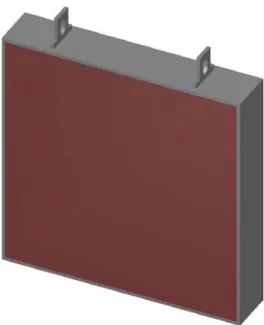
The concrete shielding blocks were provided by CEA Saclay along with the collimators and collimator stands used during the experiments. Some of the shielding blocks were configured to create the scattering box used during the experiments, whose stand was provided by CEA Valduc. Pictures of these can be seen in Figures 1–3 in reference 1. CEA Saclay provided shield blocks of four different types of concrete: standard, magnetite, barite, and colemanite. During these experiments, none of the colemanite shield blocks were used. Figure 1 in this paper is a photograph of one of the shield blocks, and Figure 2 shows a computational model of one shield block.
2.1. Analysis of Elemental Composition
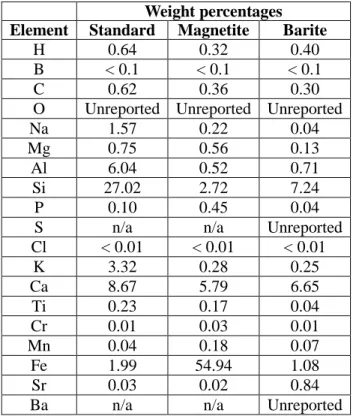
The results for the elemental composition of the concrete shield blocks used in these experiments are provided in Table I. It should be pointed out that this analysis was performed in 2007, shortly after the shield blocks were manufactured but over 3 years before the experiments were performed.
Table I. Results of analysis of concrete shield blocks elemental composition
Weight percentages Element Standard Magnetite Barite
H 0.64 0.32 0.40
B < 0.1 < 0.1 < 0.1
C 0.62 0.36 0.30
O Unreported Unreported Unreported
Na 1.57 0.22 0.04
Mg 0.75 0.56 0.13
Al 6.04 0.52 0.71
Si 27.02 2.72 7.24
P 0.10 0.45 0.04
S n/a n/a Unreported
Cl < 0.01 < 0.01 < 0.01 K 3.32 0.28 0.25 Ca 8.67 5.79 6.65 Ti 0.23 0.17 0.04 Cr 0.01 0.03 0.01 Mn 0.04 0.18 0.07 Fe 1.99 54.94 1.08 Sr 0.03 0.02 0.84
Ba n/a n/a Unreported
Missing from the results in Table I are the weight percentages for oxygen for all the concretes, and sulfur and barium for the barite concrete. The missing oxygen content is not a great concern because this element must be present, and assuming that its weight percentage makes up the balance of the material produces reasonable results for the standard and magnetite concrete.
More problematic is that the sulfur and barium composition were not reported for the barite concrete, since barite is BaSO4. A note was provided with the analysis of the barite concrete that roughly translates
from French to English as “after the analysis was complete there remained an insoluble residue likely consisting of barium sulfate (about 54%).” Barium sulfate is BaSO4, but it is not clear if the entire barite
concrete sample is 54 weight percent barium sulfate, if the remaining residue is 54 weight percent barium sulfate, or if the percentage sign is even referring to weight percentage.
Additionally, the boron and chlorine compositions were reported as less than 0.1 and 0.01 weight percent, respectively. No additional details were provided about the boron and chlorine compositions. Therefore, it is not certain whether boron and chlorine were positively detected with large uncertainties and reported as less than the given values, or if these elements were not detected at all and were stated as less than these values to fill in blanks in an agreed-upon template for the analysis report.
2.2. Analysis of Density
When the concrete shield blocks were manufactured, small samples (relative to the size of the concrete blocks) of each type of concrete were saved and used to analyze the density. The reported densities of the standard, magnetite, and barite concretes are 2.3 g/cm3, 3.9 g/cm3, and 3.25 g/cm3, respectively.
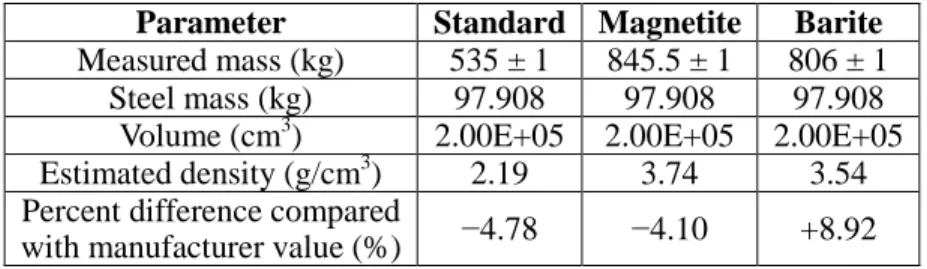
Immediately following the completion of these experiments, the masses of a single standard, magnetite, and barite concrete shield block were measured. Using the dimensions of the shield blocks to calculate the volume, these measured masses were used to estimate the density of the shield blocks. Obviously, the masses of the steel frames and lift points would have to be subtracted to correctly estimate the concrete densities. The expectation was that the density may have decreased over time as the concrete shield blocks lost water owing to the concrete drying. In Table II are the masses that were measured, the masses of the steel frames and lift points from the computational model, and the estimated densities. In the computational model, the steel frames and lift points are assumed to be S235JR with a standard density of 7.85 g/cm3.
Table II. Concrete density estimates immediately following the experiments
Parameter Standard Magnetite Barite Measured mass (kg) 535 ± 1 845.5 ± 1 806 ± 1
Steel mass (kg) 97.908 97.908 97.908 Volume (cm3) 2.00E+05 2.00E+05 2.00E+05 Estimated density (g/cm3) 2.19 3.74 3.54 Percent difference compared
with manufacturer value (%) −4.78 −4.10 +8.92
The estimated densities in Table II for the standard and magnetite concrete are less than those reported by the manufacturer, as the experimenters expected. However, the density of the barite concrete increased, which does not seem reasonable. This unexpected barite density could be due to an error when the mass was measured, poor mixing of the barite concrete (i.e., sample composition very different from the shield block composition), or an error by the manufacturer in estimating the density of the barite sample.
3. EVALUATION OF EXPERIMENTALLY MEASURED DATA
Nearly all the data in Section 2 were measured by the experimenters and provided to the evaluators to use as was deemed best. The two exceptions were the steel mass reported in Table II and therefore the density in Table II as well. This section provides details about the choices the evaluators made to arrive at the concrete compositions and densities that produce computational results that best match the measured data. 3.1. Results of the Initial Evaluation
Before the first comparison between calculations and experiments can be made, a few pieces of missing or inconsistent data from Section 2 must be addressed. The following are the initial assumptions to resolve these issues.
1) The oxygen weight percentages missing in Table I are assumed to be the balance of the material, i.e. the value needed to make the numbers sum to 100%.
2) The note about 54% barium sulfate associated with the barite concrete is assumed to refer to the barium sulfate weight percent of the entire concrete composition, so the sulfur and barium weight percentages are 7.42% and 31.77%, respectively.
3) The boron and chlorine weight percentages are assumed to be 0.1% and 0.01%, respectively. 4) The density of the concrete is assumed to be that reported by the manufacturer.
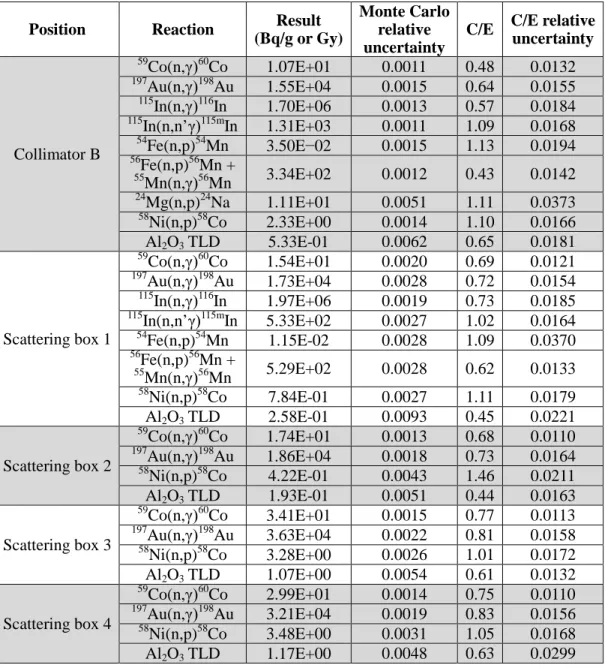
Results of MCNP6 simulations of the first experiment for the foils and TLDs inside Collimator B and the scattering box (the positions directly affected by the concrete shield blocks) are presented in Table III and compared with the measured values via computational-to-experimental ratios (C/E). These simulations apply the four assumptions listed above. The C/E relative uncertainty takes into account only the measurement uncertainty and the Monte Carlo uncertainty (i.e., no other benchmark uncertainties). ENDF/B-VII.1 [7] data are used for the MCNP transport cross sections, but IRDF-2002 [8] data are used for the neutron activation response functions and the ICRU-57 [9] air kerma factors for the photon dose response function. Remember that the measured values and their uncertainties are reported in Tables III and IV of reference 1.
Table III. Comparison of MCNP6 and experimental values based on initial assumptions
Position Reaction Result
(Bq/g or Gy)
Monte Carlo relative uncertainty
C/E C/E relative uncertainty Collimator B 59 Co(n,γ)60Co 1.07E+01 0.0011 0.48 0.0132 197 Au(n,γ)198Au 1.55E+04 0.0015 0.64 0.0155 115 In(n,γ)116In 1.70E+06 0.0013 0.57 0.0184 115 In(n,n’γ)115mIn 1.31E+03 0.0011 1.09 0.0168 54 Fe(n,p)54Mn 3.50E−02 0.0015 1.13 0.0194 56 Fe(n,p)56Mn + 55 Mn(n,γ)56Mn 3.34E+02 0.0012 0.43 0.0142 24 Mg(n,p)24Na 1.11E+01 0.0051 1.11 0.0373 58 Ni(n,p)58Co 2.33E+00 0.0014 1.10 0.0166 Al2O3 TLD 5.33E-01 0.0062 0.65 0.0181 Scattering box 1 59Co(n,γ)60 Co 1.54E+01 0.0020 0.69 0.0121 197 Au(n,γ)198Au 1.73E+04 0.0028 0.72 0.0154 115 In(n,γ)116In 1.97E+06 0.0019 0.73 0.0185 115 In(n,n’γ)115mIn 5.33E+02 0.0027 1.02 0.0164 54 Fe(n,p)54Mn 1.15E-02 0.0028 1.09 0.0370 56 Fe(n,p)56Mn + 55Mn(n,γ)56 Mn 5.29E+02 0.0028 0.62 0.0133 58 Ni(n,p)58Co 7.84E-01 0.0027 1.11 0.0179 Al2O3 TLD 2.58E-01 0.0093 0.45 0.0221 Scattering box 2 59 Co(n,γ)60Co 1.74E+01 0.0013 0.68 0.0110 197 Au(n,γ)198Au 1.86E+04 0.0018 0.73 0.0164 58 Ni(n,p)58Co 4.22E-01 0.0043 1.46 0.0211 Al2O3 TLD 1.93E-01 0.0051 0.44 0.0163 Scattering box 3 59 Co(n,γ)60Co 3.41E+01 0.0015 0.77 0.0113 197 Au(n,γ)198Au 3.63E+04 0.0022 0.81 0.0158 58 Ni(n,p)58Co 3.28E+00 0.0026 1.01 0.0172 Al2O3 TLD 1.07E+00 0.0054 0.61 0.0132 Scattering box 4 59 Co(n,γ)60Co 2.99E+01 0.0014 0.75 0.0110 197 Au(n,γ)198Au 3.21E+04 0.0019 0.83 0.0156 58 Ni(n,p)58Co 3.48E+00 0.0031 1.05 0.0168 Al2O3 TLD 1.17E+00 0.0048 0.63 0.0299
The results in Table III show that the four assumptions concerning the concrete shield block compositions perform fairly well for the fast neutron activation products, i.e., the (n,p) and (n,n’γ) reactions. However, the reaction products dominated by thermal neutrons, i.e., the (n,γ) reactions, do not agree very well with the experimental values. The comparison between the calculated and measured TLD doses does not agree very well either, but the lack of agreement is not entirely due to the concrete composition.
3.2. Additional Consideration of the Boron and Chlorine Concentrations
Since the results in Table III that have the worst C/E values are for the thermal neutron reactions and photon doses, the third assumption listed in Section 3.1 was further investigated. This is entirely because boron and chlorine are both thermal neutron absorbers, particularly boron. Concrete experts at Oak Ridge National Laboratory and CEA Saclay suggested that boron usually is not present in concrete unless it has been intentionally added via some aggregate material like colemanite or priceite. Consulting PNNL-15870 Rev. 1 [10] supported this argument. Of the 26 example concrete compositions listed in that document, boron is present only in the colemanite concrete composition. Therefore, it was decided to remove all the boron from the compositions of concrete shielding blocks.
The same conclusion could not be drawn concerning chlorine because a few of the example compositions in reference 10 do contain chlorine. It seems likely that the presence of chlorine might depend on the amount of chlorine in the water added to the concrete mix. Based on this hypothesis, it was decided to leave the chlorine in these compositions. However, the weight percent was changed from 0.01% to 0.005% ± 0.005% in accordance with the advice provided in Section 3.1 of the ICSBEP Guide to the
Expression of Uncertainties [11].
The evaluators also thought it possible that a template was used to report the results of the elemental composition analysis of each concrete. Boron would definitely have been included in this template because of the fourth CEA concrete composition not used in these experiments, colemanite (CaB3O4(OH)3·H2O). Furthermore, a lack of knowledge the composition of barite may have led to sulfur
and barium not being included in the template and therefore not being fully analyzed. The evaluators postulated that since boron was included in the template, its actual measured value was reported or “<0.1” weight percent was included to completely fill in the template when it was not detected.
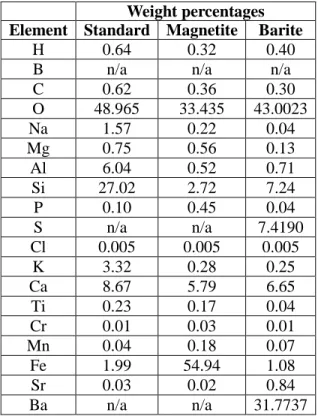
Taking into account assumptions 1, 2, and 4 in Section 3.1 and the preceding discussion regarding assumption 3 in Section 3.1, the compositions in Table I needed to be revised. The revision of Table I is shown below in Table IV.
3.3. Results of the New Evaluation using the Revised Concrete Compositions
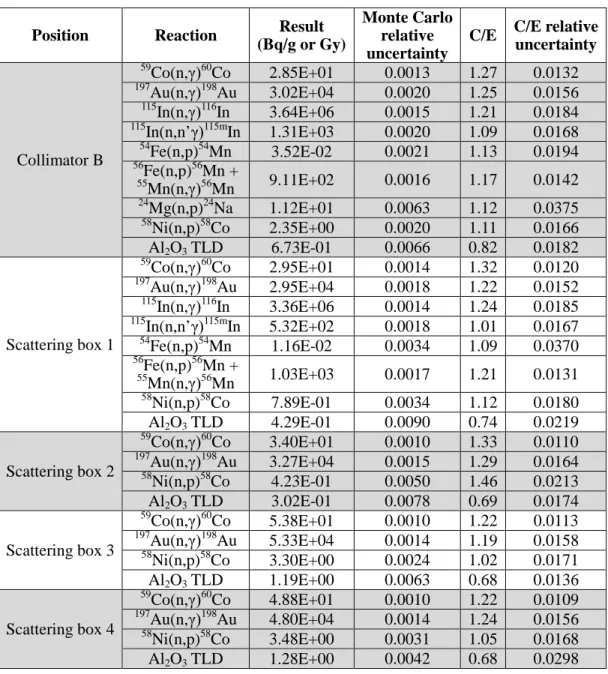
The analysis discussed in Section 3.1, the results of which are presented in Table III, was repeated using the compositions in Table IV. Otherwise, everything about this analysis remained unchanged. The new results are presented below in Table V.
The results in Table V show an improvement in the comparison of the computational and experimental values. Admittedly, these new results are not perfect, but they are much better. The comparison between Tables III and V is divided into 5 parts:
1) Thermal reactions completely shielded by concrete:
These are the cobalt, gold, indium, and manganese impurity in iron (n,γ) reactions in Collimator B and Scattering Box positons 1 and 2. On average these C/E values increased by more than 100% with the revised concrete compositions.
2) Thermal reactions with direct line of sight to SILENE:
Still the gold and cobalt (n,γ) reactions, but now in Scattering Box positions 3 and 4. The foils and TLDs in these positions have concrete behind them with respect to SILENE. The C/E values for these reactions increased by about 50%.
Table IV. Concrete shield blocks elemental composition as revised by the evaluators
Weight percentages Element Standard Magnetite Barite
H 0.64 0.32 0.40
B n/a n/a n/a
C 0.62 0.36 0.30 O 48.965 33.435 43.0023 Na 1.57 0.22 0.04 Mg 0.75 0.56 0.13 Al 6.04 0.52 0.71 Si 27.02 2.72 7.24 P 0.10 0.45 0.04 S n/a n/a 7.4190 Cl 0.005 0.005 0.005 K 3.32 0.28 0.25 Ca 8.67 5.79 6.65 Ti 0.23 0.17 0.04 Cr 0.01 0.03 0.01 Mn 0.04 0.18 0.07 Fe 1.99 54.94 1.08 Sr 0.03 0.02 0.84 Ba n/a n/a 31.7737
3) All fast neutron reactions:
This category represents all the remaining neutron activation measurements. Outside of statistical variations in the two sets of calculations, the C/E values for these reactions were unchanged.
4) TLDs completely shielded by concrete:
These are the TLDs in Collimator B and Scattering Box positons 1 and 2. On average these C/E values increased by about 50% with the revised concrete compositions.
5) TLDs with direct line of sight to SILENE:
These are the remaining TLDs in Scattering Box positions 3 and 4. The C/E values for these reactions increased by about 10%.
4. INTERCODE COMPARISON OF SIMULATION RESULTS
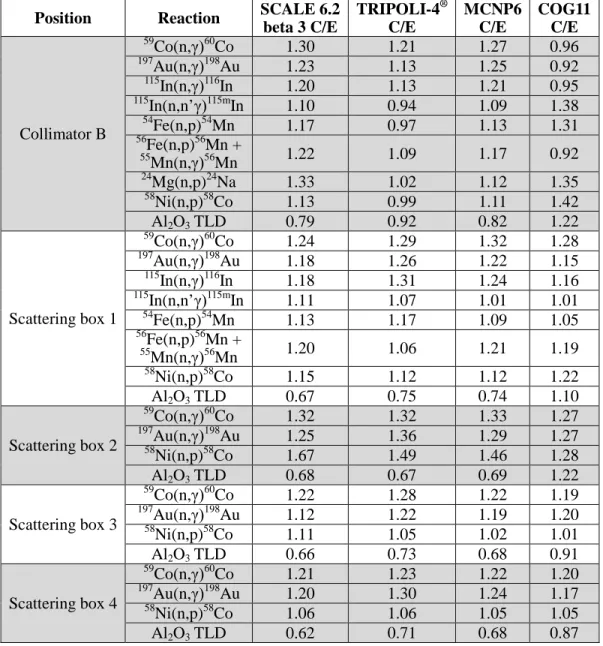
The evaluators performed simulations of the first SILENE CAAS benchmark experiment using four different radiation transport codes: SCALE 6.2 beta 3, TRIPOLI-4®, MCNP6, and COG11. These codes all use transport cross sections based on ENDF/B-VII.1, except for TRIPOLI-4 which uses cross sections primarily based on JEFF-3.1.1 [12]. The activation cross sections used as neutron response functions are a mix of ENDF/B-VII.1 (SCALE, MCNP, and COG) and IRDF-2002 (MCNP and TRIPOLI-4®). However, all simulations used IRDF-2002 for the reactions in the indium foils and the ICRU-57 air kerma factors for the photon doses. Other interesting variations are that the COG11 simulations were eigenvalue calculations with detector tallies, whereas the other codes performed fixed-source simulations. Also, the TRIPOLI-4® simulations used the concrete shield densities presented in Table II based on the measured mass of the concrete shield blocks. In Table VI is a comparison of the C/E values from all these simulations for the measurement locations most affected by the attenuation and / or backscatter of neutrons provided by the concrete shield blocks, i.e., the same locations and reactions presented in Tables III and V.
Table V. Comparison of MCNP6 and experimental values based on the revised concrete compositions
Position Reaction Result
(Bq/g or Gy)
Monte Carlo relative uncertainty
C/E C/E relative uncertainty Collimator B 59 Co(n,γ)60Co 2.85E+01 0.0013 1.27 0.0132 197 Au(n,γ)198Au 3.02E+04 0.0020 1.25 0.0156 115 In(n,γ)116In 3.64E+06 0.0015 1.21 0.0184 115 In(n,n’γ)115mIn 1.31E+03 0.0020 1.09 0.0168 54 Fe(n,p)54Mn 3.52E-02 0.0021 1.13 0.0194 56 Fe(n,p)56Mn + 55 Mn(n,γ)56Mn 9.11E+02 0.0016 1.17 0.0142 24 Mg(n,p)24Na 1.12E+01 0.0063 1.12 0.0375 58 Ni(n,p)58Co 2.35E+00 0.0020 1.11 0.0166 Al2O3 TLD 6.73E-01 0.0066 0.82 0.0182 Scattering box 1 59Co(n,γ)60 Co 2.95E+01 0.0014 1.32 0.0120 197 Au(n,γ)198Au 2.95E+04 0.0018 1.22 0.0152 115 In(n,γ)116In 3.36E+06 0.0014 1.24 0.0185 115 In(n,n’γ)115mIn 5.32E+02 0.0018 1.01 0.0167 54 Fe(n,p)54Mn 1.16E-02 0.0034 1.09 0.0370 56 Fe(n,p)56Mn + 55Mn(n,γ)56 Mn 1.03E+03 0.0017 1.21 0.0131 58 Ni(n,p)58Co 7.89E-01 0.0034 1.12 0.0180 Al2O3 TLD 4.29E-01 0.0090 0.74 0.0219 Scattering box 2 59 Co(n,γ)60Co 3.40E+01 0.0010 1.33 0.0110 197 Au(n,γ)198Au 3.27E+04 0.0015 1.29 0.0164 58 Ni(n,p)58Co 4.23E-01 0.0050 1.46 0.0213 Al2O3 TLD 3.02E-01 0.0078 0.69 0.0174 Scattering box 3 59 Co(n,γ)60Co 5.38E+01 0.0010 1.22 0.0113 197 Au(n,γ)198Au 5.33E+04 0.0014 1.19 0.0158 58 Ni(n,p)58Co 3.30E+00 0.0024 1.02 0.0171 Al2O3 TLD 1.19E+00 0.0063 0.68 0.0136 Scattering box 4 59 Co(n,γ)60Co 4.88E+01 0.0010 1.22 0.0109 197 Au(n,γ)198Au 4.80E+04 0.0014 1.24 0.0156 58 Ni(n,p)58Co 3.48E+00 0.0031 1.05 0.0168 Al2O3 TLD 1.28E+00 0.0042 0.68 0.0298
To make Table VI compact, the uncertainty values of the C/E ratios are not included in the table. These uncertainties for the MCNP results are available in Table V and are nearly all less than 2%. The results for the other transport simulations did not have uncertainties as small as those in the MCNP simulations. The SCALE C/E ratios are between 2 and 4% or less, except for all the TLDs and the Scattering Box 2 and 4 cobalt foils that are between 5 and 10%. All of the TRIPOLI-4® C/E ratios are between 2 and 4%, except for the 54Fe reaction in Scattering Box position 1 at 6.5%. Finally, the COG C/E ratios are between 3 and 7%, except for the manganese foil in Collimator B and the nickel foil in Scattering Box positon 2 with uncertainties of about 10%.
Table VI. Comparison of SCALE 6.2 beta 3, TRIPOLI-4®, MCNP6, and COG11 C/E values based on the revised concrete compositions
Position Reaction SCALE 6.2
beta 3 C/E TRIPOLI-4® C/E MCNP6 C/E COG11 C/E Collimator B 59 Co(n,γ)60Co 1.30 1.21 1.27 0.96 197 Au(n,γ)198Au 1.23 1.13 1.25 0.92 115 In(n,γ)116In 1.20 1.13 1.21 0.95 115 In(n,n’γ)115mIn 1.10 0.94 1.09 1.38 54 Fe(n,p)54Mn 1.17 0.97 1.13 1.31 56 Fe(n,p)56Mn + 55 Mn(n,γ)56Mn 1.22 1.09 1.17 0.92 24 Mg(n,p)24Na 1.33 1.02 1.12 1.35 58 Ni(n,p)58Co 1.13 0.99 1.11 1.42 Al2O3 TLD 0.79 0.92 0.82 1.22 Scattering box 1 59Co(n,γ)60 Co 1.24 1.29 1.32 1.28 197 Au(n,γ)198Au 1.18 1.26 1.22 1.15 115 In(n,γ)116In 1.18 1.31 1.24 1.16 115 In(n,n’γ)115mIn 1.11 1.07 1.01 1.01 54 Fe(n,p)54Mn 1.13 1.17 1.09 1.05 56 Fe(n,p)56Mn + 55Mn(n,γ)56 Mn 1.20 1.06 1.21 1.19 58 Ni(n,p)58Co 1.15 1.12 1.12 1.22 Al2O3 TLD 0.67 0.75 0.74 1.10 Scattering box 2 59 Co(n,γ)60Co 1.32 1.32 1.33 1.27 197 Au(n,γ)198Au 1.25 1.36 1.29 1.27 58 Ni(n,p)58Co 1.67 1.49 1.46 1.28 Al2O3 TLD 0.68 0.67 0.69 1.22 Scattering box 3 59 Co(n,γ)60Co 1.22 1.28 1.22 1.19 197 Au(n,γ)198Au 1.12 1.22 1.19 1.20 58 Ni(n,p)58Co 1.11 1.05 1.02 1.01 Al2O3 TLD 0.66 0.73 0.68 0.91 Scattering box 4 59 Co(n,γ)60Co 1.21 1.23 1.22 1.20 197 Au(n,γ)198Au 1.20 1.30 1.24 1.17 58 Ni(n,p)58Co 1.06 1.06 1.05 1.05 Al2O3 TLD 0.62 0.71 0.68 0.87 5. CONCLUSIONS
References 1 and 2 provide a more complete summary of the experiments that are discussed and analyzed in this paper. Comparisons between computational results and experiment were used to modify the composition model of the concrete shield blocks, but these modifications were constrained within the bounds of the data measured and/or provided by the experimenters. The changes made to the concrete shield block compositions between the results shown in Tables III and V had the desired impact, which was to improve the C/E values of the thermal neutron activation products and TLDs without affecting the fast neutron activation products. The resulting best-estimate composition for each type of concrete shield block is provided in Table IV.
A comparison of simulation results for four radiation transport codes (SCALE 6.2 beta 3, TRIPOLI-4®, MCNP6, and COG11) using these best-estimate compositions is presented in Table VI. In general, the
simulation results produced by the four codes compare fairly well. Two exceptions are the results within Collimator B and all the TLD results. More work is required to fully understand the differences within Collimator B, but they are partially attributed to the fact that the TRIPOLI-4® simulations used the concrete densities in Table II instead of the manufacturer densities. The differences between the TLD simulations are primarily driven by how COG attempts to account for the electromagnetic cascade of electrons and photons when electrons are not being transported. Finally, the general underprediction of the measured photon doses by the simulations is also known to be due in part to the lack of delayed fission photons modeled in the simulations. Reference 13 and preliminary simulations with COG11.1 beta 2 and with ORIGEN [3] coupled to MCNP6 show that the delayed fission photons account for 10 to 20% of the absorbed TLD dose in this type of measurement. Reference 14 also demonstrations that, with TRIPOLI-4 and DARWIN burnup codes, the delayed fission photons account for 13 to 16% of the gamma heating deposition in the calorimeter measurements for a typical material testing reactor.
Finally, the evaluation of the first SILENE CAAS benchmark experiment has been accepted for publication by the International Criticality Safety Benchmark Evaluation Project (ICSBEP) and will be published at the end of 2015. The evaluations for the second and third experiments in this series are being completed in 2015 and will be presented to the ICSBEP in 2016.
ACKNOWLEDGMENTS
The work documented in this paper was performed with support from the US Department of Energy Nuclear Criticality Safety Program. The CEA Saclay authors gratefully acknowledge EDF and AREVA for their support of TRIPOLI-4®.
REFERENCES
1. T. M. Miller, et. al., “2010 Criticality Accident Alarm System Benchmark Experiments at the CEA Valduc SILENE Facility,” International Conference on Nuclear Criticality 2011, Edinburgh, Scotland, September 19–22, 2011, on CD-ROM (2011).
2. T. M. Miller, et. al., “Analysis of Measured Data from Experiments 2 and 3 of the 2010 Criticality Accident Alarm System Benchmark at the CEA Valduc SILENE Facility,” 2013 Topical Meeting on
Nuclear Criticality Safety, Wilmington, North Carolina, September 29–October 3, 2013, on CD-ROM
(2013).
3. SCALE Development Team, SCALE: A Comprehensive Modeling and Simulation Suite for Nuclear
Safety Analysis and Design, ORNL/TM-2005/39, Version 6.1, Oak Ridge National Laboratory (June
2011).
4. TRIPOLI-4® Project Team, TRIPOLI-4® Version 4 User Guide, CEA-R-6169, Commissariat à
l’Énergie Atomique et aux Énergies Alternatives, Saclay (2008).
5. MCNP6 Development Team, MCNP6 User’s Manual, Version 1.0, LA-CP-13-00634, Rev. 0, Los Alamos National Laboratory (May 2013).
6. R. M. Buck and E. M. Lent, COG11 Manual Supplement, LLNL-SM-461824, Lawrence Livermore National Laboratory (November 8, 2010).
7. M. B. Chadwick, et. al., “ENDF/B-VII.1: Nuclear Data for Science and Technology: Cross Sections, Covariances, Fission Product Yields and Decay Data,” Nuclear Data Sheets, 112, pp. 2887–2996 (2011).
8. O. Bersillon, et. al., International Reactor Dosimetry File—2002 (IRDF–2002), STI/DOC/010/452, International Atomic Energy Agency (2006).
9. Conversion Coefficients for Use in Radiological Protection Against External Radiation, ICRU Report 57, International Commission on Radiation Units and Measurements, Bethesda, Maryland (1998). 10. R. J. McConn, et. al., Compendium of Material Composition Data for Radiation Transport Modeling,
PNNL-15870, Rev. 1, Pacific Northwest National Laboratory (March 2011).
Organization for Economic Co-operation and Development—Nuclear Energy Agency (OECD-NEA) (September 2009).
12. A. Santamarina, D. Bernard, et. al., The JEFF-3.1.1 Nuclear Data Library, JEFF Report 22, Organisation for Economic Co-operation and Development / Nuclear Energy Agency (2009).
13. H. Sono, et. al., “Evaluation of Gamma-Ray Dose Components in Criticality Accident Situations,”
Journal of Nuclear Science and Technology, 42, pp. 678–687 (2005).
14. Y. K. Lee, et. al., “A Gamma Heating Calculation Methodology for Research Reactor Application,”
5th Int. Topical Meeting on Research Reactor Fuel Management, RRFM 2001, Aachen, Germany, p.