HAL Id: hal-01020368
https://hal.inria.fr/hal-01020368
Submitted on 8 Jul 2014HAL is a multi-disciplinary open access archive for the deposit and dissemination of sci-entific research documents, whether they are pub-lished or not. The documents may come from teaching and research institutions in France or abroad, or from public or private research centers.
L’archive ouverte pluridisciplinaire HAL, est destinée au dépôt et à la diffusion de documents scientifiques de niveau recherche, publiés ou non, émanant des établissements d’enseignement et de recherche français ou étrangers, des laboratoires publics ou privés.
OFDR Distributed Temperature and Strain
Measurements with Optical Fibre Sensing Cables:
Application to Drain Pipeline Monitoring in a Nuclear
Power Plant
Laurent Maurin, Stéphane Rougeault, Véronique Dewynter-Marty, Jocelyn
Périsse, Dominique Villani, Jean-Reynald Macé, Pierre Ferdinand
To cite this version:
Laurent Maurin, Stéphane Rougeault, Véronique Dewynter-Marty, Jocelyn Périsse, Dominique Vil-lani, et al.. OFDR Distributed Temperature and Strain Measurements with Optical Fibre Sensing Cables: Application to Drain Pipeline Monitoring in a Nuclear Power Plant. EWSHM - 7th Euro-pean Workshop on Structural Health Monitoring, IFFSTTAR, Inria, Université de Nantes, Jul 2014, Nantes, France. �hal-01020368�
OFDR
DISTRIBUTED TEMPERATURE AND STRAIN MEASUREMENTS
WITH
O
PTICAL
F
IBRE
S
ENSING CABLES
:
APPLICATION TO DRAIN
PIPELINE MONITORING IN A
N
UCLEAR
P
OWER
P
LANT
Laurent Maurin1, Stéphane Rougeault1, Véronique Dewynter-Marty1, Jocelyn Périsse2,
Dominique Villani3, Jean-Reynald Macé2, Pierre Ferdinand1
1 CEA, LIST, Optical Measurement Laboratory, F-91191 Gif-sur-Yvette cedex. 2 AREVA, 1 place Jean Millier, F-92084 Paris-La-Défense cedex.
3 NNS, Centrale de Creys-Malville, BP 55, F-38510 Morestel.
laurent.maurin@cea.fr
ABSTRACT
This study deals with the testing of innovative Optical Fibre Sensing (OFS) cables deployed on ducts, with the aim to perform distributed temperature and strain measurements. Such cables contain several optical fibres devoted to be interrogated by Optical Frequency Domain Reflectometry (OFDR). The methodology has first been developed and qualified in laboratory. Then, real tests have been performed on a Nuclear Power Plant (NPP) drain system to demonstrate the industrial feasibility of such technology. To do so, two small diameter sensing cables, compatible with distributed temperature and strain measurements, have been qualified and afterwards installed along a sodium drain line at Superphénix NPP (liquid sodium coolant fast breeder reactor in current dismantling). Measurements have been performed during the preheating operation. Recorded data were post-processed according to a semi-empirical model taking into account temperature dependence and thermo-mechanical sensing cable behaviour. Optical fibre distributed temperature measurements were then successfully compared to thermocouple reference measurements, whereas optical sensing cable data were processed to provide distributed strain, then distributed curvature radius, which will enable, after numerical integration, to compute distributed displacement data. The goal is to assess the use of OFS for monitoring both temperature and mechanical strain distribution along a pipe under heat stress.
KEYWORDS: drain pipeline, nuclear power plant, optical fibre, sensing cable, OFDR
INTRODUCTION
Optical technologies are now widely used in instrumentation, in laboratory as well as in industry. Optical Fibre Sensors (OFS) are more recent applications of laser and telecom developments. Multiplexed Fibre Bragg Grating (FBG) are used in many industrial applications to monitor both strain and temperature, but their ability to provide distributed measurements is still limited. Here is studied a more recent technology of OFS based on the Rayleigh backscattering analysed in the frequency domain along the optical fibre: this new measurement technique, namely Rayleigh OFDR, is also sensitive to both temperature and strain, but it now enables high-resolution distributed measurements, thus leading to high measurement capacity along a single optical fibre.
1 SCOPE AND MOTIVATION
In a liquid metal coolant reactor, all the circuits have to be controlled in temperature to both guarantee fluid circulation (sodium is solid below 98°C) and that saturation temperature of oxide is respected. For these reasons, lots of heating cables and thermocouples (TC) are implemented in the plant to perform these basic functional requirements. Other TC sensors are also used to monitor specific areas
or circuits like pipes, vessels, sumps, where temperature fluctuations or gradients induce periodic thermo-mechanical loadings which must be avoided for durability reasons. Other issue is the pipes or lines displacements induced by thermal expansion and thermo-mechanical loadings from room temperature up to 550°C in power operation. In particular, pipe monitoring is important for safety to control their durability and to verify design criteria consistency.
Superphénix NPP is being dismantled for 10 years now, and lots of innovating operations and realistic in-field testing conditions are still possible without constraints in comparison with an operating power plant, especially in terms of durability requirements of the equipments to be installed. Such conditions were fulfilled at Superphénix NPP. New OFS cables were implemented on a sodium drain line to monitor distributed temperature, strain and displacement. Important issues like the fixation method of the sensing cables, their routing procedure along the pipe drain line and the interfaces with heating cables have been advantageously evaluated on the field. The experimental feedback and expertise acquired here will be useful for future OFS instrumentation projects in NPP.
2 LABORATORY VALIDATION TESTS – TEMPERATURE AND STRAINS MEASUREMENTS
Experiments have first started by feasibility laboratory tests in order to validate temperature, strain, and curvature radius measurements. They rely on Rayleigh-based Optical Frequency Domain Reflectometry (OFDR), which determines the distributed State Of Polarisation (SOP) all along the fibre under test (Luna™ OBR-4600 instrument). These data are then post-processed to provide the Rayleigh frequency shift along the optical fibre with typically centimetre spatial resolution [1].
This technique now enables the development and qualification of new sensors for distributed measurements with resolutions close to 1 µm/m in terms of strain, and 0.1°C in terms of temperature. However, since OFDR frequency shift Δν depends on both temperature and strain, it is necessary to proceed, at least, to additional measurements to compensate for the temperature influence. The solution proposed here uses a single optical fibre, free from stress, calibrated in temperature (§2.1). It has the main advantage to be simple and easy to deploy on-site along a pipe.
Experiments concerning the design of the two sensing cables and the procedure to attach them have also been validated thanks to several tests performed in laboratory.
2.1 Temperature measurements: the flexible loose tube solution
The solution adopted relies on a single temperature-resistant optical fibre placed into a flexible loose tube. One key point is to let the optical fibre to move freely without any friction. This is important for both transportation and installation issues (the fibre must not be broken at any time), but also for subsequent measurements: a friction strain Δεfriction equivalent to 10 µm/m has a crosstalk effect on
temperature ΔTfriction close to 1°C (the expected strains range from zero up to few hundreds of µm/m).
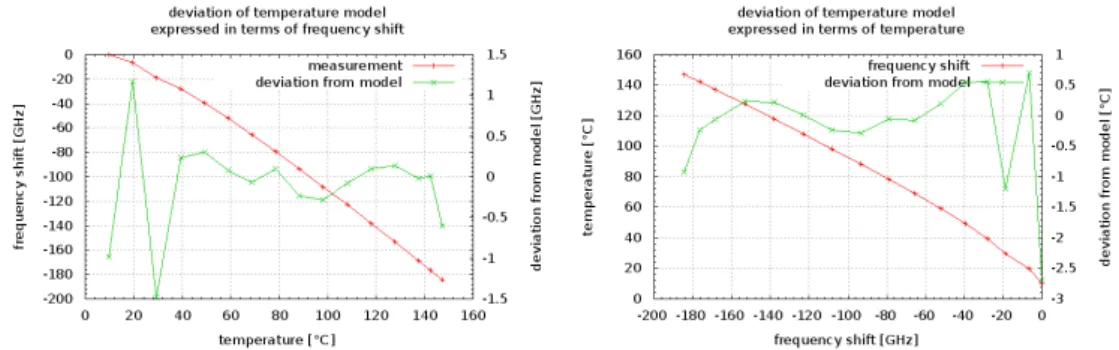
Temperature calibration results exhibit a quadratic behaviour [2], and the deviation from the model does not exceed 1°C at the highest calibration temperature. The greatest deviation appears at the lowest temperature (close to 9°C), mainly due to temperature regulation issues, but it will have no impact since the field temperature will range from room temperature up to 220°C (Figure 1).
Figure 1: Temperature calibration results – Optical fibre in loose tube, free from friction effects
EWSHM 2014 - Nantes, France
2.2 Strain and curvature radius measurements: the sensing cable
A single optical fibre glued to the pipe is sufficient for average longitudinal strains measurements, provided that temperature compensation means are available. However, additional data are required to perform displacement measurements.
The solution relies on a specific sensing cable made of three optical fibres measuring complementary strain contributions, respectively Δε1, Δε2 and Δε3. This additional information
enables curvature radius measurements according to Equation (1) [3, 4, 5].
in pipe flexural plane:
√
∆ ∆ ∆ ∆ ∆ ∆
(1)
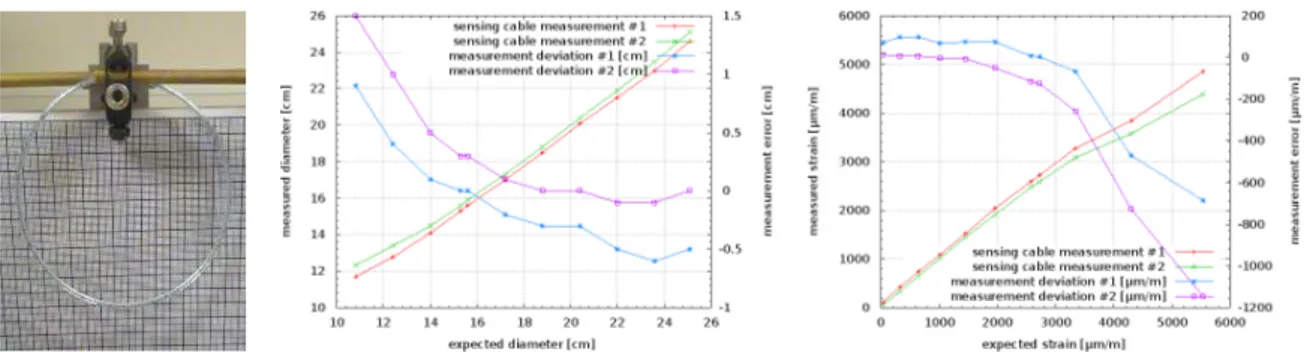
The sensitivity of this measurement mainly depends on the distance between each optical fibre, and is characterised by a sensing diameter !, and the initial curvature radius " (Figure 2).
Figure 2: Strain sensing cable manufactured by Acome™, devoted to curvature radius & strain measurements
This cable has been tested on a specific set-up designed to minimise friction effects in order to measure pure bending. In this configuration, experimental results exhibit a good correlation with expected data for strains not greater than 3000 µm/m (Figure 3).
Figure 3: Curvature radius (centre) and strain measurements (right) with experimental set-up (left)
2.3 Pipe strain and curvature radius measurements
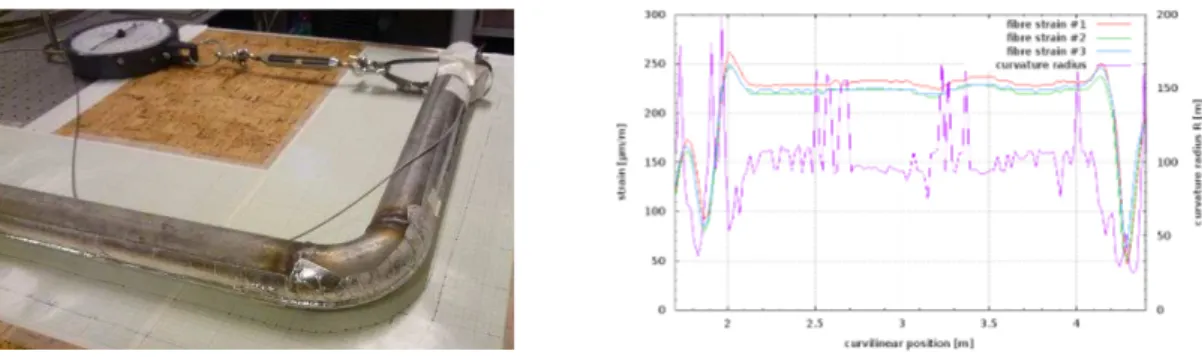
Then, strain and curvature radius measurements have been validated on a mock-up of the same drain pipe as used in Superphénix NPP (1½” stainless steel pipe). The sensing cable has been glued to the pipe to maximise strain transductions between the pipe and the cable.
Then, a pulling force has been applied on a specific part of the pipe to create constant flexural strains. The measurements on this section exhibit the expected behaviour with constant strain levels provided by each fibre of the sensing cable. Applied to curvature radius (Equation (1)), it also demonstrates the sensitivity of such measurements to strain fluctuations, especially on a straight pipe section (Figure 4).
.
Figure 4: Strain measurements along bended instrumented pipe with experimental set-up on left
2.4 Pipe temperature calibration measurements
Finally, it is also necessary to calibrate the sensing cable attached to the pipe since the thermal behaviour of the whole set defined by the sensing cable and the pipe has to be taken into account.
To do so, we have used a two-metre long fully instrumented pipe, including the optical fibre temperature sensor in its loose tube. Reference temperature measurements are provided by several TC sensors in contact with the pipe.
The frequency shift of the sensing cable ∆#$%& vs. fibre used for temperature compensation ∆#$%& then clearly exhibits a non-linear dependence in temperature. This non linearity will be taken into account into a semi-empirical model (§4.2) to get more accurate strain measurements (Figure 5).
Figure 5: Temperature calibration measurements (left) and relative sensitivity ∆#$'&(
∆#$'&) * results (right)
3 ON-SITE INSTALLATION AT SUPERPHÉNIX NUCLEAR POWER PLANT AND MEASUREMENTS
3.1 On-site optical fibre sensing line installation
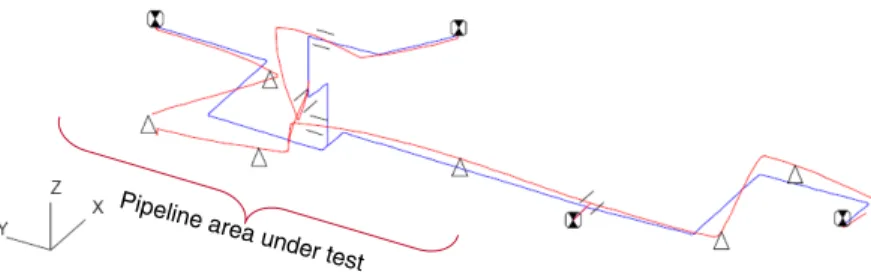
Prior to installation, the optical fibre sensing line has been delivered in a dedicated shipping box to NNS based at Superphénix NPP. Installation issues have been taken into account to facilitate the sensing cable integration on the drain line to avoid any optical fibre break (Figure 6).
Figure 6: Installation to be instrumented (tested section in blue), and the measurement cable delivered to NNS
EWSHM 2014 - Nantes, France
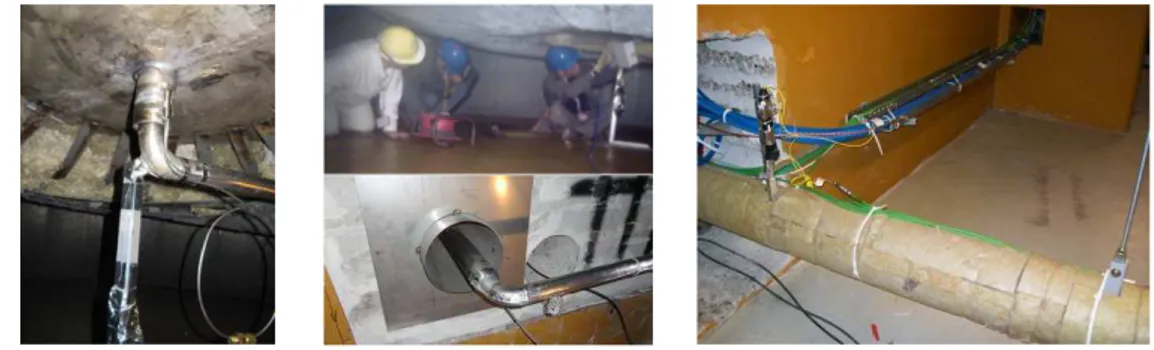
The sensing cable was deployed over 14 m between the two sodium tanks. A specific care was taken to keep the measurement cable in the flexural plane for maximum strain sensitivity (Figure 7).
Figure 7: Left: reservoir bottom – Centre: passage through the wall – Right: exit to the measurement station
For temperature reference, several thermocouples were placed at some representative areas along the pipe. An additional sensor was also installed to evaluate the pipe displacement. All the drain line pipe is heated (T>98°C) with electrical heating cables in contact with the pipe to keep sodium in liquid state (Figure 8).
Figure 8: Thermocouple temperature sensor (left) and displacement sensor (right) for reference measurements
3.2 Field measurements during the preheating operation
The measurement stations were located away from the heated pipe, behind a protective wall. The total optical fibre length to the instrument did not exceed the 70 m range to operate in standard mode.
The Luna™ instrument was controlled over a LAN network from a remote computer which sent the appropriate instructions to record the binary SOP data for post-processing purposes (Figure 9).
Figure 9: Remote measurement station to control the OBR-4600 (left) and TC measurement station (right)
A heating power station was specifically installed and tested by NNS before the measurements, enabling to tune independently each heating cable. In some sections, heating and sensing optical fibre cables overlapped.
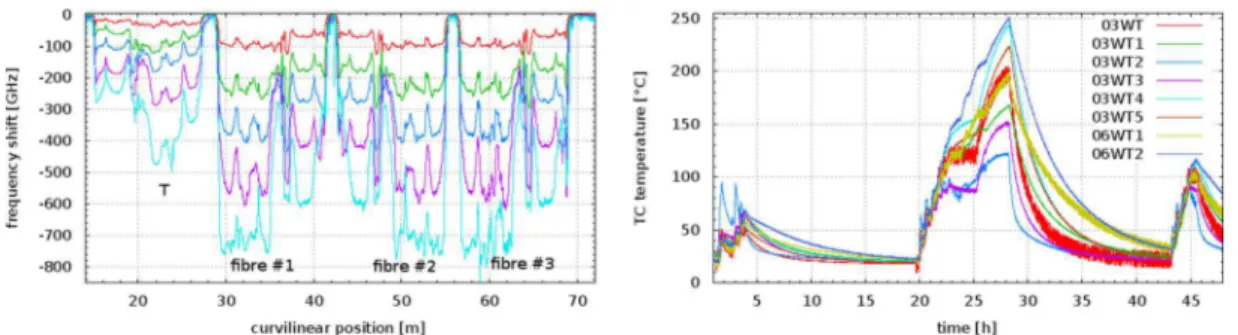
The first day was dedicated to a first heating test at max. 100°C to validate the measurement loop and for thermo-mechanical relaxations, and the two other days to higher temperature measurements (Figure 10).
thermocouple cables
Figure 10: Typical Rayleigh OFDR measurement profiles (left) and thermocouple measurements (right)
Both optical fibre and thermocouples measurements were continuously recorded during three days of experiments, without any loss of data. The resulting binary SOP data volume exceeded 67 GB.
4 DATA ANALYSIS AND RESULTS
4.1 Temperature measurements
The optical measurements were processed according to calibration to get temperature profiles, first for comparisons with thermocouple measurements. Thereby, optical fibre temperature measurements, in comparison with thermocouple reference sensors, appear to be relevant, with limited discrepancies and similar evolutions vs. time. Moreover, optical measurements outside their calibration range are still consistent with thermocouple data (Figure 11).
Figure 11: OFDR measurements compared with 03WT5 NNS thermocouple (left: 1st day, right: 2nd day)
On their side, the distributed measurements underscore, especially during the first day in limited heating power conditions, a non-homogeneous temperature profile with significant gradients. It is also interesting to notice that pipe mechanical attachments are inducing heat leaks, with up to 50°C discrepancies at their position in different heating conditions. Thermal peaks are observed when heating cables are very close to the optical fibre temperature sensor (hot spots) (Figure 12).
Figure 12: Distributed temperature measurements on first day (left) and second day (right) attachments
attachments
EWSHM 2014 - Nantes, France
4.2 Strain measurements
Pipe mechanical strain +,- ./ / can now be calculated according to next equations: f, gi and Ki are
respectively calibration functions for: i) the reference temperature fibre '0 1, ii) the mechanical strains +,- . for each fibre i in the sensing cable, iii) the sensing cable relative sensitivity to temperature ∆#$%&5∆#$%&234 for each fibre i once glued to the pipe (see Figure 5).
+,- ./ / 6 ∑ +, 8 8 - . 6 + :;1 <0 − ;> > ? × '0 1 6 − '"0 1 6 (2)
+,- . 6 A B,- ." 6 , +#$% & 6 − +#$%&0 1 6 × D E'" 6 , +#$%&0 1 6 FG (3)
'0 1 6 4 E'"0 1 6 , +#$%&0 1 6 F (4)
Rayleigh frequency shift measurements are given by HI$J&KLM for the reference temperature section, and by HI$J N&O for each optical fibre i in the sensing cable. The relevant parameters are then calculated taking into account initial reference states in terms of mechanical strains NPLQRO and temperatures JRO and JRKLM. Parameter α stands for the thermal expansion coefficient (Figure 13).
Figure 13: Distributed strain measurements during heating (left) and cooling (right) during the first day
Strain measurements are then processed to get curvature measurements according to Equation (1). The four bends are clearly identified: their curvatures remain quasi unchanged during the heating process. However, on the straight sections, curvature changes are important: this is mainly due to the measurement sensitivity to strain error measurements (see Equation (1) and Figure 4).
Figure 14: Distributed curvature measurements during the first day – initial state on left
These data can now be numerically integrated to finally provide distributed displacement measurements [3, 4, 5]. However, this work could not have been achieved in the project timeframe.
Comparison with strain calculations performed earlier to validate the design of the drain lines shows some discrepancies with the measurements (generalised strain ,̅ T ,̅U:V VYY ", W ?XW with ,̅U Z ∑ ,U ,[ [ is delivered by numerical simulations, whereas average uniaxial strain 〈,]]〉 is measured by the sensing cable along its z axis). However, distributed strain and curvature profiles are consistent with the calculated pipe displacements.
Figure 15: Distributed – amplified – displacement calculation of the pipe (blue line = pipe at rest, red line = pipe with mechanical and thermal loads)
CONCLUSION AND PERSPECTIVES
As a conclusion, a theoretical study and laboratory tests have first been completed on a pipe mock-up to qualify prototype sensing cables and estimate both strain and temperature sensitivities. On-site measurements have been performed at Superphénix NPP, in Creys-Malville (France), to validate the feasibility. Installation issues have been taken into account, and cables deployed and connected to the remote OFDR sensing system controlled for continuous measurements during several days.
Temperature measurements have first been carried out, and later on, compared with data from thermocouples located at several points all along the pipe, demonstrating the essential contribution of this technique to provide relevant and distributed information in terms of temperature sensing. In the same time, a specific optical sensing cable manufactured for this purpose, enabled distributed strain measurements along the pipe during the sodium drain operation A theoretical model, based on the strain measurements provided by three optical fibres, compensated from temperature crosstalk effects, has been applied to these measurements. It demonstrates the relevance of such measurements, leading first to some consistent strain measurements, and therefore, to distributed curvature radius measurements along the pipe, and finally to subsequent distributed displacements.
ACKNOWLEDGEMENTS
This project was made possible with the support and interest of EDF/CIDEN in charge of the Superphénix NPP dismantling. Authors would like to thank O. Cunibil and P. Battini from NNS for their support and contribution during the on-site experimentation phase.
REFERENCES
[1] Froggatt, M. & Moore, J. High-Spatial-Resolution Distributed Strain Measurement in Optical Fiber with Rayleigh Scatter. Appl. Opt. 37, 1735–1740 (1998).
[2] Flockhart, G. M. H. et al. Departure from linearity of fibre Bragg grating temperature coefficients. in
Optical Fiber Sensors Conference Technical Digest, 2002. OFS 2002, 15th 75–78 (IEEE, 2002). [3] Magne, S. & Ferdinand, P. Système de mesure distribuée des courbures d’une structure. Patent of
invention FR 2867 561 B1 & US 2008/0204706 (2004).
[4] Dewynter, V. et al. Underground tunnelling monitoring based on sensitive optical fibre cable and Brillouin reflectometry. in 3rd Int. Conf. on Structural Health Monitoring of Intelligent Infrastructure digest (2007). [5] Dewynter, V. et al. Tunnel Structural Health Monitoring with Brillouin Optical Fiber Distributed Sensing.
in 5th European Workshop on Structural-Health-Monitoring digest (2010). Pipeline area u
nder test
EWSHM 2014 - Nantes, France