HAL Id: hal-00779675
https://hal-mines-paristech.archives-ouvertes.fr/hal-00779675
Submitted on 22 Jan 2013HAL is a multi-disciplinary open access
archive for the deposit and dissemination of sci-entific research documents, whether they are pub-lished or not. The documents may come from teaching and research institutions in France or abroad, or from public or private research centers.
L’archive ouverte pluridisciplinaire HAL, est destinée au dépôt et à la diffusion de documents scientifiques de niveau recherche, publiés ou non, émanant des établissements d’enseignement et de recherche français ou étrangers, des laboratoires publics ou privés.
On the applicability of the Heliosat-2 method to assess
surface solar irradiance in the Intertropical Convergence
Zone, French Guiana
Isabelle Marie-Joseph, Laurent Linguet, Marie-Line Gobinddass, Lucien Wald
To cite this version:
Isabelle Marie-Joseph, Laurent Linguet, Marie-Line Gobinddass, Lucien Wald. On the applicability of the Heliosat-2 method to assess surface solar irradiance in the Intertropical Convergence Zone, French Guiana. International Journal of Remote Sensing, Taylor & Francis, 2013, 34 (8), pp.3012-3027. �10.1080/01431161.2012.756598�. �hal-00779675�
1
On the applicability of the Heliosat-2 method to assess surface
solar irradiance in the Intertropical Convergence Zone,
French Guiana
Running title: The Heliosat-2 method applied to French Guiana
Isabelle MARIE-JOSEPH (1), Laurent LINGUET (1), Marie-Line GOBINDDASS (2), Lucien WALD (3)
(1) Université des Antilles et de la Guyane - UMR Espace-Dev, BP 792, 97337 Cayenne Cedex, France
(2) IRD - UMR Espace-Dev, 97323 Cayenne
(3) MINES ParisTech, CEP - Centre énergétique et procédés, 06904 Sophia Antipolis Cedex, France
Measurements of daily means of surface solar irradiance made at four ground stations in French Guiana are compared to estimates from the HelioClim-3 database produced by the Heliosat-2 method applied to Meteosat satellite images. The bias ranges from 12 W/m² (6% of the mean of measurements) to 23 W/m² (12%) depending on the stations. The root mean square difference ranges between 23 W/m² (11%) and 35 W/m² (18%). The correlation coefficient is close to 0.9. Better results are observed during the rainy season than during the dry season. Uncertainties are mainly due to the presence of clouds, large viewing angles of the Meteosat satellite, and limitations of the atmospheric transmittance model under the tropical atmospheric conditions. It is concluded that using Heliosat-2 method provides new knowledge about solar radiation in French Guiana.
1. Introduction
Knowledge of global solar incident radiation on the Earth’s surface and its geographical distribution is of prime importance for numerous solar-based applications. Climate science requires reliable and sufficiently detailed data to understand the radiative forcing of climate change. To exploit solar radiation for use in urban buildings and
2 energy systems for heating and electrical power generation, high temporal and spatial resolution data for mid- and long-term energy planning are needed. Hourly and daily values of solar radiation measurements, which are always necessary for these applications, entail unacceptably high costs if provided by a high-density ground-based radiometric network. Satellite sensors provide an alternative to the sparse coverage of radiometric networks, since they can produce data over large regions on a high spatial resolution grid. Meteorological geostationary satellites such as Meteosat are widely used: they offer synoptic and accurate views of the cloud fields, which are the major causes of changes in solar radiation available at the surface.
Various algorithms and models have been developed for estimating the surface solar irradiance (SSI) from geostationary satellite images (Cano et al. 1986; Diabaté et
al. 1988; Martins et al. 2007; Möser and Raschke 1983, 1984; Perez et al. 1997, 2002;
Raschke et al. 1987; Tarpley 1979). Among those models, several studies have confirmed the reliability of the Heliosat-2 model for retrieving the SSI from Meteosat satellite images (Hammer et al. 2003). SSI estimated by means of satellite images needs to be characterized through comparison with surface data in order to ensure the reliability and precision of the retrieved SSI data over each region of interest. Furthermore, quality assessment of the retrieved data is necessary, since it allows corrections or improvements of the method resulting in the production of high-quality solar data sets (Dagestad 2004; Dürr and Zelenka 2009; Espinar et al. 2009).
Several studies have been conducted to evaluate the uncertainty of SSI derived from the Heliosat-2 method applied to Meteosat images. Several authors found the quality of the retrieved SSI satisfactory for Europe, including Madeira Island (Aculinin 2008; Blanc et al. 2011; Lefèvre et al. 2007; Rigollier et al. 2004; Vazquez et al. 2009). Similar conclusions were reached for the Northern African desert climate (Abdel Wahab et al. 2009; Blanc et al. 2011) and for arid and semi-arid areas of Iran (Moradi et
al. 2009) and Iraq (Al-Jumaily et al. 2010). Dependency of the performance of the
method on the local climate was found in Africa by Lefèvre et al. (2007) analysing data from 35 stations. This was confirmed by Dountio et al. (2010) with fairly poor performances observed for Cameroon; on the contrary, good performances were observed by Wald et al. (2011) for Mozambique and Blanc et al. (2011) for Mozambique and Zimbabwe.
3 Although many studies have been carried out to evaluate Heliosat-2 estimates, there are still several specific climate areas covered by the Meteosat satellite which have not been evaluated. The present work focuses on the northeastern region of Amazonia, an area where the climate is influenced by the Intertropical Convergence Zone (ITCZ). The ITCZ appears in satellite images as a band of clouds and its presence is related to rainfall. Change with time in the location of the ITCZ for a given area results in the rainy and dry season. The aim of this article is to evaluate the Heliosat-2 method by using ground measurements performed at four stations in French Guiana.
2. Overview of the climate in French Guiana
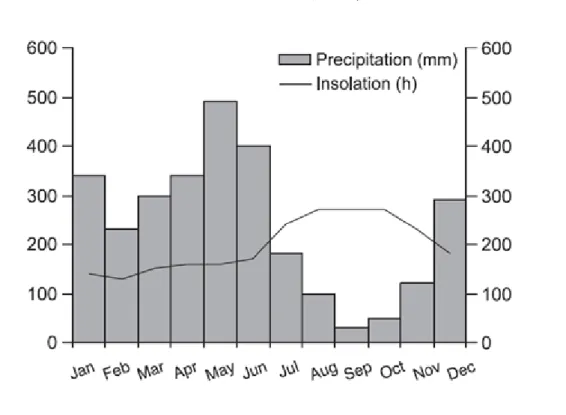
French Guiana is situated between 2° N and 6° N on the Northeast coast of South America. It is characterized by a subequatorial climate with a mean annual rainfall ranging from 2500 mm to 3000 mm occurring in a bimodal pattern (Marchand et al. 2004) (Figure 1). The amount of rainfall is governed by the movements of the ITCZ. The ITCZ is characterized by rapid ascent of hot air associated to the development of large and homogeneous cumulonimbus clouds. The ITCZ is the location of convergence of the northeast and southeast trade winds. The convergence of these wind systems enhances the development of convective rain clouds and vigorous thunderstorms over large areas.
The ITCZ overpasses French Guiana twice a year delineating a seasonal cycle with four unequal periods (Bovolo et al. 2011). From July to November, the ITCZ lies north (10° N) of French Guiana, which corresponds to the dry season. During this season, the sky is mostly clear with frequent cloudy periods. Clouds are most often cirrus, stratocumulus and altocumulus (Vasquez, 2009). During the night and early morning, the sky is cloudy, overcast with multiple layers of altostratus and stratocumulus clouds. These layers are then split to form small cumulus clouds during the afternoon offering fragmented cloud cover. Weak precipitations may occur.
While moving southwards the ITCZ overpasses French Guiana during the months of December to January. This is the short rainy season (Figure 1). During the period of February to March, the ITCZ reaches its southernmost position between 10° S and 20° S; precipitation levels decrease. Then, the ITCZ slowly moves northwards and overpasses again French Guiana with episodes of strong rains. This major rainy season extends from late March to early July and peaks during May (Figure 1).
4 Annual variations of the movements of the ITCZ do exist; onset and cessation dates of each season vary from year-to-year.
3. Ground and satellite data
In situ measurements exploited for the purposes of this study were provided by four weather stations (Table 1) of the French national weather service Météo-France. These stations are equipped with pyranometers CM6B and CMP11 by Kipp & Zonen, The Netherlands. The CM6B is a first class pyranometer and the CMP11 fulfils the accuracy requirements of a secondary standard pyranometer defined in WMO (2008), which are specified to be 3%. Pyranometers are sent to the Météo-France Centre every 2 years for calibration and are replaced by newly-calibrated pyranometers. Météo-France offers access to hourly and daily means of global irradiance on the horizontal plane. Such measurements were used by Marie-Joseph (2003) in her PhD thesis on electricity production. Here, data were collected for the period of 2004-2010.
The Rochambeau station is located 13 km from the Atlantic Ocean, in the town of Matoury. The Saint-George, Saint-Laurent and Maripasoula stations are located between 30 km and 230 km from the coast in the interior of the country, in the towns bearing the same names (Figure 2). The Ile Royale station has not been retained in this study. It is on a 0.6 km² island situated 7 km offshore and is much smaller than the corresponding Meteosat pixel whose size is approximately 10 km. Mixture of ocean and land with local effects is observed by Meteosat and cannot be a representative of the typical performance of the Heliosat-2 method in French Guiana.
SSI estimations were obtained by processing Meteosat satellite images by means of the Heliosat-2 method presented hereafter. The estimated SSI values were stored in the HelioClim databases. These databases are discussed in Blanc et al (2011). The HelioClim-1 (HC-1) database contains daily means of SSI, covering the period of 1985-2005, which were calculated using images of reduced quality, known as B2 images, taken by the Meteosat first-generation sensor (Lefèvre et al. 2007). Blanc et al. (2011) consider that HC-1 has an effective pixel of 30 km in size in the first approximation. They studied the effect of the low number of images usable per day for a given pixel; this number decreases as the latitude increases, and so does the quality of the imagery as a whole. However, the limited number of instantaneous satellite observations within a day has an effect which cannot be predicted easily as demonstrated by these authors.
5 The HC-1 database is part of the GEOSS Core Data Set since 2011. The HelioClim-3 (HC-3) data are constructed using images taken by the Meteosat Second Generation sensors. Each image is processed using the Heliosat-2 method to provide SSI values at 15 min intervals, with a spatial resolution at nadir of 3 km, starting from 2004. The HC-3 database is updated daily. Daily means of SSI are calculated based on all the images available for the day and pixel in question.
The SoDa Service (www.soda-is.com) provides easy access to the HelioClim databases containing SSI values for Europe, Africa, and the Atlantic Ocean (Gschwind et al. 2006).
Only HC-3 data is dealt here. It would have been possible to perform a comparison between HC-1 data and ground measurements but is not done in the present article. We focus on the performances of the Heliosat-2 method, and we feel that HC-1 data are not fully representative because of the use of B2 images as inputs. Compared to original Meteosat images, B2 images have a reduced spatial quality: 1 pixel of 5 km in size out of 6 pixels with subsequent spatial interpolation and reduced temporal quality, i.e. only one image for each 3-h interval (Blanc et al. 2011).
4. The Heliosat-2 Method
The Heliosat-2 method is based on the principle that a difference in the signal received by the sensor is due to a change in the apparent albedo, which is caused by a modification of the cloudiness. A cloud index, n, is then formulated, which is correlated to the SSI using a statistical regression. This principle of statistical regression was adopted by the Heliosat-1 method (Cano et al. 1986; Diabaté et al. 1988; Moussu et al. 1989) which uses visible spectrum images from the Meteosat first-generation satellite. The model was improved by setting up an automatic calibration procedure that transforms digital counts into radiance (Lefèvre et al. 2000; Rigollier et al. 2002), making it possible to introduce an explicit formulation of the different albedos required by the method, thus contributing to the robustness and operational capability of the model, now known as Heliosat-2 (Rigollier et al. 2004). The cloud index, , can therefore be written as follows :
6 is the apparent albedo observed by the satellite at instant t for the pixel (i, j). is obtained by taking the minimum of the apparent albedo in a time series of images. is the albedo of the brightest clouds. Based on the cloud index, it is possible to calculate the following clear-sky index:
(2)
is also defined as the ratio between the SSI and the SSI that would be observed if the sky were clear , which leads to:
(3) is estimated by the ESRA clear-sky model (Rigollier et al. 2000) corrected by Geiger et al. (2002). The inputs to this model are the solar zenithal angle, the elevation of the site and the Linke turbidity factor for a relative air mass 2, TL. The Linke turbidity factor TL is a very convenient approximation to model the atmospheric absorption and scattering of the solar radiation under clear skies. It describes the optical thickness of the atmosphere due to both the absorption by the water vapour and the absorption and scattering by the aerosols relative to a dry and clean atmosphere. Remund et al. (2003) constructed a series of 12 maps, one per month, covering the world by cells of 5’ of arc angle in size, i.e. approximately 10 km at mid-latitude. There is one value per month; daily values are obtained by interpolation in time. As these are typical values of TL for a month, there is no change in clear-sky SSI every year: the hourly values for a given day are the same whatever the year. This is one of the reasons for discrepancies between the actual values of SSI and those from Heliosat-2. TL may vary greatly from 1 hour to another, or one day to another. It is often set to 3.5 in Europe as an average but large variations may be observed. According to graphs in Rigollier et al. (2000), a change of 1 in TL leads to a relative change of approximately 10 – 15% in clear-sky SSI and thus in SSI (Eq. 3). Rigollier et al. (2004) found that the bias between measured SSI and Heliosat-2-derived SSI is sensitive to the selected values of TL. Larger discrepancies are found when the sun is low above the horizon; the influence of TL is not limited to clear-sky cases.
Using Eq. 2, the clear-sky index Kc is computed for every slot of 15-min acquired by the Meteosat satellite. To cope with the different time systems used by Meteosat (UT: Universal Time) and Météo-France (TST: True Solar Time), as well as
7 with missing slots, the clear-sky index Kc known in UT system is interpolated every minute and then projected into the TST time system. The interpolation technique is a linear model considering that Kc is known for the middle of each 15-min interval. The ESRA model works in TST system and is ran for each minute of the day to yield . Then, the 1-min SSI is computed by Eq. 3. Daily means of SSI are calculated by summing these 1-min values.
5. Results and discussion
We performed a comparison between daily means of SSI estimated from HC-3 and qualified ground-based measurements. We followed the ISO standard (1995) by computing the deviations: subtracting measurements for each day from HC-3 estimations, and summarizing these deviations by the bias, the root mean square difference (RMSD), and the correlation coefficient r. In addition to SSI, we also study the clearness index: KT which is the ratio of the measured SSI to the irradiance impinging a horizontal surface at the top of the atmosphere. For clear skies, KT is close to 0.8, and is close to 0 for overcast skies. This index has the advantages of removing most of the effects due to Sun’s position and indicating the type of sky. As for SSI, we computed the following deviations: KT from HC-3 minus KT from measurements, and we summarized these deviations by the bias, the RMSD, and the correlation coefficient.
The two time-series to be compared are different in nature: one is made of pinpointed time-integrated measurements, whereas the other is made of space-averaged instantaneous assessments. Accordingly, a discrepancy is expected because of the natural variability of SSI in space. Zelenka et al. (1999) found a standard deviation of 10–15% within a pixel relative to the hourly mean of SSI. Although it is difficult to predict because spatial variability is not a random variable and depends on each location and time because of the spatial and temporal properties of the cloudiness, we can expect a discrepancy of several percent relative to the daily mean of SSI and a few percent relative to the monthly mean.
5.1 Monthly mean of SSI
Table 2 reports the bias and RMSD observed for monthly means of SSI for the two stations with records spanning more than 3 years. The bias is quite large and is approximately 10% of the mean SSI. The results found by Blanc et al. (2011) for other
8 stations in Europe and Africa are also reported in Table 2. It can be seen that the bias and the RMSD observed for French Guiana sites are slightly greater than that for the other stations, and very similar to those of the stations Bulawayo and Inhambane in southern Africa (Zimbabwe and Mozambique, respectively).
As previously reported by Lefèvre et al. (2007), we note that the bias differs from 1 year to another. For example, it ranges from 13 W/m² to 23 W/m² for Rochambeau. Explanation may be found in the relation between the magnitude of the bias and the position of the ITCZ. The bias is close to 0 during the months of January and May. During these months, the ITCZ is active over French Guiana with rain at its maximum, usually in May (Figure 1). The sky is overcast with thick cloud decks. The bias is positive and maximum in magnitude in July, i.e. at the beginning of the dry season when the ITCZ is leaving Guiana and drifting northwards. Two other peaks in magnitude in bias are also observed in April-May and November-December, which correspond to the presence of the ITCZ respectively north of Guiana drifting southwards and south of Guiana drifting northwards, respectively. During these periods, clouds are broken with intermittent rainfall, which is discussed in section 2. Positions of the ITCZ for a given month as well as the intensity of the precipitations vary every month; this may induce changes in the annual bias.
5.2. Quality of HC-3 daily means of SSI for each station
Figure 3 exhibits the scatter plots between measurements and estimates for daily means of the SSI for each station. The dotted line with a slope of one represents the ideal case, in which HC-3 estimations would be identical to the measured data. The full line represents the least-square fitting line whose parameters are written on the graph. The points lie along the fitted line, which denotes a fairly small scatter of the deviations. r is large, between 0.91 and 0.93. The day-to-day variations are well represented by the HC-3 data for all sites. This is confirmed by the large r for KT around 0.92, which means that the day-to-day variations in type of sky are well reproduced. The position of the fitted lines above the dotted lines indicates that the Heliosat-2 method tends to overestimates the SSI for all the stations. One reason may be that the Linke turbidity factor values inputted to the ESRA model are underestimated, which leads to an overestimation of the SSI under clear-sky and consequently an overestimation of the SSI (Eq. 3). Because French Guiana is close to the Equator, a low daily mean of SSI
9 cannot result from low elevation of the Sun above the horizon and is solely due to large extinction of the radiation by the atmosphere.
Table 3 reports the bias, RMSD and r for SSI. The mean bias is 10% of the mean measured SSI. It changes with the year and the station, as already observed for monthly values. The RMSD is more stable and is approximately 16% of the mean measured SSI.
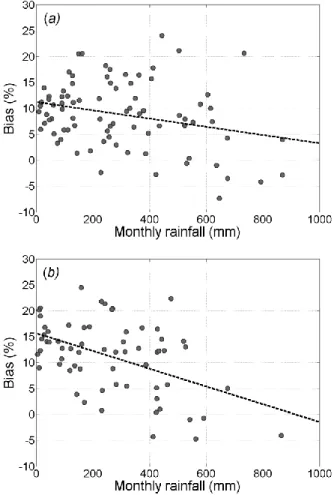
In Table 3, we observe a synchronous trend in bias and RMSD, which suggests the existence of one or several common explanatory factors for all sites. Taking into account the fact that several authors have indicated greater accuracy for the Heliosat-2 method in dry climates (Moradi et al. 2009; Rigollier et al. 2004), we selected the rainfall as a meteorological factor representative of the aridity of a site. We compute the monthly relative bias of a site as the average deviation for a given month in a given year divided by the mean SSI observed for this site for the whole period studied here (Table 1). Hence, relative biases can be compared with each other. Figure 4 exhibits the monthly relative bias as a function of the monthly rainfall for Rochambeau and Saint-Georges. As a whole, the bias is maximum for low rainfall. Both graphs suggest that the bias decreases when the rainfall increases. Unsurprisingly, this is in agreement with the findings about monthly means of SSI in section 5.1. However, the correlation between the bias and rainfall is weak, which means that other factors have a noticeable influence. In the cases treated by the above-mentioned authors, dry climates meant frequent occurrence of clear skies, i.e. spatially constant conditions. It may be deduced that the absence of cloud cover or its fragmentation is important; this will be investigated later in this article.
5.3. Quality of HC-3 daily means of SSI for each season
Beside the sensitivity of the Heliosat-2 method to the monthly rainfall, we have evaluated the accuracy of the method for the rainy and dry seasons. Table 3 reports the bias, RMSD, and correlation coefficient for SSI for each season. Results are similar with clearness index and are not shown here. Figure 5 exhibits scatter plots where the dotted line is the 1:1 line; all stations are merged. In rainy season (Figure 5(a)) the dots are well scattered in the range [0, 300] W/m². They lie along the 1:1 line, and r is 0.92. There is an overestimation for large SSI, and an underestimation for low SSI; this results in overall low bias of 12 W/m². This season comprises days with very different
10 characteristics—clear skies, partly cloudy skies and cloudy skies. The greatest relative bias and RMSD are found at the Saint-Georges station (8% and 18%) and the lowest values at the Maripasoula station (3% and 10%). For each site, the relative bias and RMSD observed during the rainy season are slightly less than the bias for the year. Actually, as shown in Figure 5, there are positive and negative deviations during the rainy season, which compensate each other, yielding a small overall bias.
As for the dry season, Figure 5(b) shows dots that are concentrated in the upper part of the range of SSI, which denotes a high proportion of clear skies. r is 0.86 and is less than during the rainy season. The large presence of dots above the dotted line indicates that the Heliosat-2 method overestimates the SSI during the dry season. Table 3 shows that the relative RMSD values are fairly identical regardless of the season. On the contrary, the bias during the dry season is twice greater than the bias during the rainy season: 13% versus 7% as an average. This holds for each site.
This large difference in bias between the rainy and dry seasons may be related to the underestimation of the Linke turbidity factor TL discussed earlier in this article. It is difficult to assess whether this underestimation affects TL for all months or only for the dry season. During this season, TL reaches its minimum and ranges between 3.2 and 3.4 from June to September. If TL is especially underestimated for this season, the clear-sky SSI is especially overestimated and so is the SSI for this season.
Other reasons may be related to type of clouds and aerosols. Negative deviations are associated with heavy rainfalls that occur when the ITCZ is present over French Guiana. These heavy rains are caused by convective clouds (cumulonimbus) characteristic of the ITCZ. In dry season, convective clouds carrying rains are scarce, and negative bias values are practically absent. So, the absence of negative bias values contributes significantly to increase the bias during the dry season. Qin et al. (2006) found similar seasonal variations in bias linked to the ICTZ’s seasonal movements.
The influence of the aerosols was also investigated. French Guiana is subjected to aerosol influence from Saharan sources carried by the regular trade winds (Goudie and Middleton 2001). During the rainy season, the aerosol plume coming from North Africa is transported by the northeast trade winds to the northeast coast of South America and the Amazon basin, whereas during the dry season, the predominant wind from the southeast pushes this plume northwards to the Caribbean Sea (Mélieres et al. 2003). Aerosol concentrations have been measured since 2002 at the Regional
11 Atmospheric Observatory located 11 km from the Rochambeau station. Measurements show periodic aerosol concentration peaks (<180 g.cm-3) during the rainy season. These concentration peaks are mainly due to Saharan dusts and occur during days with low or no rainfall. As a whole, the deviation is positive for aerosol concentration greater than 80 g.cm-3 and has a tendency to increase with the concentration. However, the correlation is weak and there is no positive or negative tendency for the bias when the concentration decreases. The positive deviations, i.e. overestimation, encountered for days with high concentration compensate the negative deviations found for the rainy days of the rainy season, contributing to a low overall bias for this season. The absence of Saharan dust resulting in lower aerosol concentrations (<40 g.cm-3) during the dry season does not yield a decrease in the magnitude of the bias. This is another possible reason for the seasonal difference in bias.
5.4. Quality of HC-3 daily means of clearness index
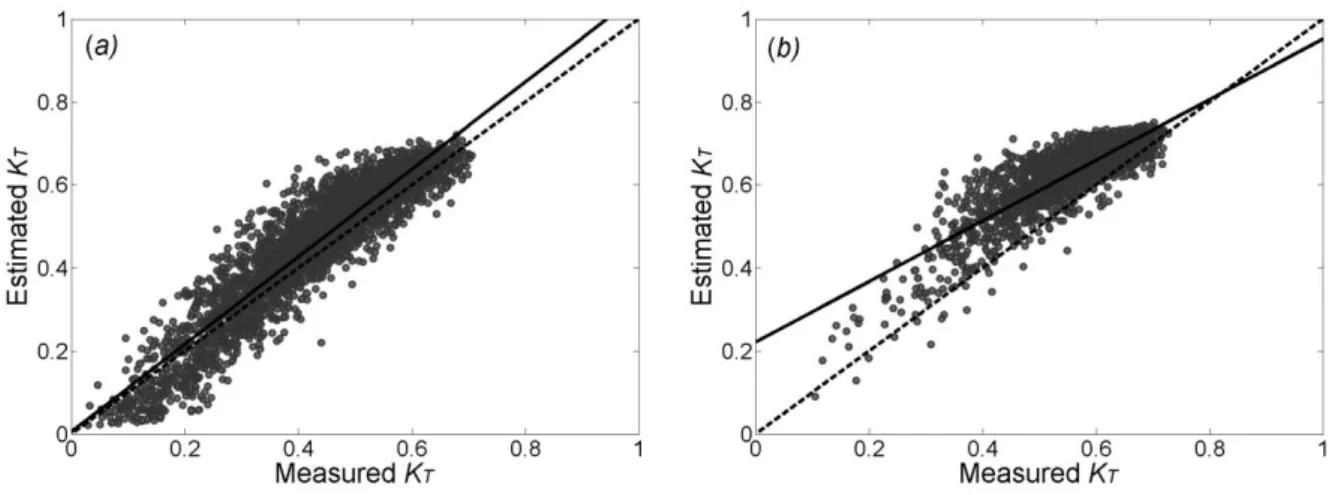
The results of this study revealed the sensitivity of the Heliosat-2 method to seasonal phenomena. To better study the causes behind the variation of HC-3 data, we focus now on the clearness index KT. Figure 6 exhibits scatter plots of KT for each season; all stations are merged. This figure is similar to Figure 5; it offers a view of the performances in terms of type of sky instead of SSI.
As said earlier, the rainy season comprises a large variety of types of sky; the dots in Figure 6(a) cover a large range of values [0, 0.7]. The Heliosat-2 method reproduces well the clearness index: the dots lie along the line 1:1, the scattering is weak, and r is 0.92. One may note the underestimation by Heliosat-2 for very thick clouds (KT < 0.2). This corresponds to the underestimation of the low SSI values (figure 5(a)). As already mentioned, low daily means of SSI are solely due to large extinction of the radiation by the atmosphere.
The dry season (figure 6(b)) exhibits a smaller range of values: [0.2, 0.8] because of the increasing occurrence of clear days. Actually, for any site, measurements show that chance for KT to be greater than 0.35 is more than 95% in any month of this season. The frequency of KT greater than 0.7 is much larger than during the rainy season. As for SSI, there is an overestimation by the Heliosat-2 method. Not taking into account the range of KT less than 0.4 because there are too few points, the
12 overestimation is a function of KT; it decreases as KT increases. This corresponds to the previous discussion on the prominence of positive deviation for clear-sky. r is 0.85.
Figure 7 exhibits the bias, standard-deviation, and RMSD in SSI as a function of the clearness index for all stations. For each interval of KT of 0.1 in width, we have computed the bias, standard-deviation, and RMSD of the deviations in SSI for the rainy season (Figure 7(a)) and dry season (Figure 7(b)). The bias is indicated by a cross, the standard-deviation by a bar, and the RMSD by a full line. In addition, we have plotted the relative frequency of KT (dashed lines) derived from HC-3. The relative frequency shows a smooth peak around KT=0.5 for the rainy season and a sharp peak around
KT=0.7 during the dry season.
For both seasons the magnitude of the bias is not constant, it takes the form of a bell-shaped curve which reaches its maximum for partly cloudy skies (0.3 < KT < 0.5) and decreases when thesky is becoming clearer or overcast. The bias in the dry season (Figure 7(b)) is always greater than that during the rainy season (Figure 7(a)) with a maximum in the former season, which corresponds to 2.5 times the maximum in the latter. These discrepancies in performances of the Heliosat-2 method for the same clearness index have probably the same causes than the differences in bias for each season: TL, types of cloud, and aerosols.
For all seasons, the standard deviation varies between 20-30 W/m² for clear and covered skies and increases up to 60 W/m² for partly covered skies. These changes in standard-deviation are related to the bell-shaped curve observed for the bias. One reason for such a shape is the parallax effect. Schutgens and Roebeling (2009) showed that errors due to this effect are dominant for a geostationary satellite and ground stations with a large viewing angle. In the case of the pixels in French Guiana, they are observed with large viewing angles. If they are covered by clouds, the parallax effect shifts these clouds eastwards. The sensor aboard the satellite does not see exactly what is happening in the atmospheric column right above a measuring station. This contributes to the deviation between HC-3 and ground measurements. The effect of the parallax on SSI or
KT is more pronounced when the cloud cover is fragmented, i.e. when the spatial variability in cloud cover is large. It is less pronounced when the cloud cover is homogeneous (low KT) or when the sky is clear, because a shift of homogeneous conditions has a small impact. This explains partly the bell-shape.
13 Cloud fragmentation may contribute to a larger bias for intermediate KT for another reason. Cebecauer et al. (2011) mention that the limited spatial resolution of the Meteosat sensor prevents from detecting small broken clouds such as cumulus. This patchwork of small clouds may be interpreted by the sensor and further by the Heliosat-2 method as a large thin cloud. This mistake contributes to the deviation. Its impact is more important for intermediate KT than for overcast skies (low KT) or clear skies (large
KT), thus contributing to the bell-shape form.
6. Conclusion
This study demonstrates that it is possible to obtain good quality estimations of irradiance over French Guiana when applying the Heliosat-2 method to Meteosat satellite images. A comparison between estimates and measurements of daily means of surface solar irradiance yields a bias ranging from 12 W/m² (6% of the mean of measurements) to 24 W/m² (12%) depending on the stations. The root mean square difference ranges between 23 W/m² (11%) and 35 W/m² (18%). r is close to 0.9 meaning that the day-to-day variations are well-reproduced. Better results are observed during the rainy season than during the dry season.
It has been shown that HC-3 satellite estimations are sensitive to seasonal variations. We found a correlation between the rainfall and the performances of HC-3. The bias is not constant and varies as a function of the season as well as of the variations in the onset and cessation dates of the seasons in relation to the position of the ITCZ and its intensity. The bias depends upon the Linke turbidity factor, which controls the prediction of the SSI under clear-sky which itself controls the prediction of the SSI for any sky. Bias also depends upon the type of sky observed, type of clouds, and fragmentation of the cloud cover, and aerosols. Large viewing angles of the Meteosat satellite induce shift in actual location of clouds and, in conjunction with the large size of the pixel over French Guiana, may contribute to decreasing performances in case of fragmented cloud cover.
These results authorize the use of the Heliosat-2 method to compensate for the lack of solar radiation maps of the northeastern region of Amazonia, as well as the exploitation of HC-3 estimates in management systems for solar electricity or solar heat production.
14 These results open new prospects for strengthening the Heliosat-2 method. It might be interesting, for example, to introduce more elaborate atmospheric transmittance models in order to decrease the uncertainty in the retrieval. Lefèvre et al. (2012) attained good results in the retrieval of the 1-min SSI under clear-sky by exploiting retrievals of the aerosol properties and total column content in ozone and water vapour issued by the MACC (Monitoring Atmosphere Composition and Climate) project cofunded by the European Commission. Regarding clouds, Qu et al. (2012) obtained results fairly close to HC-3 when using a radiative transfer model and detailed cloud properties derived from Meteosat images as inputs. These advanced elements could be studied for a further inclusion in Heliosat-2.
Future work is also planned to exploit images from GOES geostationary satellites offering smaller viewing angles of French Guiana in order to reduce the uncertainties and improve the accuracy of retrievals. Preliminary work made at l’UMR Espace-Dev at Cayenne shows that it is feasible; Zhang et al. (2011) demonstrate the applicability of the Heliosat-2 method to the Chinese FengYun-2C (FY-2C) satellite to map solar radiation over China.
Acknowledgements
The authors are grateful to Météo-France for supplying ground measurement data. They acknowledge the positive role of the reviewers whose comments help in increasing the quality of this article. The authors thank the company Transvalor, which manages the SoDa Service for public use, thus allowing access to the HelioClim databases.
15
References
ABDEL WAHAB, M., EL METWALLY, M., HASSAN, R., LEFÈVRE, M., OUMBE, A. and WALD, L., 2009, Assessing surface solar irradiance in Northern Africa desert climate and its long-term variations from Meteosat images. International Journal of Remote Sensing, 3, pp. 261-280.
ACULININ, A., 2008, Latitudinal variability of surface solar radiation in Moldova. Moldavian
Journal of the Physical Sciences, 7, pp. 247-253.
AL-JUMAILY, K.J., AL-SALIHI A.M. and AL-TAI, O.T., 2010, Evaluation of Meteosat-8 measurements using daily global solar radiation for two stations in Iraq. International Journal of
Energy and Environment, 1, pp.635-642.
BLANC, P., GSCHWIND, B., LEFÈVRE, M. and WALD, L., 2011, The HelioClim Project: Surface solar irradiance data for climate applications. Remote Sensing, 3, pp. 343-361.
BOVOLO, C.I., PEREIRA R., PARKIN, G., KILSBY, C. and WAGNERA, T., 2011, Fine-scale regional climate patterns in the Guianas, tropical South America, based on observations and reanalysis data. International Journal of Climatology, Available online in Wiley Online Library at: http://dx.doi.org/10.1002/joc.2387 (accessed 19 October 2011).
CANO, D., MONGET, J.-M., ALBUISSON, M., GUILLARD, H., REGAS, N. and WALD, L., 1986, A method for the determination of the global solar radiation from meteorological satellite data. Solar Energy, 37, pp. 31–39.
CEBECAUER, T., SURI, M. and GUEYMARD, C., 2011, Uncertainty sources in satellite-derived Direct Normal Irradiance: How can prediction accuracy be improved globally? In Proceedings of the SolarPACES Conference, Granada, Spain.
DAGESTAD, K.F., 2004, Mean bias deviation of HELIOSAT algorithm for varying cloud properties and sun-ground-satellite geometry. Theoretical and Applied Climatology, 79, pp. 215– 224.
DIABATÉ, L., DEMARCQ, H., MICHAUD-REGAS, N. and WALD, L., 1988, Estimating incident solar radiation at the surface from images of the Earth transmitted by geostationary satellites: the Heliosat Project. International Journal of Solar Energy, 5, pp. 261–278.
DOUNTIO, E.G., NJOMO, D., FOUDA, E. and SIMO, A., 2010, On the reliability of HELIOSAT method: A comparison with experimental data. Solar Energy, 84, pp. 1047–1058. DÜRR, B. and ZELENKA, A., 2009, Deriving surface global irradiance over the Alpine region from Meteosat Second Generation data by supplementing the Heliosat method. International
Journal of Remote Sensing, 30, pp. 5821-5841.
ESPINAR, B., RAMÍREZ, L., POLO, J., ZARZALEJO, L.F. and WALD, L., 2009, Analysis of the influences of uncertainties in input variables on the outcomes of the Heliosat-2 method. Solar
16 GEIGER, M., DIABATE, L., MENARD, L. and WALD, L., 2002, A web service for controlling the quality of measurements of global solar irradiation. Solar Energy, 73, pp. 475-480.
GOUDIE, A.S. and MIDDLETON, N.J., 2001, Saharan dust storms: nature and consequences.
Earth-Science Reviews, 56, pp 179–204.
GSCHWIND, B., MENARD, L., ALBUISSON, M. and WALD, L., 2006, Converting a successful research project into a sustainable service: the case of the SoDa Web service.
Environmental Modelling and Software, 21, pp. 1555-1561, doi:10.1016/j.envsoft.2006.05.002
HAMMER, A., HEINEMMAN, D., HOYER, C., KUHLEMANN, R., LORENZ, E., MUELLER, R. and BEYER, H.G, 2003, Solar energy assessment using remote sensing technologies. Remote Sensing of Environment, 86, pp. 423–432.
ISO, 1995, Guide to the Expression of Uncertainty in Measurement, 1st ed. International Organization for Standardization: Geneva, Switzerland.
LEFÈVRE, M., BAUER, O., IEHLE, A. and WALD, L., 2000, An automatic method for the calibration of time-series of Meteosat images. International Journal of Remote Sensing, 21, pp. 1025-1045
LEFÈVRE, M., DIABATÉ, L. and WALD, L., 2007, Using reduced data sets ISCCP-B2 from the Meteosat satellites to assess surface solar irradiance. Solar Energy, 81, pp. 240-253.
LEFÈVRE, M., OUMBE, A., BLANC, P., GSCHWIND, B., QU, Z., WALD, L., SCHROEDTER-HOMSCHEIDT, M., HOYER-KLICK, C., AROLA, A. and MORCRETTE, J.-J., 2012, Using MACC-derived products to predict clear-sky irradiance at surface. Geophysical Research Abstracts, Vol. 14, EGU General Assembly 2012, 22-27 April 2012, Vienna, Austria. MARCHAND, C., BALTZERB, F., LALLIER-VERGES, E. and ALBERIC, P., 2004, Pore-water chemistry in mangrove sediments: relationship with species composition and developmental stages (French Guiana). Marine Geology, 208, pp. 361–381.
MARIE-JOSEPH, I., 2003, Méthodologie de diagnostic appliquée à la maintenance préventive d’unités de production d’électricité en site isolé. Thèse de Doctorat, Université des Antilles et de la Guyane, France.
MARTINS, F.R., PEREIRA, E.B. and ABREU, S.L., 2007, Satellite-derived solar resource maps for Brazil under SWERA project. Solar Energy, 81, pp. 517-528.
MELIERES, M.A, POURCHET, M. and RICHARD, S., 2003, Surface air concentration and deposition of lead-210 in French Guiana: two years of continuous monitoring. Journal of
Environmental Radioactivity 66, pp 261–269.
MORADI, I., MUELLER, R., ALIJANI, B. and GHOLAM, A., 2009, Evaluation of the Heliosat-II method using daily irradiation data for four stations in Iran. Solar Energy, 83, pp. 150-156.
17 MÖSER, W. and RASCHKE, E., 1983, Mapping of global radiation and of cloudiness from Meteosat image data: theory and ground truth comparisons. Meteorologische Rundschau, 36, pp. 33–41.
MÖSER, W. and RASCHKE, E., 1984, Incident solar radiation over Europe estimated from Meteosat data. Journal of Applied Meteorology, 23, pp. 166–170.
MOUSSU, G., DIABATE, L., OBRECHT, D. and WALD, L., 1989, A method for the mapping of the apparent ground brightness using visible images from geostationary satellites.
International Journal of Remote Sensing, 10, pp. 1207–1225.
PEREZ, R., INEICHEN, P., MOORE, K., KMIECIK, M., CHAIN, C., GEORGE, R. and VIGNOLA, F., 2002, A new operational model for satellite-derived irradiances: description and validation. Solar Energy, 73, pp. 307–317.
PEREZ, R., SEALS, R. and ZELENKA, A., 1997, Comparing satellite remote sensing and ground network measurements for the production of site/time specific irradiance data. Solar
Energy, 60, pp. 89–96.
QIN, H., KAWAI, Y. and KAWAMURA, H., 2006, Comparison of downward surface solar radiation derived from GMS5/VISSR and of reanalysis products. Journal of Oceanography, 62, pp. 577-586.
QU, Z., OUMBE, A., BLANC, P., LEFÈVRE, M., WALD, L., SCHROEDTER-HOMSCHEIDT, M. and GESELL, G., 2012, A new method for assessing surface solar irradiance: Heliosat-4. Geophysical Research Abstracts, Vol. 14, EGU General Assembly 2012, 22-27 April 2012, Vienna, Austria.
RASCHKE, E., GRATZKI, A. and RIELAND, M., 1987, Estimates of global radiation at the ground from the reduced data sets of the International Satellite Cloud Climatology Project.
Journal of Climate, 7, pp. 205-213.
REMUND, J., WALD, L., LEFEVRE, M., RANCHIN, T. and PAGE, J., 2003, Worldwide Linke turbidity information. In Proceedings of ISES Solar World Congress, 16-19 June, Göteborg, Sweden, CD-ROM published by International Solar Energy Society.
RIGOLLIER, C., BAUER, O. and WALD, L., 2000, On the clear sky model of the 4th European Solar Radiation Atlas with respect to the Heliosat method. Solar Energy, 68, 33-48.
RIGOLLIER, C., LEFÈVRE, M., BLANC, P. and WALD L., 2002, The operational calibration of images taken in the visible channel of the Meteosat-series of satellites. Journal of
Atmospheric and Oceanic Technology, 19, pp. 1285-1293
RIGOLLIER, C., LEFEVRE, M. and WALD, L., 2004, The method Heliosat-2 for deriving shortwave solar radiation from satellite images. Solar Energy, 77, pp. 159–169.
SCHUTGENS, N.A.J. and ROEBELING, R.A., 2009, Validating the validation: The influence of liquid water distribution in clouds on the intercomparison of satellite and surface observations.
Journal of Atmospheric and Oceanic Technology, 26, pp. 1457-1474, doi: 10.1175/2009JTECHA1226.1.
18 TARPLEY, J.D., 1979, Estimating incident solar radiation at the surface from geostationary satellite data. Journal of Applied Meteorology, 18, pp. 1172-1181.
VAZQUEZ, M., IZQUIERDO, P., SANTOS, J.M., PRADO, M.T. and MAGRO, C., 2009, Monthly and yearly maps of daily average global solar radiation of the Madeira Archipelago (Portugal), obtained from Meteosat images and six meteorological stations. In Proceedings ISES Solar World Congress 2007, pp. 2641-2645, doi: 10.1007/978-3-540-75997-3_533.
VASQUEZ, T., 2009, The Intertropical Convergence Zone. Weatherwise magazine, available online at: http://www.weatherwise.org/Archives/Back%20Issues/2009/Nov-Dec%202009/full-Intertropical-Converge.html (accessed September-October 2009).
WALD, L., BLANC, P., LEFEVRE, M. and GSCHWIND, B., 2011, The performances of the HelioClim databases in Mozambique. In Proceedings ISES Solar World Congress 2011, 28 August – 2 September 2011, Kassel, Germany. Vol ‘Resource Assessment’, pp. 268-275.
WMO, 2008, Guide to Meteorological Instruments and Methods of Observation. WMO-No. 8, World Meteorological Organization, Geneva, Switzerland.
ZELENKA, A., PEREZ, R., SEALS, R., RENNE, D., 1999, Effective accuracy of satellite-derived hourly irradiances. Theor. Appl. Climatol., 62, pp. 199-207.
ZHANG, M., LIU, J., LI, G., FAN, J., DENG, H., REN, J. and CHEN Z., 2011, Solar irradiance estimated from FY-2 data at some north China sites. In Proceedings of the Geoscience and Remote Sensing Symposium (IGARSS) 2011, 24-29 July 2011, Vancouver, BC, Canada, pp. 3284 – 3287, doi: 10.1109/IGARSS.2011.6049921.
19
TABLES
Table 1: Ground meteorological stations in French Guiana.
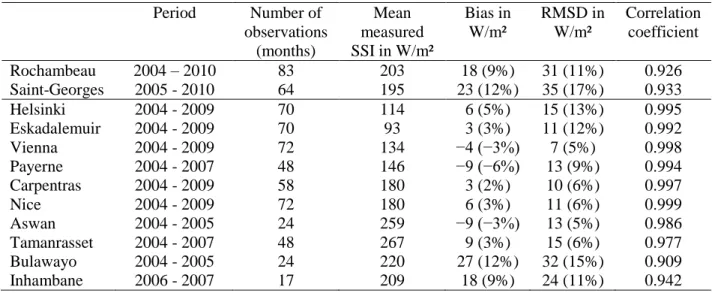
Table 2: HC-3 estimations minus measurements for monthly means of SSI for two sites in French Guiana, and other stations in Europe and Africa excerpted from Blanc et al. (2011). RMSD: root mean square difference. In brackets, quantities are relative to the mean measured SSI.
Period Number of observations (months) Mean measured SSI in W/m² Bias in W/m² RMSD in W/m² Correlation coefficient Rochambeau 2004 – 2010 83 203 18 (9%) 31 (11%) 0.926 Saint-Georges 2005 - 2010 64 195 23 (12%) 35 (17%) 0.933 Helsinki 2004 - 2009 70 114 6 (5%) 15 (13%) 0.995 Eskadalemuir 2004 - 2009 70 93 3 (3%) 11 (12%) 0.992 Vienna 2004 - 2009 72 134 −4 (−3%) 7 (5%) 0.998 Payerne 2004 - 2007 48 146 −9 (−6%) 13 (9%) 0.994 Carpentras 2004 - 2009 58 180 3 (2%) 10 (6%) 0.997 Nice 2004 - 2009 72 180 6 (3%) 11 (6%) 0.999 Aswan 2004 - 2005 24 259 −9 (−3%) 13 (5%) 0.986 Tamanrasset 2004 - 2007 48 267 9 (3%) 15 (6%) 0.977 Bulawayo 2004 - 2005 24 220 27 (12%) 32 (15%) 0.909 Inhambane 2006 - 2007 17 209 18 (9%) 24 (11%) 0.942
Stations Latitude (°) Longitude (°) Height (m) Data span Period for this study
Rochambeau 4.81 -52.37 4 1985-2010 2004-2010
Saint-Georges 3.88 -51.80 6 2005-2010 2005-2010
Maripasoula 3.63 -54.03 104 2008-2010 2008-2010
20 Table 3: Overall statistics of comparison between daily means of SSI from HC-3 and those
measured for all seasons, rainy and dry season.
Station # Valid days Mean measured SSI (W m²) Bias (W.m-2) Bias (%) RMSD (W.m-2) RMSD (%) Correlation coeff. All seasons Rochambeau 2514 203 19 9% 31 15% 0.93 Saint-Georges 1884 195 23 12% 35 18% 0.93 Maripasoula 584 212 12 6% 23 11% 0.91 Saint-Laurent 312 199 13 7% 26 13% 0.92 Average 5294 201 19 10% 32 16% 0.93 Rainy season Rochambeau 1453 178 12 7% 28 16% 0.93 Saint-Georges 1069 169 14 8% 31 18% 0.93 Maripasoula 388 199 7 3% 20 10% 0.91 Saint-Laurent 209 188 8 4% 22 12% 0.94 Average 3119 178 12 7% 28 16% 0.92 Dry season Rochambeau 1061 238 28 12% 36 15% 0.87 Saint-Georges 815 229 34 15% 40 17% 0.88 Maripasoula 196 237 22 9% 28 12% 0.85 Saint-Laurent 103 220 23 10% 34 15% 0.83 Average 2175 234 30 13% 37 16% 0.86
21
FIGURES
Figure 1: Thirty years average monthly rainfall and insolation in French Guiana (from Marchand et al., 2004).
Figure 2: Location of ground stations in French Guiana, superimposed on an image from the Meteosat satellite (copyright Eumetsat 1997)
ST-LAURENT
ROCHAMBEAU
ST-GEORGES MARIPASOULA
22 Figure 3: Scatter plot between measurements of daily means of SSI and HC-3 for: (a)
Rochambeau (HC3=1.01 Meas + 16.03), (b) SaintGeorges (HC3=1.12 Meas 0.43), (c) Maripasoula (HC-3=1.01 Meas + 10.11), (d) Saint-Laurent (HC-3=1.07 Meas + 0.12)
23 Figure 4: Monthly relative bias as a function of the monthly rainfall for (a) Rochambeau (bias=-0.01 rain + 11.24) and (b) Saint-Georges (bias=-0.02 rain + 15.69)
Figure 5: Scatter plot between measurements of daily means of SSI and HC-3 in (a) rainy season (HC-3=1.05 Meas + 2.56), and (b) dry season (HC-3=0.77 Meas + 84.01).
24 Figure 6: Scatter plot between measured daily means of clearness index (KT) and HC-3 in (a) rainy season (HC-3=1.05 Meas + 0.01), and (b) dry season (HC-3=0.73 Meas + 0.22)
Figure 7: Bias, standard deviation, and RMSD versus clearness index (KT) from HC-3, and frequency distribution of KT for rainy season (a) and dry season (b)
(a)