HAL Id: hal-01718031
https://hal.sorbonne-universite.fr/hal-01718031
Submitted on 27 Feb 2018
HAL is a multi-disciplinary open access
archive for the deposit and dissemination of
sci-entific research documents, whether they are
pub-lished or not. The documents may come from
teaching and research institutions in France or
abroad, or from public or private research centers.
L’archive ouverte pluridisciplinaire HAL, est
destinée au dépôt et à la diffusion de documents
scientifiques de niveau recherche, publiés ou non,
émanant des établissements d’enseignement et de
recherche français ou étrangers, des laboratoires
publics ou privés.
Distributed under a Creative Commons Attribution| 4.0 International License
in planktonic foraminifera but reveals unknown
hyper-abundant lineages
Raphael Morard, Marie-José Garet-Delmas, Frédéric Mahé, Sarah Romac,
Julie Poulain, Michal Kucera, Colomban de Vargas
To cite this version:
Raphael Morard, Marie-José Garet-Delmas, Frédéric Mahé, Sarah Romac, Julie Poulain, et al.. Surface
ocean metabarcoding confirms limited diversity in planktonic foraminifera but reveals unknown
hyper-abundant lineages. Scientific Reports, Nature Publishing Group, 2018, 8, pp.2539.
�10.1038/s41598-018-20833-z�. �hal-01718031�
www.nature.com/scientificreports
Surface ocean metabarcoding
confirms limited diversity in
planktonic foraminifera but reveals
unknown hyper-abundant lineages
Raphaël Morard
1,2, Marie-José Garet-Delmas
2, Frédéric Mahé
3, Sarah Romac
2, Julie Poulain
4,
Michal Kucera
1& Colomban de Vargas
2Since the advent of DNA metabarcoding surveys, the planktonic realm is considered a treasure trove of diversity, inhabited by a small number of abundant taxa, and a hugely diverse and taxonomically uncharacterized consortium of rare species. Here we assess if the apparent underestimation of plankton diversity applies universally. We target planktonic foraminifera, a group of protists whose known morphological diversity is limited, taxonomically resolved and linked to ribosomal DNA barcodes. We generated a pyrosequencing dataset of ~100,000 partial 18S rRNA foraminiferal sequences from 32 size fractioned photic-zone plankton samples collected at 8 stations in the Indian and Atlantic Oceans during the Tara Oceans expedition (2009–2012). We identified 69 genetic types belonging to 41 morphotaxa in our metabarcoding dataset. The diversity saturated at local and regional scale as well as in the three size fractions and the two depths sampled indicating that the diversity of foraminifera is modest and finite. The large majority of the newly discovered lineages occur in the small size fraction, neglected by classical taxonomy. These unknown lineages dominate the bulk [>0.8 µm] size fraction, implying that a considerable part of the planktonic foraminifera community biomass has its origin in unknown lineages.
After ~250 years of Linnean taxonomic work, >90% of the ocean’s biodiversity still appears to be undescribed1.
The quest to obtain an inventory of marine species is hampered by the difficulty to exhaustively sample the vast three-dimensional oceanic habitat. Because new proposals for species description require re-evaluation of exist-ing knowledge2, the taxonomic effort required to describe the unknown diversity increases as the Linnaean
cat-alogue becomes more complete. At the current pace, the completion of the Linnaean catcat-alogue seems to be a never-ending task, precluding an understanding of the function of the presumably unknown 90% of marine biodiversity.
A response to these limitations is to rely on targeted high throughput sequencing of environmental samples, or metabarcoding. Metabarcoding attempts to obtain an exhaustive inventory of all organisms in a given sample by sequencing short informative DNA barcodes (typically fragments of ribosomal genes). The obtained DNA sequences are clustered into Molecular Operational Taxonomic Units (MOTUs) which can be seen as proxies for the presence and relative abundance of the taxa present in the samples2 although the actual relative abundance
can be biased by differential rDNA copies number across organisms3 and diversity estimates can be inflated
because of intragenomic polymorphisms4. No time-consuming sorting of single specimen and expert taxonomic
assessment is involved in the process, but the actual organisms are never directly observed. Instead, the link with existing taxonomic knowledge is made by the comparison of the MOTUs with curated reference databases5,6,
mostly derived from barcoding efforts7. The taxonomic interpretation of environmental MOTUs relies on the
completeness of the existing reference databases and the taxonomic resolution of the chosen barcodes.
So far, metagenomic surveys of marine biodiversity depict the oceanic realm as a treasure trove of diversity8.
Microbial marine communities seem to be composed of a small number of abundant taxa co-occurring with
1MARUM Center for Marine Environmental Sciences, University of Bremen, Leobener Strasse, 28359, Bremen, Germany. 2Station Biologique de Roscoff, UMR7144, Sorbonne Universités UPMC Université Paris 06 & CNRS, Place Georges Teissier, 29680, Roscoff, France. 3CIRAD, UMR LSTM, F-34398, Montpellier, France. 4CEA—GENOSCOPE- Institut François Jacob, 2 rue Gaston Crémieux, 91057, Evry, France. Correspondence and requests for materials should be addressed to R.M. (email: rmorard@marum.de)
Received: 19 July 2017 Accepted: 24 January 2018 Published: xx xx xxxx
hugely diverse, undescribed and rare consortia. This “rare biosphere”8 is universally observed amongst
plank-tonic9,10 and benthic11 communities. Indeed, the recent metabarcoding survey of sunlit ocean by the Tara Oceans
project revealed that cosmopolitan MOTUs, representing 0.35% of the diversity, accounted for 68% of the volume of the dataset10. Less than 1% of the detected MOTUs had a perfect match with a reference sequence. This suggests
that a large portion of the marine biosphere is still uncharacterized by DNA barcoding.
However, metabarcode diversity can be inflated by the presence of chimeric sequences generated during PCR-based amplification12, or by sequencing errors13. Stringent quality control and detection algorithm such as
UCHIME14 are commonly used to remove potential chimeras from the dataset. But this practice bears the risk of
removing genuinely rare sequences from the dataset and thus “throw the baby out with the bathwater”15. Parsing
the ecological signal from the noise in metagenomic datasets is challenging16 and mostly study-dependent, which
impedes effort to compare different datasets that could reveal informative fine-scales community structures17.
Modeling approaches18, mock communities16, and application of ecological metrics15 can help to assess or reduce
the impact of false and low abundance MOTUs, but ultimately the genuine species richness of an ecosystem inves-tigated with metabarcoding approach is debatable19.
In summary, the availability of novel sequencing technologies brings new challenges in the assessment of biodiversity. Such assessment requires the simultaneous availability of curated reference databases, well-resolved barcodes, stringent but flexible bioinformatics pipelines and sufficient background taxonomic knowledge. In this study, we bring these elements together and use planktonic foraminifera, arguably the best-known group of pelagic protists, as a case study to assess the extent of their diversity through metabarcoding survey.
Planktonic foraminifera is a group of ubiquitous pelagic marine protists with reticulated pseudopods secret-ing a calcareous shell and clustersecret-ing within the Rhizaria20. The Foraminifera appeared in fossil record in the
early Cambrian21 but colonized the plankton only in the toarcian22. Plankton has been invaded several times by
independant lineages of benthic foraminifera23,24 and has a result, the planktonic foraminifera are polyphyletic25.
Since their first systematic description by d’Orbigny (1826), planktonic foraminifera have been a cornerstone of marine sediments dating26 and paleoceanographic reconstructions27. Their global geographic distribution,
sea-sonal dynamics and trophic behavior have been studied by sampling in the plankton28, sediment traps29 and
surface sediments30. After two centuries of taxonomic investigations, extant planktonic foraminifera diversity
seems to have settled with ~50 morphologically defined species31, much less than the 600–800 extant species of
radiolaria32, the sister group of foraminifera within the Rhizaria. This traditional view of the diversity in
plank-tonic foraminifera has been challenged by the discovery of cryptic diversity manifested in rRNA sequences33.
It revealed that most modern morpho-species of planktonic foraminifera are aggregates of cryptic biological species34. This unique single-cell sampling and rRNA sequencing effort has resulted in the creation of a
compre-hensive reference database, which includes 3,322 single-cell sequences of major morphospecies producing >90% of the recent fossil assemblages35 with curated taxonomy at the level of morphological and cryptic (biological)
species.
In the present study, we confront these two centuries of classical taxonomy, followed by two decades of single-cell genomics with a metabarcoding approach. We explore the planktonic foraminifera diversity in 32 size-fractioned samples collected at 8 localities representing the Indo-Pacific and Atlantic biomes sampled dur-ing the TARA Oceans expedition36. These samples were used to generate foraminifera-specific metabarcodes by
enriching the DNA extract through PCR amplification of a well-constrained foraminiferal barcode. The metabar-code was sequenced with Roche/454 pyrosequencing as it offers longer reads and thus more phylogenetic infor-mation to interpret potential novel lineages. The obtained barcodes were structured into MOTUs and integrated into existing molecular taxonomic framework33 to assess the extent of planktonic foraminifera diversity.
Material and Methods
Sampling of total plankton and amplification/sequencing of foraminiferal DNA.
Planktonsamples were recovered during the Tara ocean circum-global expedition36, from water volumes allowing
the-oretical saturation of plankton biodiversity in each organismal size-fraction37. We selected 32 samples collected
at 8 stations, 2 depths (Surface, between 0 and 10 meters, and Deep Chlorophyll Maximum, between 50 and 120 meters) and from 3 different plankton size fractions: micro- [20–180 µm], meso- [180–2000 µm] and bulk [>0.8 µm] plankton (Supplementary Material 1) the filtered volume of water varied between 90 liters for the smallest sized fraction to 736 m³ for the largest mesh size. The 8 selected Tara Oceans stations represented a mosaic of oceanic conditions: Indian Ocean (stations 64 and 65), Benguela current (stations 66 and 67), Agulhas rings (stations 68 and 78) and Sub-tropical Atlantic Ocean (stations 70 and 76)37. All the selected samples have
already analyzed using the V9 universal barcode primers and presented in10. The details of sample collection,
preservation and DNA extraction are presented in this study. Here, to amplify the relatively rare foraminiferal rDNA fragments out of plankton DNA extracts we developed a specific semi-nested PCR protocol. The first PCR amplification was carried out by mixing 1 µl of DNA extract with 0.4 µM of each specific foraminiferal primers S14F1 (5′-CCATCTCATCCCTGCGTGTCTCCGAC-3′) and S19F (5′-GTACRAGGCATTCCTRGTT-3′)38,39,
6% ethylene Glycol (Fisher BP 230.1), 3% of DMSO and 1X Mix Phusion High Fidelity DNA polymer-ase (Thermo Scientific F 532L) in a final volume of 25 µl. PCR amplification conditions were as follows: ini-tial denaturation at 98 °C for 60 seconds followed by 11 cycles at 98 °C for 10 seconds, 55 °C for 30 seconds and 72 °C for 30 seconds, and 11 cycles at 98 °C for 10 seconds, 52 °C for 30 seconds and 72 °C for 30 seconds and 10 minutes of final extension at 72 °C. The reverse S19F primer was modified with an adaptor of 30 nucleo-tides, a key of 4 nucleotides and a tag of 8 nucleotides appended to the PCR primer for Roche/454 sequencing. Each of the 32 resulting PCR products was subjected to a second round of amplification using the couple S15rF (5′-GTGCATGGCCGTTCTTAGTTC-3′)39 and S19F. Thirty-two unique tagged S15rF primers were designed
for Roche/454 sequencing to be unique, with a minimum of two differences between any pair of tags, and no more than 2 consecutive identical nucleotides (OBItools, http://metabarcoding.org/obitools) and to avoid the
www.nature.com/scientificreports/
formation of strong secondary structures with the Roche/454 adaptor A or the forward primer S15rF. The second PCR consisted in 1 µL of PCR product of the first PCR mixed with 0.4 µM of each tagged foraminifer-specific primers, 3% of DMSO and 1X Mix Phusion High Fidelity DNA polymerase (Thermo Scientific F 532L) in a final volume of 25 µL, with the following amplification conditions: initial denaturation at 98 °C for 60 seconds followed by 25 cycles at 98 °C for 10 seconds, 53 °C for 30 seconds and 72 °C for 30 seconds and 10 minutes of final exten-sion at 72 °C. Four PCR replicates and one negative control per samples were run in the second amplification to obtain enough DNA. Replicate PCR products were pooled for purification using the NucleoSpin
®
PCR Clean-Up (Macherey-Nagel) kit, and eluted in 20 µL of buffer following the manufacturer’s instructions. The concentration of PCR products were quantified with PicoGreen double strain DNA Quant-iT TM Kit (Invitrogen) with theSafire2 (TECAN). PCR products were mixed in equal concentration to obtain a similar number of amplicons per sample and were sequenced with the Roche/454 GS-FLX Titanium pyrosequencing technology (Genoscope, Paris).
Filtering and clustering of 454 pyrosequencing rDNA amplicons.
Only the ampliconscontain-ing the exact forward primer and no ambiguous nucleotide were retained. Potential chimeras were discarded using the UCHIME implementation in USEARCH 7.0 with default parameters14. Because of the relative long
length of the PCR product sequenced, ranging from 350 to 700 bp, only 32.22% of the sequences reached the reverse primer. Therefore, the sequences were trimmed off at 300 bp after the forward primer and clustered using SWARM v1.2.840 using a local threshold of two differences (d = 2) for accommodating the extreme rate
of rDNA substitution known in planktonic foraminifera41. The obtained MOTUs were assigned to their closest
hit in the Protist Ribosomal Reference database (PR2, based on GenBank v. 201)5, also truncated at 300 bp after
the forward primer, using ggsearch as implemented in FASTA v36.3.5c42. The result of the attribution is given in
Supplementary Material 1. The raw sequence data can be downloaded from the European Nucleotide Archive under BioProject PRJEB23355 (https://www.ebi.ac.uk/ena/data/view/PRJEB23355).
Phylogenetics.
We used a conservative and strict sequence selection process to analyze the phylogenetic structure of our dataset. In a conservative approach, only MOTUs attributed to foraminifera (Level 3 of PR² data-base ranked taxonomy), occurring in at least three samples and having a total abundance of at least ten reads were first considered for downstream analysis (Supplementary Fig. 1). The most abundant sequence of each MOTU was used as a prefix to search in the metabarcoding dataset the longest sequences of each MOTU that could have potentially reached the reverse primer. We retrieved the most abundant of the longest sequence of each of the retained MOTU to use them as a MOTU “representative sequence”. The representative sequences were manually checked, and those having an insufficient length or being potential chimera possibly omitted by UCHIME were excluded from the analysis.The retained representative sequences were automatically aligned using MAFFT v.743 with 81 sequences
rep-resentative of foraminifera diversity. We selected 57 planktonic foraminiferal reference sequences representing the morphospecies with an existing barcode with their sub-division into genetic type (or cryptic species) derived from the Planktonic Foraminifera Ribosomal Reference database (PFR²)35, and 24 representative sequences of the
major groups of benthic foraminifera with multi-locus wall chambered tests (Globothalamea)44. The best
substi-tution model was selected using jModeltest v. 245 and a phylogenetic inference was carried out using PhyML46
with 1,000 bootstrap pseudo replicates for estimation of the branch support. The resulting tree was visualized with iTOL47 (Fig. 1). The alignment and resulting tree inference are provided in Supplementary Material 2.
A molecular nomenclature framework for planktonic foraminifers.
No unique rDNAdissimi-larity threshold exists to discriminate genuine biological species in foraminifera33,48–50, or other group of
pro-tists51–53. The availability of the PFR² database permits to produce a flexible framework that do not rely on
fixed threshold but on the extensive taxonomic knowledge produced through single-cell genetic studies and to extend its properties onto the environmental sequences. To parse the different level of diversity of the environ-mental dataset into meaningful units, we produced a 4-rank molecular nomenclature taxonomic framework (Morphogroup|Genus|Morphospecies|Genetic Type) harmonized between the sequences derived from the ref-erence database and the MOTUs representative sequences. To this end, we applied the Automated Barcode Gap Discovery algorithm (ABGD)54 on crown groups of closely-related sequences displayed on the Fig. 1A: Basal,
Microperforates, Non-Spinose, Spinose, Long-Branch I and Long Branch II (See results for description of the groups). ABGD was run using the K80 distance option with a relative distance gap of 0.5 with 100 consecu-tive steps to cluster progressively the reference and environmental sequences from the level representing genetic types50 to the level representing morphological species. We used the existing delineation at both genetic type
and morpho-species levels among the reference sequences35 to select the levels of genetic and morphological
taxonomy amongst the MOTUs plateaus proposed by ABGD. MOTU plateau corresponding to genetic types were defined as the lowest plateau not merging reference sequences from distinct genetic lineages of the same morphospecies. Likewise, MOTU plateau corresponding to morpho-species were defined as the lowest plateau not merging reference sequences from distinct morphospecies. The robustness of the ABGD-based delineation at the two taxonomic levels was then evaluated with patristic distances calculated on the phylogenetic tree55
(Supplementary Fig. 2) coupled with Kolmogorov-Smirnov and Mann-Whitney tests calculated with PAST 2.1756
for distance comparisons (Supplementary Table 1).
Assignation of MOTUs to meta-reference database for ecological analyses.
The resulting 4-level ranked molecular nomenclature produced by the hierarchal ABGD clustering allowed re-assigning all the rare MOTUs (occurring in less than 3 samples and with less than 10 reads) and potential variants of abundant MOTUs, which were initially not considered in our analysis. To incorporate the maximum of the dataset in theFigure 1. (A) Maximum Likelihood phylogenetic inference for planktonic foraminifera environmental and
reference sequences. The tree, rooted on Textulariida sequences, includes 81 reference sequences of benthic and planktonic foraminifera, together with 155 representative sequences of each retained environmental MOTUs. The colored branches highlight the position of the major clades in the tree. (B–F) Individual clades shown in details. The branch support is highlighted by dots on the branch. The Bar chart on the right panel shows the abundance and occurrence of each MOTU in the dataset (Log scale). The two ranks ABGD species delimitation is provided by the vertical bars at the extreme right of each panel with the associated names next to it. The colors of the branch correspond to the “Genetic type” level delimitation, except for the “basal” clade were only the morphological level is considered.
www.nature.com/scientificreports/
final analysis, we produced a meta-reference database that included the PFR² database, the benthic foraminifera reference sequences available in the PR² database and the representative sequences of the environmental MOTUs. We aligned the taxonomic framework of the PR² and PFR² on the 4-level ranked nomenclature (Supplementary Material 3) and reassigned all MOTUs with the meta reference database (Supplementary Fig. 3, Supplementary Material 1). All MOTUs having an identity greater than 95% with sequences in the meta-reference and without ambiguous attribution were retained (Supplementary Fig. 3, Supplementary Material 1) and merged to produce the final ecological dataset (Fig. 2, Supplementary Material 4). MOTUs rarefaction curves at each Tara Oceans station, depth of collection, within each plankton size fraction, and for the total dataset were inferred using PAST v 2.1756 (Fig. 3).
Results
Amplicons filtering, phylogenetic diversity, and taxonomic delineation.
In total 159,995 rawrRNA sequences reads were obtained from the 32 sequenced samples. 101,362 reads were retained after quality filtering and clustered into 8,729 MOTUs. 907 MOTUs were assigned to eukaryotes other than foraminifera after comparison with the PR² database and were discarded (Supplementary Fig. 1, Supplementary Material 3). From the 7,822 MOTUs attributed to foraminifera, 176 occurred in at least three samples and had an abundance of at least ten amplicons. Seven MOTUs did not yield sufficiently long sequences to be interpreted in a phylogenetic framework and 14 MOTUs were identified as potential chimeras.
Phylogenetic inference including representative sequences of the retained 155 environmental MOTUs and 81 reference sequences of foraminifera resulted in 6 distinct but unsupported clades (Fig. 1A). Three clades were composed of reference sequences from microperforate (Fig. 1B), non-spinose (Fig. 1E), spinose and monolamel-lar (Fig. 1C) planktonic foraminifera and housed 58, 20 and 16 environmental MOTUs respectively. Two clades were composed of distantly related species of planktonic foraminifera characterized by significantly higher rates of rRNA substitution38 and are named “Long Branch I” (Fig. 1F) and “Long Branch II” (Fig. 1G). The “Long
Branch I” clade was composed of reference sequences from two known morphospecies (Globorotalia
truncat-ulinoides and Turborotalita quinqueloba) and housed two environmental MOTUs, whilst the “long-Branch II”
clade included only one reference sequence from a known morphospecies (Globorotalia menardii) and 13 rep-resentative sequences of MOTUs. The last clade included reprep-resentative sequences of benthic foraminifera plus the reference sequence for the basal non-spinose species Globoquadrina conglomerata. This clade, named “Basal”, was characterized by shorter branches and a lack of internal structure (Fig. 1D) and housed 42 environmental MOTUs.
A consistent barcode gap was observed between the “Intra-Genetic Type”, “Inter-Genetic Type” and “Inter-morphospecies” distances in the 6 clades (Supplementary Fig. 2). The intra- and inter-Genetic type dis-tances were always statistically supported in all clades (Supplementary Material 1), validating the clustering con-ducted with ABGD. Although such a gap was identified in the “Basal” group between the successive levels, no molecular taxonomy exists for the reference sequences of this clade composed primarily by benthic lineages which are notorious for their high level of intragenomic variability that can be wrongly interpreted as genuine diversity4. We observed that the maximum distances observed within the ABGD defined “morphospecies” within
this clade ranged from 4,47 to 6,51% which is compatible with the level of intraspecific variability observed in benthic foraminifera that can reach 35.2% in variable region4. Therefore, we chose a conservative interpretation of
our results and considered that no genetic types was present below the “morphospecies” level of diversity within that clade (Fig. 1).
The two-step clustering of ABGD grouped the 155 representative sequences of environmental MOTUs into 46 genetic types belonging to 26 morphological species (Fig. 1). Amongst the 46 detected genetic types, 21 had been described previously and 7 consisted of new genetic types belonging to 5 known morphospecies (Fig. 1). The remaining genotypes clustered within 12 novel putative morphospecies identified by our approach. Five clustered among the Basal clade (Basal A to Basal E), two clustered among the Microperforate clade (Micro A and Micro
B) and two clustered among Non-Spinose clade (Non-Spinose A and Non-Spinose B). Finally, we identified three
putative morphospecies composed of six sub-lineages with unknown phylogenetic affinities as they clustered into the artificial “Long-Branch II” clade.
Meta-reference attribution.
The Meta-Reference database included representative sequences of the 155 environmental MOTUs together with 1,342 reference sequences issued from the PR² database and 1,272 issued from the PFR² database and possessed 361 unique taxonomic paths (Supplementary Material 3). After re-assignment of the dataset by the meta-reference, 6,010 out of the 7,822 MOTUs representing 88,734 reads (94.5% of the foraminiferal amplicons) presented a similarity with reference sequences of 95% or more (Supplementary Fig. 3). Among those, we identified 230 rare MOTUs with a high similarity with 15 taxa present only in PR² or PFR² databases (Turborotalita quinqueloba types I and II, Globigerinoides ruber type I,Globigerinoides elongatus, Pulleniatina obliquiloculata type II, Neogloboquadrina sp., Neogloboquadrina incompta
type I, Globorotalia tumida, Globorotalia truncatulinoides type III, Globorotalia scitula, Hastigerina pelagica type II and Globigerinita glutinata type II, Cibicides refulgens, Globocassidulina sp. and Nonion sp.) that were not con-sidered in the initial analysis. As a result, the final retained dataset for ecological inferences was composed of 69 robustly defined genetic types belonging to 41 morphospecies (Fig. 2).
Ecological inferences.
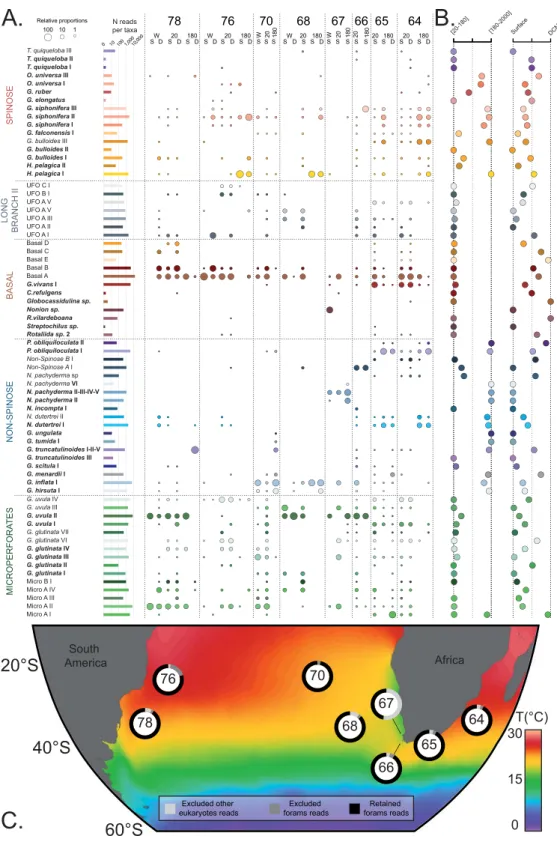
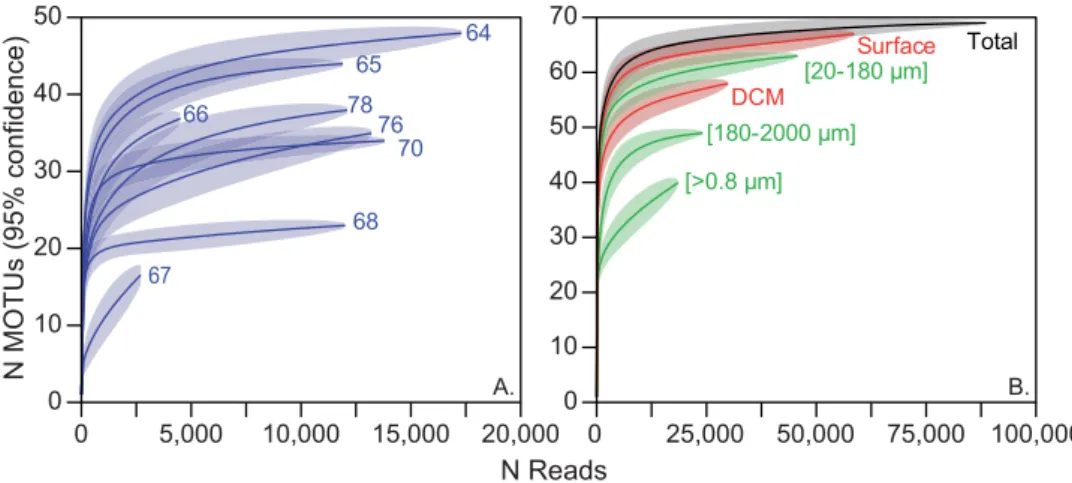
Rarefaction curves performed on the ecological dataset showed that saturation was reached in six of the 8 stations and for the total dataset (Fig. 3). Overall, saturation was reached at a sequenc-ing depth of 5,000 reads for individual stations and 25,000 reads for size fractions. A higher diversity level was encountered in the micro-plankton [20–180 µm] compared to the meso-plankton [180–2000 µm]. Interestingly,Figure 2. Ecological dataset. (A) Abundance and occurrence of the 69 planktonic foraminiferal taxa detected in
our environmental survey. The lines represent the occurrence of each taxon in all explored Tara Oceans stations, and the columns represent the individual samples. The size of the circles is proportional the relative abundance of each taxon within each sample (log values). 180, 20 and W correspond to the [180–2000 µm], [20–180 µm] and [>0.8 µm] size fractions. D and S correspond to the Deep Chlorophyll Maximum and Surface depths, respectively. (B) Relative occurrences of each taxon between the size fractions [20–180 µm] and [180–2000 µm] and between surface and DCM. (C) Geographic location of the station collections. The ring around the station number shows the partition of the reads obtained at each station. The background shows the mean annual Sea Surface Temperature extracted from the World Ocean Atlas 201365 and was generated with Ocean Data View66.
www.nature.com/scientificreports/
the saturation curves for the total dataset and all the samples recovered in surface waters were similar and offset from the saturation curve for the subsurface community, showing that nearly all encountered species were occur-ring at the surface.
Finally, we assessed the relative abundance of reads from each of the 5 clades in the 3 size fractions. Variation in SSU rDNA copy number within single-cell can potentially bias the estimation of relative abundances in metagen-omics surveys57. In benthic foraminifera, copy number can vary from 5,000–10,000 to 30,000–40,000 copies per
single cell depending of the species3. There is no estimation to date of the number of SSU rDNA copies within
single-cell of planktonic foraminifera, but we can reasonably assume that such bias exists as well. Therefore, we also compared the relative proportions of the census counts of foraminifera shells in surface sediments (Fig. 4). We found that the composition in the size fraction [180–2000 µm] roughly followed the relative proportions usu-ally observed in surface sediments typicusu-ally considering the size fraction >150 µm30. It shows that even if a bias
in the SSU rDNA copies number is likely to exists, it does not modify the relative proportion between the major phylum of foraminifera. These assemblages were typically dominated by the Spinose and Non-Spinose clades. However, the size fraction [20–180 µm] was dominated by the Microperforate and Basal clades whilst the Spinose and Non-spinose clades were in low abundance. The size fraction [>0.8 µm] returns essentially the same result as the size fraction [20–180 µm] suggesting that the planktonic foraminifera community is in majority dominated by clades occupying small size fractions. The Long-Branch II clade was consistently restricted to the [20–180 µm] and [>0.8 µm] size fractions, implying that its constitutive species are small.
Figure 3. Rarefaction curves of foraminifers based on the ecological dataset (Fig. 2) for the sampling stations (A) and for the organismal size fractions, sampling depth and overall dataset (B).
Figure 4. Relative contribution of the 5 clades in the three size classes and surface sediments (Data extracted
Discussion
The extent of microbial diversity in the ocean has been a matter of controversy58. Our investigation of the
diver-sity in planktonic foraminifera contributes to the resolution of this controversy by focusing on a clade with fully resolved classical taxonomy linked to barcodes. The target group is among the most extensively studied and character-rich groups of eukaryotic plankton, and after 200 years of taxonomy and 20 years of single-cell bar-coding, its diversity appears modest and finite. Here we evaluate the extent of planktonic foraminifera diversity through metabarcoding of environmental samples, covering the vertical and latitudinal habitat of the group and all size classes where foraminifera cells are likely to occur.
Following a rigorous method of attribution and taxa delineation, we show that the metabarcoding results are largely congruent with previous taxonomy knowledge. Amongst the 69 lineages detected in the environmental metabarcode, 50 could be attributed to 28 morphospecies for which reference sequences are available in public databases (Fig. 2). Only seven of those genotypes have not been previously detected by single cell surveys (Fig. 2). Seven genotypes unrelated to any known morphospecies could be attributed to known morphogroups and clus-tered into four putative morphospecies (Micro A, Micro B, Non-Spinose A, Non-Spinose B; Figs 1 and 2). These could correspond to classical morphospecies absent from reference databases such as the Tenuitelids for the Microperforates or the Globorotalids for the Non-spinose. The 12 remaining lineages could not be attributed to any known morphogroup and were assigned to two artificial categories. These lineages occurred in the [20–180 µm] size fraction, which is usually not considered in micropaleontology59. Indeed, micropaleontologists classically work
with specimen >150 µm because they are easier to handle, can be studied under a stereomicroscope and have more calcite weight for geochemical analyses60. The barcoding effort that led to the construction of the PFR² database35
was targeted on iconic morphospecies of planktonic foraminifera used in paleoceanography. The largest specimens more likely to yield enough DNA to be successfully PCR amplified were selected61. Therefore, it is logical that these
12 unknown genotypes are absent from the current databases because no barcoding effort has been directed so far on the size fraction where they occur. It is likely that some of those 12 lineages, structured into 8 putative mor-phospecies, could belong to described, but unsequenced mormor-phospecies, such as Orcadia riedeli, Dentigloborotalia
anfracta or Berggrenia pumilio which are usually small (Hemleben31). Indeed, the non-spinose morphospecies Globoquadrina conglomerata characterized by a slow rate of evolution clustered within the “Basal” clade and the
three fast evolving morphospecies Globorotalia truncatulinoides, Globorotalia menardii and Turborotalita
quinque-loba clustered into artificial groups (Fig. 1). Therefore, it is possible that these environmental genotypes match the documented morphological diversity, although they cluster outside of their “home” clades.
At the same time, we note that several abundant morphospecies in the sampled environment such as Trilobatus
sacculifer and Globigerinoides ruber were rare in the molecular dataset, which indicates the existence of a PCR bias
due to preferential amplification. This illustrates that metabarcoding, even if powerful, can still be partly blind62 and
that we cannot entirely exclude that unknown and ecologically relevant groups could have also been missed during the amplification. In addition, we followed a stringent path to build our ecological dataset. We chose to retain only the most abundant MOTUs as a first step to build a taxonomic framework aligned with existing databases (our so called meta-reference) and to re-assign the whole dataset as a second step. By doing that we retained ~78% of the MOTUs diversity and ~95% of the dataset volume. Importantly, only after this step, MOTUs belonging to 14 mor-phospecies present in the reference database but rejected by our initial iteration were retained. Therefore, the same may apply to yet undocumented morphospecies represented by low abundance MOTUs in the dataset.
Despite these factors that could under-estimate genuine diversity, rarefaction curves indicated that a near-saturation level of diversity was reached for the total dataset and at all stations (Fig. 3) except for station 67 where half of the reads were non-foraminifera (Fig. 2C). Even if the biogeographic range covered in our study is limited, our results strongly suggest that the diversity in planktonic foraminifera is finite and in the range of what has been estimated through single-cell genetic surveys50. We detected up to four genetic types per morphospecies
in our analysis, whereas up to seven were detected with single-cell genetic surveys50. When excluding taxa with a
modest sampling coverage, single-cell genetic surveys suggest that the morphological taxonomy underestimate genuine diversity by a factor of three on average50. Assuming that only ~50 forminifera morophotaxa exist after
two centuries of taxonomical efforts31, we can reasonably think that only a few hundred and not thousands of
planktonic foraminifera biological species exist.
One striking result of our study is the clear difference in community composition among the different size fractions (Fig. 4). We observed than the Microperforate and Basal clades dominated the size fraction [20–180 µm] and [>0.8 µm] whilst the community composition of the size fraction [180–2000 µm] matched with the surface sediments counts (Fig. 4). The later indicates that the dominance of the Microperforate and Basal clades in the smaller size fractions is not an artifact induced by preferential amplification but a genuine pattern. It appears that the planktonic foraminiferal community in small size fraction consist mostly of poorly characterized or uniden-tified lineages, which have so far received little attention from taxonomists.
Conclusion
The Tara metabarcoding survey of eukaryotic plankton diversity estimated the global diversity in the sunlit ocean at ~150,000 MOTUs, which is one order of magnitude higher than the 11,200 cataloged morphospecies described by traditional taxonomy10. Our results suggest that the implied unknown diversity might not be equally
distrib-uted among all planktonic lineages. Whilst some plankton groups are hyperdiverse such as the Diplonemids63,
our results indicate that at least among the planktonic foraminifera this diversity is limited and not too far from estimates based on classical taxonomy and single-cell barcoding efforts. The case of planktonic foraminifera underlines the crucial role of coverage in reference databases used for the interpretation of metabarcoding data. Our survey shows that the diversity of planktonic foraminifera is finite but also that a considerable part of its bio-mass, resulting in a flux of at least 25–100 Tg carbon/year to the sea floor64, is made of small size taxa that received
www.nature.com/scientificreports/
Data availability.
The raw sequence data can be downloaded from the European Nucleotide Archive under BioProject PRJEB23355 (https://www.ebi.ac.uk/ena/data/view/PRJEB23355).References
1. Mora, C., Tittensor, D. P., Adl, S., Simpson, A. G. B. & Worm, B. How many species are there on Earth and in the ocean? PLoS Biol.
9, e1001127 (2011).
2. Blaxter, M. Imagining Sisyphus happy: DNA barcoding and the unnamed majority. Philos. Trans. R. Soc. B Biol. Sci. 371, 20150329 (2016).
3. Weber, A. A. T. & Pawlowski, J. Can Abundance of Protists Be Inferred from Sequence Data: A Case Study of Foraminifera. PLoS
One 8, 1–8 (2013).
4. Weber, A. A.-T. & Pawlowski, J. Wide Occurrence of SSU rDNA Intragenomic Polymorphism in Foraminifera and its Implications for Molecular Species Identification. Protist 165, 645–661 (2014).
5. Guillou, L. et al. The Protist Ribosomal Reference database (PR2): a catalog of unicellular eukaryote Small Sub-Unit rRNA sequences with curated taxonomy. Nucleic Acids Res. 41, D597–D604 (2013).
6. Quast, C. et al. The SILVA ribosomal RNA gene database project: improved data processing and web-based tools. Nucleic Acids Res.
41, D590–D596 (2013).
7. Ratnasingham, S. & Hebert, P. D. N. BOLD: The Barcode of Life Data System (www.barcodinglife.org). Mol. Ecol. Notes 7, 355–364 (2007).
8. Sogin, M. L. et al. Microbial diversity in the deep sea and the underexplored ‘rare biosphere’. Proc. Natl. Acad. Sci. USA 103, 12115–20 (2006).
9. Logares, R. et al. Patterns of rare and abundant marine microbial eukaryotes. Curr. Biol. 24, 813–21 (2014). 10. de Vargas, C. et al. Eukaryotic plankton diversity in the sunlit ocean. Science (80-.). 348, 1261605–1261605 (2015). 11. Forster, D. et al. Benthic protists: the under-charted majority. FEMS Microbiol. Ecol. 92, fiw120 (2016).
12. Fonseca, V. G. et al. Sample richness and genetic diversity as drivers of chimera formation in nSSU metagenetic analyses. Nucleic
Acids Res. 40, 1–9 (2012).
13. Decelle, J., Romac, S., Sasaki, E., Not, F. & Mahé, F. Intracellular Diversity of the V4 and V9 Regions of the 18S rRNA in Marine Protists (Radiolarians) Assessed by High-Throughput Sequencing. PLoS One 9, e104297 (2014).
14. Edgar, R. C., Haas, B. J., Clemente, J. C., Quince, C. & Knight, R. UCHIME improves sensitivity and speed of chimera detection.
Bioinformatics 27, 2194–200 (2011).
15. Brown, S. P. et al. Scraping the bottom of the barrel: Are rare high throughput sequences artifacts? Fungal Ecol. 13, 221–225 (2015). 16. Nguyen, N. H., Smith, D., Peay, K. & Kennedy, P. Parsing ecological signal from noise in next generation amplicon sequencing. New
Phytol. 205, 1389–1393 (2015).
17. Grossmann, L. et al. Protistan community analysis: key findings of a large-scale molecular sampling. ISME J. 1–11, https://doi. org/10.1038/ismej.2016.10 (2016).
18. Dickie, I. A. Insidious effects of sequencing errors on perceived diversity in molecular surveys. New Phytol. 188, 916–918 (2010). 19. Esling, P., Lejzerowicz, F. & Pawlowski, J. Accurate multiplexing and filtering for high-throughput amplicon-sequencing. Nucleic
Acids Res. 43, 2513–2524 (2015).
20. Nikolaev, S. I. et al. The twilight of Heliozoa and rise of Rhizaria, an emerging supergroup of amoeboid eukaryotes. Proc. Natl. Acad.
Sci. USA 101, 8066–71 (2004).
21. Pawlowski, J. et al. The evolution of early Foraminifera. Proc. Natl. Acad. Sci. USA 100, 11494–8 (2003). 22. Hart, M. B. et al. The search for the origin of the planktic Foraminifera. J. Geol. Soc. London. 160, 341–343 (2003).
23. Arenillas, I. & Arz, J. A. Benthic origin and earliest evolution of the first planktonic foraminifera after the Cretaceous/Palaeogene boundary mass extinction. Hist. Biol. 29, 25–42 (2017).
24. Kucera, M. et al. Caught in the act: anatomy of an ongoing benthic–planktonic transition in a marine protist. J. Plankton Res. 39, 436–449 (2017).
25. Darling, K. F., Wade, C. M., Kroon, D. & Brown, A. J. L. Planktic foraminiferal molecular evolution and their polyphyletic origins from benthic taxa. Mar. Micropaleontol. 30, 251–266 (1997).
26. Berggren, W. A., Kent, D. V., Swisher, C. C. & Aubry, M.-P. A revised cenozoic geochronology and chronostratigraphy.
Geochronology, Time Scales, and Global Stratigraphic Correlation 54, 129–212 (1995).
27. Hillaire-Marcel, C. & de Vernal, A. Proxies in Late Cenozoic Paleoceanography. Developments in Marine Geology 1, (Elsevier, 2007). 28. Bé, A. W. H. & Hutson, W. H. Ecology of planktonic foraminifera and biogeographic patterns of life and fossil assemblages in the
Indian Ocean. Micropaleontology 23, 369–414 (1977).
29. Jonkers, L. & Kučera, M. Global analysis of seasonality in the shell flux of extant planktonic Foraminifera. Biogeosciences 12, 2207–2226 (2015).
30. Kucera, M., Rosell-Melé, A., Schneider, R., Waelbroeck, C. & Weinelt, M. Multiproxy approach for the reconstruction of the glacial ocean surface (MARGO). Quat. Sci. Rev. 24, 813–819 (2005).
31. Hemleben, C., Michael, S. & Anderson, O. R. Modern Planktonic Foraminifera. (Springer-Verlarg, 1989).
32. Suzuki, N. & Not, F. Marine Protists. in Marine Protists: Diversity and Dynamics (eds. Ohtsuka, S., Suzaki, T., Horiguchi, T., Suzuki, N. & Not, F.) 1–637 (Springer Japan, https://doi.org/10.1007/978-4-431-55130-0 (2015)
33. Morard, R. et al. Nomenclature for the Nameless: A Proposal for an Integrative Molecular Taxonomy of Cryptic Diversity Exemplified by Planktonic Foraminifera. Syst. Biol. 65, 925–940 (2016).
34. Darling, K. F. & Wade, C. M. The genetic diversity of planktic foraminifera and the global distribution of ribosomal RNA genotypes.
Mar. Micropaleontol. 67, 216–238 (2008).
35. Morard, R. et al. PFR2: a curated database of planktonic foraminifera 18S ribosomal DNA as a resource for studies of plankton
ecology, biogeography and evolution. Mol. Ecol. Resour. 15, 1472–1485 (2015).
36. Karsenti, E. et al. A holistic approach to marine Eco-systems biology. PLoS Biol. 9, e1001177 (2011).
37. Pesant, S. et al. Open science resources for the discovery and analysis of Tara Oceans data. Sci. Data 2, 150023 (2015).
38. de Vargas, C., Zaninetti, L., Hilbrecht, H. & Pawlowski, J. Phylogeny and rates of molecular evolution of planktonic foraminifera: SSU rDNA sequences compared to the fossil record. J. Mol. Evol. 45, 285–294 (1997).
39. Morard, R. et al. Worldwide genotyping in the planktonic foraminifer Globoconella inflata: Implications for life history and paleoceanography. PLoS One 6, e26665 (2011).
40. Mahé, F., Rognes, T., Quince, C., de Vargas, C. & Dunthorn, M. Swarm: robust and fast clustering method for amplicon-based studies PrePrints PrePrints. PeerJ 1–12, https://doi.org/10.7287/peerj.preprints.386v1 (2014).
41. de Vargas, C. & Pawlowski, J. Molecular versus taxonomic rates of evolution in planktonic foraminifera. Mol. Phylogenet. Evol. 9, 463–469 (1998).
42. Pearson, W. R. & Lipman, D. J. Improved tools for biological sequence comparison. Proc. Natl. Acad. Sci. USA 85, 2444–2448 (1988). 43. Katoh, K. & Standley, D. M. MAFFT multiple sequence alignment software version 7: Improvements in performance and usability.
Mol. Biol. Evol. 30, 772–780 (2013).
44. Pawlowski, J., Holzmann, M. & Tyszka, J. New supraordinal classification of Foraminifera: Molecules meet morphology. Mar.
45. Darriba, D., Taboada, G. L., Doallo, R. & Posada, D. jModelTest 2: more models, new heuristics and parallel computing. Nat.
Methods 9, 772–772 (2012).
46. Guindon, S. et al. New algorithms and methods to estimate maximum-likelihood phylogenies: Assessing the performance of PhyML 3.0. Syst. Biol. 59, 307–321 (2010).
47. Letunic, I. & Bork, P. Interactive Tree Of Life v2: online annotation and display of phylogenetic trees made easy. Nucleic Acids Res.
39, W475–W478 (2011).
48. Aurahs, R. et al. Using the Multiple Analysis Approach to Reconstruct Phylogenetic Relationships among Planktonic Foraminifera from Highly Divergent and Length-polymorphic SSU rDNA Sequences. Bioinform. Biol. Insights 3, 155–177 (2009).
49. Göker, M., Grimm, G. W., Auch, A. F., Aurahs, R. & Kučera, M. A clustering optimization strategy for molecular taxonomy applied to planktonic foraminifera SSU rDNA. Evol. Bioinforma. 6, 97–112 (2010).
50. André, A. et al. SSU rDNA divergence in planktonic foraminifera: molecular taxonomy and biogeographic implications. PLoS One
9, e104641 (2014).
51. Dunthorn, M., Klier, J., Bunge, J. & Stoeck, T. Comparing the hyper-variable V4 and V9 regions of the small subunit rDNA for assessment of ciliate environmental diversity. J. Eukaryot. Microbiol. 59, 185–7 (2012).
52. Logares, R. et al. Diversity patterns and activity of uncultured marine heterotrophic flagellates unveiled with pyrosequencing. ISME
J. 6, 1823–1833 (2012).
53. Pernice, M. C., Logares, R., Guillou, L. & Massana, R. General patterns of diversity in major marine microeukaryote lineages. PLoS
One 8, e57170 (2013).
54. Puillandre, N., Lambert, A., Brouillet, S. & Achaz, G. ABGD, Automatic Barcode Gap Discovery for primary species delimitation.
Mol. Ecol. 21, 1864–1877 (2012).
55. Lefébure, T., Douady, C. J., Gouy, M. & Gibert, J. Relationship between morphological taxonomy and molecular divergence within Crustacea: proposal of a molecular threshold to help species delimitation. Mol. Phylogenet. Evol. 40, 435–47 (2006).
56. Hammer, Ø., Harper, Da. T. & Ryan, P. D. Paleontological statistics software package for education and data analysis. Palaeontol.
Electron. 4, 9–18 (2001).
57. Poulain, J., Biard, T., Bigeard, E., Audic, S. & Poulain, J. Biogeography and diversity of Collodaria (Radiolaria) in the global ocean Biogeography and diversity of Collodaria (Radiolaria) in the global ocean. Nat. Publ. Gr, https://doi.org/10.1038/ismej.2017.12 (2017).
58. Leray, M. & Knowlton, N. Censusing marine eukaryotic diversity in the twenty-first century. Philos. Trans. R. Soc. Lond. B. Biol. Sci.
371, 20150331 (2016).
59. Brummer, G. A., Hemleben, C. & Michael, S. Planktonic foraminiferal ontogeny and new perspectives for micropalaeontology.
Nature 319, 50–52 (1986).
60. Katz, M. E. et al. Traditional and Emerging Geochemical Proxies in Foraminifera. J. Foraminifer. Res. 40, 165–192 (2010). 61. Weiner, A. K. M. et al. Methodology for single-cell genetic analysis of planktonic foraminifera for studies of protist diversity and
evolution. Fontiers Mar. Sci. 3, 1–15 (2016).
62. Cowart, D. A. et al. Metabarcoding is powerful yet still blind: A comparative analysis of morphological and molecular surveys of seagrass communities. PLoS One 10, 1–26 (2015).
63. Flegontova, O. et al. Extreme Diversity of Diplonemid Eukaryotes in the Ocean. Curr. Biol. 26, 3060–3065 (2016).
64. Schiebel, R. & Movellan, A. First-order estimate of the planktic foraminifer biomass in the modern ocean. Earth Syst. Sci. Data 4, 75–89 (2012).
65. Locarnini, R. A. et al. World Ocean Atlas 2013, Volume 1: Temperature. NOAA Atlas NESDIS 73 40 pp. (2013). 66. Schlitzer, R. Ocean Data View. (2017).
67. Wickham, H. ggplot2: Elegant Graphics for Data Analysis. (Springer-Verlag, 2009).
68. R Development Core Team. R: A language and environment for statistical computing. R Foundation for Statistical Computing. Available at: http://www.r-project.org/ (2014).
Acknowledgements
This work was supported by the French Government ‘Investissement d’Avenir’ program OCEANOMICS (ANR-11-BTBR-0008), the ANR project POSEIDON (ANR-09-BLAN-0348), FRANCE GENOMIQUE (ANR-10-INBS-09-08) and from the DFG-Research Center/Cluster of Excellence ‘The Ocean in the Earth System’. This article is contribution #61 of Tara Oceans.
Author Contributions
C.d.V. and R.M. conceived the study. M.J.G.D., J.P., S.R. and R.M. produced the dataset and F.M. performed the bioinformatic analyses. R.M. wrote the manuscript with the help of M.K., F.M. and C.d.V. All authors reviewed and approved the final manuscript.
Additional Information
Supplementary information accompanies this paper at https://doi.org/10.1038/s41598-018-20833-z.
Competing Interests: The authors declare no competing interests.
Publisher's note: Springer Nature remains neutral with regard to jurisdictional claims in published maps and
institutional affiliations.
Open Access This article is licensed under a Creative Commons Attribution 4.0 International
License, which permits use, sharing, adaptation, distribution and reproduction in any medium or format, as long as you give appropriate credit to the original author(s) and the source, provide a link to the Cre-ative Commons license, and indicate if changes were made. The images or other third party material in this article are included in the article’s Creative Commons license, unless indicated otherwise in a credit line to the material. If material is not included in the article’s Creative Commons license and your intended use is not per-mitted by statutory regulation or exceeds the perper-mitted use, you will need to obtain permission directly from the copyright holder. To view a copy of this license, visit http://creativecommons.org/licenses/by/4.0/.