HAL Id: hal-02468853
https://hal.umontpellier.fr/hal-02468853
Submitted on 19 Nov 2020
HAL is a multi-disciplinary open access archive for the deposit and dissemination of sci-entific research documents, whether they are pub-lished or not. The documents may come from teaching and research institutions in France or abroad, or from public or private research centers.
L’archive ouverte pluridisciplinaire HAL, est destinée au dépôt et à la diffusion de documents scientifiques de niveau recherche, publiés ou non, émanant des établissements d’enseignement et de recherche français ou étrangers, des laboratoires publics ou privés.
Will urbanisation affect the expression level of genes
related to cancer of wild great tits?
Mathieu Giraudeau, Hannah Watson, Daniel Powell, Orsolya Vincze, Frederic
Thomas, Tuul Sepp, Beata Ujvari, Guillaume Le Loc’H, Caroline Isaksson
To cite this version:
Mathieu Giraudeau, Hannah Watson, Daniel Powell, Orsolya Vincze, Frederic Thomas, et al.. Will urbanisation affect the expression level of genes related to cancer of wild great tits?. Science of the Total Environment, Elsevier, 2020, 714, pp.135793. �10.1016/j.scitotenv.2019.135793�. �hal-02468853�
1
Will urbanisation affect the expression level of genes related to cancer of
1
wild great tits?
2 3
Mathieu GIRAUDEAU1,2, Hannah WATSON3, Daniel POWELL3, Orsolya VINCZE4,5,
4
Frederic THOMAS1,2, Tuul SEPP6, Beata UJVARI7, Guillaume LE LOC’H8 and Caroline
5
ISAKSSON3
6 7
1
Centre de Recherche en Écologie et Évolution de la Santé (CREES), Montpellier
8
2
CREEC/MIVEGEC (CNRS – IRD – Université de Montpellier)
9
3
Department of Biology, Lund University, SE-223 62 Lund, Sweden
10
4
Hungarian Department of Biology and Ecology, Evolutionary Ecology Group, Babeş-Bolyai
11
University, Cluj‐ Napoca, Romania
12
5
Department of Tisza Research, MTA Centre for Ecological Research, Debrecen, Hungary
13
6
Institute of Ecology and Earth Sciences, University of Tartu, Vanemuise 46, 51014 Tartu,
14
Estonia
15
7
Centre for Integrative Ecology, School of Life and Environmental Sciences, Deakin
16
University, Waurn Ponds, Australia
17
8
École nationale vétérinaire de Toulouse, Toulouse, France
18 19
2 Abstract
20
Recent studies suggest that oncogenic processes (from precancerous lesions to
21
metastatic cancers) are widespread in wild animal species, but their importance for ecosystem
22
functioning is still underestimated by evolutionary biologists and animal ecologists. Similar to
23
what has been observed in humans, environmental modifications that often place wild
24
organisms into an evolutionary trap and/or exposes them to a cocktail of mutagenic and
25
carcinogenic pollutants might favor cancer emergence and progression, if animals do not
up-26
regulate their defenses against these pathologies. Here, we compared, for the first time, the
27
expression of 59 tumor-suppressor genes in blood and liver tissues of urban and rural great tits
28
(Parus major); urban conditions being known to favor cancer progression due to, among other
29
things, exposure to chemical or light pollution. Contrary to earlier indications, once we
30
aligned the transcriptome to the great tit genome, we found negligible differences in the
31
expression of anti-cancer defenses between urban and rural birds in blood and liver. Our
32
results indicate the higher expression of a single caretaker gene (i.e. BRCA1) in livers of rural
33
compared to urban birds. We conclude that, while urban birds might be exposed to an
34
environment favoring the development of oncogenic processes, they seem to not upregulate
35
their cancer defenses accordingly and future studies should confirm this result by assessing
36
more markers of cancer defenses. This may result in a mismatch that might predispose urban
37
birds to higher cancer risk and future studies in urban ecology should take into account this,
38
so far completely ignored, hazard.
3 Introduction
40
Over the last century, the size of urban centres has drastically increased all over the world
41
with considerable effects on natural ecosystems (Marzluff et al., 2008). Consequently, many
42
wild species are now experiencing extreme changes in their habitats with, among other things,
43
an increased exposure to a mixture of mutagenic pollutants, changes in habitat temperature
44
(i.e. heat-island effect) and/or access to novel types of food items through human waste or
45
intentional feeding. As these environmental modifications, as well as other characteristics of
46
our modern world, have increased cancer prevalence in humans (Kloog et al., 2010), similar
47
effects can also be expected in wild animals living in human-modified habitats, and especially
48
in urban environments (Giraudeau et al., 2018; Sepp et al., 2019). In line with this hypothesis,
49
it has now been shown that most animal species can develop cancer (Madsen et al., 2017), and
50
several studies proposed that, even if invasive metastatic cancer might be rare in wild animals,
51
most metazoan organisms should start to host early stages of oncogenic processes early in life
52
and thus host them for months, years or decades with some effects on their health and vigour
53
and an impact on intra- and inter-specific relationships (Vittecoq et al., 2013, Thomas et al.
54
2017). In addition, evidence is starting to accumulate showing that exposure to pollution
55
might strongly affect neoplasia development in wild populations (Martineau et al., 2002).
56
However, while cancer is one of the leading causes of mortality in humans and a research
57
topic of prime importance for scientists and funding agencies worldwide, our understanding
58
of oncogenic processes in wild populations is extremely limited due to the methodological
59
difficulties of measuring this pathology in wild animals. Even more important in terms of
60
conservation, the ability of wild organisms to limit cancer progression in “oncogenic
61
environments” (i.e. habitats that favour neoplasia development such as those polluted with
62
chemicals or artificial light at night) has never been studied in the field. In addition, longer
63
lifespan has been linked with higher cancer-related mortality in humans, and age is considered
4
to be one of the major risk factors for cancer (White et al., 2014). As it has been suggested
65
that many wild species also experience lower predation rates and increased survival to older
66
age in urban environments (e.g. see Sepp et al., 2018)), age-related increase in cancer risk in
67
wild animals in urban environment should also be considered.
68 69
To fill this gap, we used a recently published transcriptome analysis which compared
70
gene expression levels between urban and rural great tits and focused our analysis on the
71
expression of 59 well-known tumour suppressor genes. In addition, the previous analyses
72
published by Watson et al. (2017) aligned the transcriptome to the best available genome at
73
the time of their publication (i.e. zebra finch). In order to perform a more accurate scrutiny of
74
differential expression of tumor-suppressor genes, we re-aligned the above transcriptomes to
75
the great tit genome and re-analysed the latter. Given that urban great tits up-regulate the
76
expression of genes related to immune activity, detoxification and repair machinery (Watson
77
et al., 2017), we predicted that they might also up-regulate the activity of genes related to
78 cancer defences. 79 80 Methods 81
Field and laboratory methods have been previously described in (Watson et al., 2017).
82
Briefly, six urban male great tits (Malmö, 55°35′N 12°59′E) and six rural great tits (Vombs
83
fure located 35 km northeast of Malmö, 55°39′N 13°33′E), were captured in late winter 2014.
84
At capture, birds were transported to the laboratory in Lund where biometrics were recorded,
85
and a blood sample was collected and immediately transferred to storage at −80 °C. Birds
86
were then euthanized and liver tissues were collected and transferred to storage at −80°C
87
within 5 min of death. RNA was isolated and sequenced using 100 bp paired-end RNA-seq on
88
Illumina HiSeq 2000. For the present study, we focused on the re-analysis of 59
5
suppressor genes including 31 gatekeeper genes and 28 caretaker genes, following (Caulin
90
and Maley, 2011). By limiting DNA damage and being involved in DNA repair, caretaker
91
genes help to maintain genome integrity and thus limit cancer initiation. Gatekeeper genes are
92
involved in the control of cells at risk for neoplastic transformation in order to stop their
93
propagation (Caulin and Maley, 2011).
94
Read quality was first assessed using FastQC 0.11.5
95
(https://www.bioinformatics.babraham.ac.uk/projects/fastqc/), and quality trimming and
96
filtering were performed to remove low-quality reads and adapter contamination using
97
Trimmomatic (Bolger et al., 2014). Clean reads were aligned to the annotated regions of the
98
great tit genome (Parus_major1.1 RefSeq assembly accession GCF_001522545.2) using
99
HiSat2 2.1.0 (Kim et al., 2015) and sorted with SAMtools 1.5 (Li et al., 2009). Counts were
100
made using StringTie 1.3.3 (Pertea et al., 2015) in accordance with the protocol described by
101
Pertea et al. (Pertea et al., 2016). Counts were extracted for the 59 target genes. Following
102
(Watson et al., 2017), one rural bird was removed from the analysis of reads from blood, since
103
PCA revealed it to be an extreme outlier. All raw reads have been deposited in NCBI’s
104
Sequence Read Archive (PRJNA314210).
105 106
Statistical analyses
107
Analyses of differences in the expression of various genes between urban and rural great tits
108
were performed separately for counts originating from blood and liver tissue, using the edgeR
109
3.24.3 package (Robinson et al., 2009) in R 3.5.2 (R Core Team 2018). Only genes with
110
expression greater than one count per million (CPM) in at least two samples were considered
111
for the differential expression analyses in order to filter out weakly expressed genes. As such,
112
a total of 52 and 51 genes were tested for differential expression in liver and blood
113
respectively (see Table S1 for the list of genes tested and excluded). Six of the target genes
6
have not been annotated in the great tit genome and there was no detectable expression of
115
PHOX2B. P-values obtained from the differential expression analyses were corrected for
116
multiple comparisons using the Benjamini–Hochberg (BH) procedure and only genes
117
determined to have a false discovery rate (FDR) < 0.05 were considered to be significant.
118
In order to visualize the expression profiles of the sampled individuals, we generated
119
heatmaps (see ESM) of the regularized log-transformed count data using the “pheatmap”
120
function (R., 2019). Counts of gene expression were clustered for the genes according to the
121
similarity of expression profiles across different samples.
122 123
This study was carried out in accordance with Swedish legislation and approved by the
124
Malmö-Lund animal ethics committee (Dnr M454 12:1).
125 126
Results 127
None of the 51 genes on which our analysis was focused were differentially expressed in
128
blood and only one gene (BRCA1) was differentially expressed among the 52 genes tested in
129
liver tissue between urban and rural great tits following p-value adjustment (see Table 1a and
130
1b, respectively, for the differential expression statistics of each of these genes). BRCA1 was
131
expressed at significantly higher levels in rural, compared with urban birds in liver, but not
132 blood tissues. 133 134 Discussion 135
Despite the increasing occurrence of epizootics of cancer observed in wild species
136
(McAloose and Newton, 2009) and the broad distribution of oncogenic processes along the
137
tree of life (Athena Aktipis et al., 2015), wildlife cancer is, for the moment, a largely
138
unexplored topic (except for a few emblematic species such as the Tasmanian devil
7
(Sarcophilus harrisii (Ujvari et al., 2016)) or the sea turtle (Chelonia mydas (Duffy et al.,
140
2018)). This lack of interest from the scientific community is explained by the misconception
141
shared by many ecologists and evolutionary biologists until recently that only late-stage
142
visually detectable cancers affect wild organisms, mostly after the end of the reproductive
143
period. Many articles published over the last few years have challenged this view, and it is
144
now admitted that the first cancerous cells appear early in life and that the community of
145
cancer cells (i.e. oncobiota) is a major actor of evolutionary processes influencing host
life-146
history traits and strategies (Vittecoq et al., 2013, Thomas et al., 2017, Pesavento et al., 2018,
147
Giraudeau et al., 2018).
148
An intriguing question in this emerging field of study, with consequences for the conservation
149
of wild species, concerns the ability of wild organisms inhabiting environments impacted by
150
human activities to adjust their level of defenses against this pathology whose progression
151
should be stimulated by, among other things, exposure to many carcinogenic pollutants
152
(Vittecoq et al., 2018). Our study constitutes a first attempt to study this question in wild
153
urban birds, in a population known to be exposed to higher levels of urban pollutant (i.e. nitric
154
oxide, a marker of traffic-related air pollution) (Salmón et al., 2018a) known to be associated
155
with cancer in humans (Cohen et al. 2019). While examining the expression of a large number
156
of suppressor genes, we found negligible differences in the expression of
tumor-157
suppressor genes between urban and rural great tits examined in blood and liver tissues. The
158
only gene differentially expressed was BRCA1, with reduced levels of expression in urban
159
birds. BRCA1 is involved in the maintenance of genome integrity by repairing damaged DNA
160
and has been mainly associated with breast and prostate cancers so far in humans (Gorodetska
161
et al. 2019). Given our limited knowledge on the consequences of a reduced expression of
162
BRCA1 in liver, especially in wild birds, it’s difficult to draw any conclusion based on this
8
result. However, we can hypothesize that this reduced expression might favor the
164
development of oncogenic processes in urban birds.
165
One can argue that the sample size used in this study was too small to detect differences
166
between populations, but due to the terminal nature of our sampling to get the liver samples
167
and for obvious ethical reasons, we preferred to limit the number of individuals euthanized for
168
this study. In addition, the sample size used here is common for this kind of study and
169
(Watson et al., 2017) found large differences in the expression of genes related to immune
170
activity, detoxification and repair machinery using the same transcriptome data and thus the
171
same sample size. We can also exclude the hypothesis that rural birds were exposed to
172
mutagenic substances, such as pesticides to explain the absence of significant differences
173
observed in our study since our rural site was a water reserve area without any agricultural
174
activity nearby.
175
Avian antitumor defenses have been mainly described in poultry, with a focus on
176
commercially relevant diseases like the avian leucosis virus, which induces various neoplasias
177
in chickens (Sironi et al., 2006). In this model system, transcriptome analyses have indicated a
178
significant decrease of the expression of genes related to both immune defenses and antitumor
179
pathways in spleens and tumors of susceptible birds (Zhang et al., 2016, Qiu et al., 2018),
180
indicating that both mechanisms play an important role in avian cancer defenses. While in our
181
study, antitumor genes were not expressed in higher levels in birds living in a potentially
182
oncogenic environment, the role of increased expression of immune-related genes shown in
183
the same individuals (Watson et al., 2017) could act as a first line of defense against the
184
effects of oncogenic stressors. In accordance with life-history theory, in a short-lived animal
185
such as the great tit, selection should favor investment in physiological defenses that increase
186
short-term survival, at the expense of later-life performance and survival (Stearns, 2006).
187
Additionally, in other studies of the same population (but with larger sample size) reveal
9
increased antioxidant defenses (Salmón et al., 2018a, 2018b), shorter telomeres of developing
189
nestlings and selective disappearance of birds with short telomeres during their first year of
190
life (Salmón et al., 2016, 2017). Together, these results provide evidence that the present
191
urban environment is physiologically challenging and that only individuals with a “strong”
192
physiological response survive. However, whether this also protect the surviving urban birds
193
from developing cancer or if resources have been allocated to combat current physiological
194
threats rather than to more long-term anti-cancer defenses, requires further studies.
195
Unfortunately, we do not know the movements between the studied populations and their
196
surroundings. Thus, we cannot exclude that bird immigration influence the present findings
197
and thereby prevent local adaptation against the proliferation of neoplasia.
198
In any cases, given that lifespan of urban birds can be prolonged due to reduced predation
199
(Sepp et al., 2018), the lack of anti-cancer responses may be a greater cause of death in the
200
future than previously acknowledged.
201 202
While future studies should confirm our results with more tumor-suppressor genes (and thus
203
more anti-cancer mechanisms) examined and other tissues sampled (for example the kidney
204
due to its important contribution in detoxification or the spleen for its role in the production of
205
immune agents), our results suggest that wild birds do not up-regulate their anti-cancer
206
defenses in urban environments. As repeatedly suggested over the last few years (Thomas et
207
al. 2017, Vittecoq et al., 2018, Giraudeau et al., 2018, Sepp et al., 2019), this supports the idea
208
that wild animals living in human impacted habitats might be at higher risk of developing
209
oncogenic processes. An important methodological step allowing the detection of this
210
pathology in non-terminal samples is now urgently needed to confirm this hypothesis and
211
measure the potential unexplored consequences of pollution on wildlife cancer. Collaborative
212
projects between different fields (medicine, animal ecology, evolution) appear to be the
10
necessary approach to use the extensive knowledge accumulated in human oncology in order
214
to develop new cancer biomarkers usable with wild animals.
215
It is now admitted that oncogenic processes are widespread among metazoan species
216
with potential consequences on their life history strategies and, in some cases, on their
217
population dynamics as well as on ecosystem functioning. The worldwide modifications of
218
natural environments and in particular the release of mutagenic pollutants might exacerbate
219
this process, and wildlife neoplasia should thus be considered as an important player in the
220
reorganization of ecosystems currently happening under the pressure of human activities.
221 222 223
Data accessibility. All data are available in Dryad.
224
Authors’ contributions. H.W., C.I., T.S. and M.G. conceived and designed the study. C.I.
225
and H.W. performed post-mortems and H.W. isolated RNA. D.P. carried out the alignment
226
and generation of read counts. H.W. and O.V. carried out downstream analyses. M.G.
227
wrote the manuscript with input from all other authors. All authors gave final approval for
228
publication.
229
Competing interests. We declare we have no competing interests.
230
Funding. H.W. was funded by the European Union’s Horizon 2020 research and innovation
231
program under the Marie Skłodowska-Curie grant agreement no. 659643. C.I. was funded
232
by the Swedish Research Council VR (grant no. C0361301) and an EU Reintegration grant
233
(grant no. CIG 322217). F.T. is funded by the French ANR ANR-18-CE35-0009. T.S. was
234
funded by Estonian Research Council (IUT34-8). OV is supported by the Romanian
235
Ministry of Research and Innovation (PN-III-P4-ID-PCE-2016-0404) and by the János
236
Bolyai Research Scholarship of the Hungarian Academy of Sciences.
11
Acknowledgements. Many thanks to Pablo Salmón, Johan Nilsson and Amparo
Herrera-238
Duenas for assistance with capturing birds and performing post-mortems.
12 References
240
Aktipis, C.A., Boddy, A.M., Jansen, G., Hibner, U., Hochberg, M. E., Maley, C.C.,
241
Wilkinson, G.S., 2015. Cancer across the tree of life: cooperation and cheating in
242
multicellularity. Philosophical Transactions of the Royal Society B: Biological
243
Sciences, 370(1673), 20140219.
244
Bolger, A.M., Lohse, M., Usadel, B., 2014. Trimmomatic: a flexible trimmer for Illumina
245
sequence data. Bioinformatics 30(15), 2114-2120.
246
Caulin, A.F., Graham, T.A., Wang, L.S., Maley, C.C., 2015. Solutions to Peto's paradox
247
revealed by mathematical modelling and cross-species cancer gene analysis. Philosophical
248
Transactions of the Royal Society B: Biological Sciences 370(1673), 20140222.
249
Cohen, G., Steinberg, D.M., Levy, I., Chen, S., Kark, J.D., Levin, N., Witberg, G., Bental, T.,
250
Broday, D.M., Kornowski, R., Gerber, Y., 2019. Cancer and mortality in relation to
traffic-251
related air pollution among coronary patients: Using an ensemble of exposure estimates to
252
identify high-risk individuals. Environmental research 176, 108560.
253
Duffy, D.J., Schnitzler, C., Karpinski, L., Thomas, R., Whilde, J., Eastman, C., Yang, C.,
254
Krstic, A., Rollinson, D., Zirkelbach, B., Yetsko, K., Burkhalter, B., Martindale, M.Q.,
255
Yetsko, K., 2018. Sea turtle fibropapilloma tumors share genomic drivers and therapeutic
256
vulnerabilities with human cancers. Communications biology 1(1), 63.
257
Giraudeau, M., Sepp, T., Ujvari, B., Ewald, P.W., Thomas, F., 2018. Human activities might
258
influence oncogenic processes in wild animal populations. Nature ecology &
259
evolution 2(7), 1065.
260
Gorodetska, I., Lukiyanchuk, V., Peitzsch, C., Kozeretska, I., & Dubrovska, A., 2019.
261
BRCA1 and EZH2 cooperate in regulation of prostate cancer stem cell
262
phenotype. International journal of cancer. In press.
13
Kim, D., Langmead, B., Salzberg, S.L., 2015. HISAT: a fast spliced aligner with low memory
264
requirements. Nature methods 12(4), 357.
265
Kloog, I., Stevens, R.G., Haim, A., Portnov, B.A., 2010. Nighttime light level co-distributes
266
with breast cancer incidence worldwide. Cancer Causes & Control 21(12), 2059-2068.
267
Kolde, R. 2019. pheatmap: Pretty Heatmaps. R package version 1.0.12.
https://CRAN.R-268
project.org/package=pheatmap
269
Li, H., Handsaker, B., Wysoker, A., Fennell, T., Ruan, J., Homer, N., ... Durbin, R., 2009.
270
The sequence alignment/map format and SAMtools. Bioinformatics 25(16), 2078-2079.
271
Madsen, T., Arnal, A., Vittecoq, M., Bernex, F., Abadie, J., Labrut, S., ... & Roche, B., 2017.
272
Cancer prevalence and etiology in wild and captive animals. In Ecology and evolution of
273
cancer (pp. 11-46). Academic Press.
274
Martineau, D., De Guise, S., Fournier, M., Shugart, L., Girard, C., Lagace, A., & Beland, P.,
275
1994. Pathology and toxicology of beluga whales from the St. Lawrence Estuary, Quebec,
276
Canada. Past, present and future. Science of the Total Environment 154(2-3), 201-215.
277
Marzluff, J. M. (Ed.) (2008).Urban ecology: An international perspective on the interaction
278
between humans and nature. New York, NY, USA: Springer.
https://doi.org/10.1007/978-279
0-387-73412-5.
280
McAloose, D., Newton, A.L., 2009. Wildlife cancer: a conservation perspective. Nature
281
reviews cancer 9(7), 517.
282
Pertea, M., Pertea, G.M., Antonescu, C.M., Chang, T.C., Mendell, J.T., Salzberg, S.L., 2015.
283
StringTie enables improved reconstruction of a transcriptome from RNA-seq reads. Nature
284
biotechnology 33(3), 290.
285
Pertea, M., Kim, D., Pertea, G. M., Leek, J. T., & Salzberg, S. L., 2016. Transcript-level
286
expression analysis of RNA-seq experiments with HISAT, StringTie and Ballgown. Nature
287
protocols 11(9), 1650.
14
Pesavento, P.A., Agnew, D., Keel, M.K., Woolard, K.D. 2018. Cancer in wildlife: patterns of
289
emergence. Nature Reviews Cancer 1.
290
Qiu, L, Chang, G., Li, Z., Bi, Y., Liu, X., Chen, G., 2018. Comprehensive Transcriptome
291
Analysis Reveals Competing Endogenous RNA Networks During Avian Leukosis Virus,
292
Subgroup J-Induced Tumorigenesis in Chickens. Front Physiol. 9:996.
293
R Core Team 2018. R: A language and environment for statistical computing. R Foundation
294
for Statistical Computing, Vienna, Austria. URL https://www.R-project.org/.
295
Robinson, M.D., McCarthy, D.J., Smyth, G.K., 2010. edgeR: a Bioconductor package for
296
differential expression analysis of digital gene expression data. Bioinformatics 26,
139-297
140.
298
Salmón, P., Nilsson, J., Nord, A., Bensch, S., Isaksson, C., 2016. Urban environment shortens
299
telomere length in nestling great tits, Parus major. Biology Letters 12,20160155.
300
Salmón, P., Nilsson, J.F., Watson, H., Bensch, S., Isaksson, C., 2017. Selective disappearance
301
of great tits with short telomeres in urban areas. Proc. R. Soc. Lond. B. 284,20171349.
302
Salmón, P., Stroh, E., Herrera-Dueñas, A., von Post, M., Isaksson, C., 2018a. Oxidative stress
303
in birds along a NOx and urbanisation gradient: an interspecific approach. Science of the
304
Total Environment 622–623,635–643.
305
Salmón, P., Watson, H., Nord, A., Isaksson, C., 2018b. Effects of the Urban Environment on
306
Oxidative Stress in Early Life: Insights from a Cross-fostering Experiment. Integrative and
307
Comparative Biology 58,986-994.
308
Sepp, T., McGraw, K. J., Kaasik, A., Giraudeau, M., 2018. A review of urban impacts on
309
avian life‐ history evolution: Does city living lead to slower pace of life? Global change
310
biology 24(4),1452-1469.
15
Sepp, T., Ujvari, B., Ewald, P.W., Thomas, F., Giraudeau, M., 2019. Urban environment and
312
cancer in wildlife: available evidence and future research avenues. Proceedings of the
313
Royal Society B 286(1894),20182434.
314
Sironi, G., Manarolla, G., Pisoni, G., Recordati, C., Rampin, T.J., 2006. Myotropic avian
315
leukosis virus subgroup J infection in a chicken. Vet Med B Infect Dis Vet Public Health.
316
53(7),347-9.
317
Thomas, F., Jacqueline, C., Tissot, T., Henard, M., Blanchet, S., Loot, G., ...Beckmann,
318
C., 2017. Malignant cells, an underappreciated component of animal evolutionary ecology.
319
Nat. Ecol. Evol. 1,1592–1595.
320
Ujvari, B., Hamede, R., Peck, S., Pemberton, D., Jones, M., Belov, K., Madsen, T., 2016.
321
Immunoglubolin dynamics and cancer prevalence in Tasmanian devils (Sarcophilus
322
harrisii). Scientific reports 6,25093.
323
Vittecoq, M., Roche, B., Daoust, S. P., Ducasse, H., Missé, D., Abadie, J., ... Thomas, F.,
324
2013. Cancer: a missing link in ecosystem functioning? Trends in ecology &
325
evolution, 28(11),628-635.
326
Vittecoq, M., Giraudeau, M., Sepp, T., Marcogliese, D., Klaassen, M., Ujvari, B., Thomas, F.,
327
2018. Turning natural adaptations to oncogenic factors into an ally in the war against
328
cancer. Evolutionary Applications 11(6),836-844. 329
Watson, H., Videvall, E., Andersson, M.N., Isaksson, C. 2017. Transcriptome analysis of a
330
wild bird reveals physiological responses to the urban environment. Scientific
331
reports 7,44180.
332
White, M.C., Holman, D.M., Boehm, J.E., Peipins, L.A., Grossman, M., Henley, S.J., 2014.
333
Age and cancer risk: a potentially modifiable relationship. Am. J. Prev. Med. 46,7–15.
16
Zhang, X., Yan, Z., Li, X., Lin, W., Dai, Z., Yan, Y., ... Ma, J.,2016. GADD45β, an
anti-335
tumor gene, inhibits avian leukosis virus subgroup J replication in chickens. Oncotarget.
336
7(42),68883–68893.
17
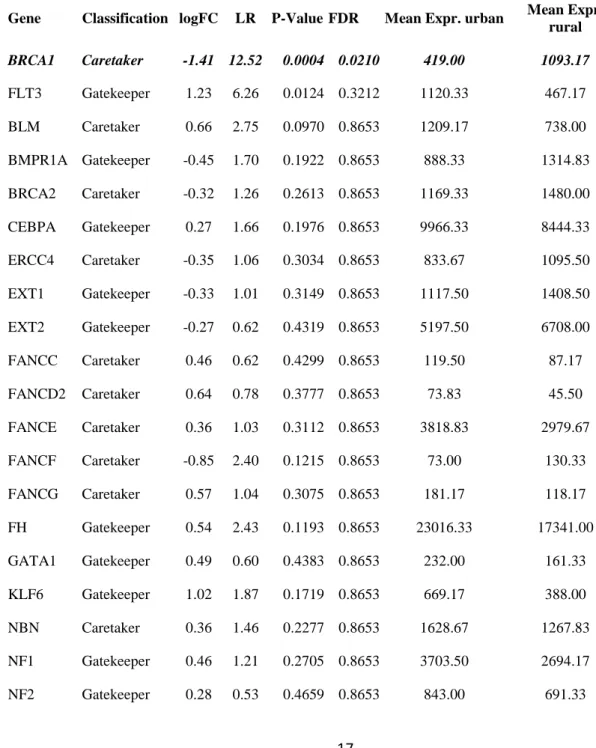
Table 1 Results of differential expression analyses of tumor suppressor genes in liver (A) and blood 338
(B) tissues of urban and rural great tits. LogFC = log2 fold-change (negative values indicate higehr 339
expression in rural birds), LogCPM = average log counts per million; LR = likelihood ratio statistic; P-340
value = unadjusted P value; FDR = false discovery rate, Mean Expr. = average expression level in 341
urban and rural birds respectively. Genes with missing data were either not included in the annotated 342
gene set or had no mapped reads. Genes marked in italics are differentially expressed following p-343
value adjustment. 344
Table 1A. 345
Gene Classification logFC LR P-ValueFDR Mean Expr. urban Mean Expr. rural BRCA1 Caretaker -1.41 12.52 0.0004 0.0210 419.00 1093.17 FLT3 Gatekeeper 1.23 6.26 0.0124 0.3212 1120.33 467.17 BLM Caretaker 0.66 2.75 0.0970 0.8653 1209.17 738.00 BMPR1A Gatekeeper -0.45 1.70 0.1922 0.8653 888.33 1314.83 BRCA2 Caretaker -0.32 1.26 0.2613 0.8653 1169.33 1480.00 CEBPA Gatekeeper 0.27 1.66 0.1976 0.8653 9966.33 8444.33 ERCC4 Caretaker -0.35 1.06 0.3034 0.8653 833.67 1095.50 EXT1 Gatekeeper -0.33 1.01 0.3149 0.8653 1117.50 1408.50 EXT2 Gatekeeper -0.27 0.62 0.4319 0.8653 5197.50 6708.00 FANCC Caretaker 0.46 0.62 0.4299 0.8653 119.50 87.17 FANCD2 Caretaker 0.64 0.78 0.3777 0.8653 73.83 45.50 FANCE Caretaker 0.36 1.03 0.3112 0.8653 3818.83 2979.67 FANCF Caretaker -0.85 2.40 0.1215 0.8653 73.00 130.33 FANCG Caretaker 0.57 1.04 0.3075 0.8653 181.17 118.17 FH Gatekeeper 0.54 2.43 0.1193 0.8653 23016.33 17341.00 GATA1 Gatekeeper 0.49 0.60 0.4383 0.8653 232.00 161.33 KLF6 Gatekeeper 1.02 1.87 0.1719 0.8653 669.17 388.00 NBN Caretaker 0.36 1.46 0.2277 0.8653 1628.67 1267.83 NF1 Gatekeeper 0.46 1.21 0.2705 0.8653 3703.50 2694.17 NF2 Gatekeeper 0.28 0.53 0.4659 0.8653 843.00 691.33
18 PMS1 Caretaker -0.32 0.93 0.3344 0.8653 2027.33 2692.83 PTEN Gatekeeper 0.20 0.56 0.4552 0.8653 5434.83 4997.67 SDHB Gatekeeper 0.22 0.82 0.3645 0.8653 3362.33 3018.67 SMARCB 1 Gatekeeper 0.27 1.11 0.2926 0.8653 1986.17 1667.00 VHL Gatekeeper -0.20 0.56 0.4533 0.8653 5943.50 7199.83 WRN Caretaker 0.34 1.44 0.2309 0.8653 1692.00 1330.17 XPA Caretaker -0.32 2.08 0.1496 0.8653 8957.50 11491.33 XPC Caretaker -0.16 0.63 0.4276 0.8653 3895.00 4426.50 APC Gatekeeper 0.08 0.06 0.8040 0.9162 1400.00 1349.33 ATM Caretaker -0.18 0.43 0.5140 0.9162 1556.50 1802.17 CDH1 Gatekeeper 0.06 0.08 0.7805 0.9162 13177.50 13069.50 CHEK2 Caretaker 0.06 0.03 0.8709 0.9162 494.00 465.17 CYLD Gatekeeper 0.09 0.16 0.6876 0.9162 2308.67 2173.00 DDB2 Caretaker -0.08 0.02 0.8810 0.9162 406.33 414.67 ERCC3 Caretaker 0.06 0.07 0.7890 0.9162 2242.33 2166.33 FANCA Caretaker 0.25 0.09 0.7669 0.9162 64.17 51.33 FLT4 Gatekeeper -0.10 0.10 0.7541 0.9162 869.33 967.00 HNF1A Gatekeeper 0.04 0.03 0.8615 0.9162 2428.00 2390.00 MAP2K4 Gatekeeper -0.13 0.22 0.6419 0.9162 2903.00 3309.50 MEN1 Gatekeeper 0.21 0.33 0.5678 0.9162 624.83 527.67 MLH1 Caretaker 0.06 0.05 0.8229 0.9162 2089.33 2006.83 MSH2 Caretaker 0.19 0.37 0.5411 0.9162 721.33 651.00 MSH6 Caretaker -0.06 0.02 0.8777 0.9162 238.17 245.67 MUTYH Caretaker -0.11 0.05 0.8156 0.9162 358.00 385.33 PMS2 Caretaker -0.10 0.08 0.7726 0.9162 763.50 829.67 RB1 Gatekeeper -0.14 0.16 0.6870 0.9162 4156.17 5007.67 SBDS Gatekeeper -0.12 0.21 0.6497 0.9162 3361.67 3856.17 SDHD Gatekeeper -0.13 0.31 0.5776 0.9162 19594.17 22325.83 SMAD4 Gatekeeper 0.34 0.15 0.6981 0.9162 123.67 96.17 STK11 Gatekeeper 0.24 0.23 0.6342 0.9162 775.17 637.00
19 GPC3 Gatekeeper -0.01 0.00 0.9865 0.9865 120.67 123.33 SUFU Gatekeeper -0.01 0.00 0.9708 0.9865 1089.17 1097.50 CDKN2A Gatekeeper NA NA NA NA NA NA ERCC2 Caretaker NA NA NA NA NA NA ERCC5 Caretaker NA NA NA NA NA NA PHOX2B Gatekeeper NA NA NA NA 0.00 0.00 RECQL4 Caretaker NA NA NA NA NA NA SDHC Gatekeeper NA NA NA NA NA NA TP53 Caretaker NA NA NA NA NA NA 346 Table 1B 347 348
Row.names Classification logFC LR P-Value FDR Mean Expr. urban Mean Expr. rural KLF6 Gatekeeper 1.32 6.83 0.0090 0.4573 7514.83 2699.00 ATM Caretaker 0.54 1.63 0.2023 0.7723 326.00 199.20 CDH1 Gatekeeper -2.21 3.86 0.0494 0.7723 74.67 347.40 CYLD Gatekeeper 0.67 3.01 0.0826 0.7723 1027.33 569.40 ERCC4 Caretaker 0.64 2.16 0.1419 0.7723 219.17 121.60 EXT1 Gatekeeper 1.12 2.83 0.0926 0.7723 139.00 50.80 FANCA Caretaker 1.12 1.46 0.2272 0.7723 14.33 5.40 FANCC Caretaker 1.42 1.73 0.1882 0.7723 14.00 5.00 FH Gatekeeper -0.63 2.33 0.1266 0.7723 880.17 1324.80 FLT4 Gatekeeper 0.86 2.55 0.1103 0.7723 140.17 69.60 HNF1A Gatekeeper -0.61 2.52 0.1127 0.7723 249.50 364.40 MSH2 Caretaker 1.00 1.85 0.1742 0.7723 77.83 36.60 MSH6 Caretaker 0.74 1.54 0.2140 0.7723 33.67 17.80 NBN Caretaker 0.53 1.96 0.1615 0.7723 484.00 291.60 PMS2 Caretaker 0.69 2.45 0.1178 0.7723 297.50 156.00 CHEK2 Caretaker 0.47 1.31 0.2525 0.8048 567.17 354.40 FANCF Caretaker -0.78 1.20 0.2738 0.8214 9.00 15.40 APC Gatekeeper 0.33 0.99 0.3208 0.8739 3033.00 2056.40
20 BMPR1A Gatekeeper -0.68 0.88 0.3483 0.8739 26.33 42.40 BRCA2 Caretaker 0.35 0.80 0.3708 0.8739 528.33 351.80 CEBPA Gatekeeper -0.41 0.66 0.4158 0.8739 269.67 336.00 FANCE Caretaker 0.37 0.61 0.4355 0.8739 4627.17 3468.40 FANCG Caretaker 0.27 0.51 0.4768 0.8739 907.50 741.80 GATA1 Gatekeeper -0.20 0.43 0.5140 0.8739 17552.17 19833.20 MAP2K4 Gatekeeper 0.29 0.46 0.4987 0.8739 1504.67 1278.60 MLH1 Caretaker 0.36 0.57 0.4509 0.8739 567.50 411.20 NF1 Gatekeeper -0.31 0.64 0.4237 0.8739 4124.83 4798.00 SMAD4 Gatekeeper -0.45 0.77 0.3791 0.8739 344.83 436.40 STK11 Gatekeeper -0.22 0.45 0.5003 0.8739 3353.00 3806.20 SUFU Gatekeeper -0.30 0.94 0.3315 0.8739 4010.83 4664.80 BLM Caretaker -0.16 0.22 0.6378 0.9393 5363.17 5824.00 ERCC3 Caretaker 0.15 0.28 0.5984 0.9393 4039.00 3470.40 FANCD2 Caretaker -0.25 0.21 0.6499 0.9393 183.83 211.00 FLT3 Gatekeeper 0.27 0.19 0.6630 0.9393 58.67 45.00 SDHB Gatekeeper 0.17 0.21 0.6470 0.9393 625.67 542.60 XPA Caretaker 0.12 0.22 0.6389 0.9393 9170.33 7879.60 BRCA1 Caretaker -0.19 0.14 0.7048 0.9715 121.50 121.00 DDB2 Caretaker -0.05 0.01 0.9048 0.9950 471.00 439.00 EXT2 Gatekeeper 0.08 0.05 0.8291 0.9950 1278.83 1063.60 MEN1 Gatekeeper 0.07 0.02 0.8870 0.9950 191.50 158.20 MUTYH Caretaker 0.06 0.01 0.9130 0.9950 88.00 71.60 NF2 Gatekeeper 0.15 0.11 0.7420 0.9950 169.83 134.60 PMS1 Caretaker -0.04 0.01 0.9231 0.9950 274.50 252.40 PTEN Gatekeeper -0.07 0.07 0.7928 0.9950 4607.33 4593.00 RB1 Gatekeeper 0.02 0.01 0.9400 0.9950 9445.00 8756.80 SBDS Gatekeeper 0.00 0.00 0.9950 0.9950 6287.00 6347.20 SDHD Gatekeeper 0.06 0.03 0.8650 0.9950 4422.50 4121.80
21 SMARCB1 Gatekeeper -0.01 0.00 0.9715 0.9950 1879.50 1788.80 VHL Gatekeeper 0.06 0.05 0.8214 0.9950 8967.33 8265.60 WRN Caretaker 0.06 0.04 0.8475 0.9950 2787.67 2467.40 XPC Caretaker -0.01 0.00 0.9757 0.9950 2009.33 1908.40 CDKN2A Gatekeeper NA NA NA NA NA NA ERCC2 Caretaker NA NA NA NA NA NA ERCC5 Caretaker NA NA NA NA NA NA GPC3 Gatekeeper NA NA NA NA 0.00 1.60 PHOX2B Gatekeeper NA NA NA NA 0.00 0.00 RECQL4 Caretaker NA NA NA NA NA NA SDHC Gatekeeper NA NA NA NA NA NA TP53 Caretaker NA NA NA NA NA NA 349