HAL Id: hal-03213910
https://hal.archives-ouvertes.fr/hal-03213910
Submitted on 30 Apr 2021
HAL is a multi-disciplinary open access
archive for the deposit and dissemination of
sci-entific research documents, whether they are
pub-lished or not. The documents may come from
teaching and research institutions in France or
abroad, or from public or private research centers.
L’archive ouverte pluridisciplinaire HAL, est
destinée au dépôt et à la diffusion de documents
scientifiques de niveau recherche, publiés ou non,
émanant des établissements d’enseignement et de
recherche français ou étrangers, des laboratoires
publics ou privés.
Brain lateralization probed by water diffusion at the
atomic to micrometric scale
F Natali, C Dolce, J Peters, C Stelletta, B Demé, J Ollivier, G Leduc, A
Cupane, E Barbier
To cite this version:
F Natali, C Dolce, J Peters, C Stelletta, B Demé, et al.. Brain lateralization probed by water diffusion
at the atomic to micrometric scale. Scientific Reports, Nature Publishing Group, 2019, 9, pp.14694.
�10.1038/s41598-019-51022-1�. �hal-03213910�
Brain lateralization probed by
water diffusion at the atomic to
micrometric scale
f. natali
1,2, C. Dolce
1,3,4, J. Peters
1,3, C. Stelletta
5, B. Demé
1, J. ollivier
1, G. Leduc
6,
A. Cupane
4& e. L. Barbier
7Combined neutron scattering and diffusion nuclear magnetic resonance experiments have been used to reveal significant interregional asymmetries (lateralization) in bovine brain hemispheres in terms of myelin arrangement and water dynamics at micron to atomic scales. Thicker myelin sheaths were found in the left hemisphere using neutron diffraction. 4.7 T dMRI and quasi-elastic neutron experiments highlighted significant differences in the properties of water dynamics in the two hemispheres. The results were interpreted in terms of hemisphere-dependent cellular composition (number of neurons, cell distribution, etc.) as well as specificity of neurological functions (such as preferential networking).
An important topic in the study of the neural basis of brain functions is the interregional asymmetry between the left and the right hemisphere and its relation to the factors that modulate cognitive specialization in the brain, such as language and motor control. The specialization of the two hemispheres is termed lateralization.
The central nervous system (CNS) comprises the brain (cerebrum and cerebellum) and the spinal cord1. The brain contains neurons that receive, analyze and store information. It is also the source of conscious and uncon-scious thoughts and behaviors. The cerebrum is one of the most important parts of the brain; it controls emotion, hearing, vision, personality, amongst other things. The cerebrum, which accounts for 85% of total brain weight, is divided into left and right hemispheres. The hemispheres communicate with each other through the corpus callosum (a bundle of fibers between the hemispheres). Of particular interest is the modularity of the hemi-spheres, which allows one hemisphere to take over a specific function controlled by the other hemisphere if the latter is damaged. It should be noted, however, that this ability depends on the area damaged and the patient’s age. Generally speaking, the left hemisphere controls the right side of the body and vice versa. Typically, in humans, the left hemisphere handles linear reasoning and language functions, such as vocabulary and grammar, while the right hemisphere accounts for different language functions, such as intonation and accentuations, as well as for the processing of visual and audiological stimuli, spatial manipulation, facial perception, and artistic ability2–4. Other integrative functions, including arithmetic, sound localization and emotions, seem to be controlled more bilaterally5,6.
The networks in the human right hemisphere are anatomically more efficient and interconnected than those in the left hemisphere7. In terms of functional principles, these patterns appear to support the fact that the left hem-isphere plays a leading role in highly demanding specific processes, such as language and motor actions, which may require specialized networks, whereas the right hemisphere is responsible for more general processes, such as integration tasks, which may require a more general level of interconnection. The connectivity of a given region is related to its cellular characteristics, such as cell size and number of neurons. Asymmetries in terms of cell size and density, regional volumes and the structure of dendrites have been reported by several authors8–11. The ratio of the volume of grey to white matter in cerebral hemispheres is 1:3 in young individuals and varies slightly and non-linearly with age (1:1 and 1:5 at 50 and 100 years old, respectively)12. In particular, the hemispheres
1Institut Laue-Langevin, 71 avenue des Martyrs, CS 20156, 38042, Grenoble cedex 9, France. 2CNR-IOM, OGG,
71 avenue des Martyrs, CS 20156, 38042, Grenoble cedex 9, France. 3University Grenoble Alpes, LiPhy, 140
rue de la physique, 38402, Saint Martin d’Hères, France. 4Department of Physics and Chemistry, University of
Palermo, via Archirafi 36, 90123, Palermo, Italy. 5Department of Animal Med., Production and Health, University
of Padova, Viale dell’Università 16, 35020, Agripolis, Legnaro, Italy. 6Biomedical Facility, ESRF, 71 avenue des
Martyrs, CS 20156, 38042, Grenoble cedex 9, France. 7University Grenoble Alpes, Inserm, U1216, Grenoble Institut
Neurosciences, 38000, Grenoble, France. Correspondence and requests for materials should be addressed to F.N. (email: [email protected])
Received: 17 April 2019 Accepted: 23 September 2019 Published: xx xx xxxx
www.nature.com/scientificreports
www.nature.com/scientificreports/
differ in the number of neurons they contain: the left hemisphere has 186 million more neurons than the right hemisphere13–15.
Neuroimaging studies have suggested that asymmetries in water diffusivity in the brain may exist16,17. This asymmetry could be due to either a greater neuronal attenuation or a greater number of reciprocal connections with neighboring brain regions on the side with reduced diffusivity. Variations in water diffusivity in different areas of the brain change with age and with gender. Estrogens may affect diffusivity; they have been found to influence cerebral water diffusion by accelerating myelination in the immature rat brain18.
In this paper, we investigate the water dynamics in post-mortem sections of the right (RH) and left (LH) cer-ebral hemispheres of bovine specimens. The study takes advantage of the unique combination of the high water content of brain tissue (up to 80% in weight) and the power of neutron scattering to investigate water dynamics at the atomic scale19,20, thus extending the diffusion length-scales explored by the diffusion nuclear magnetic reso-nance (dMRI) technique and providing complementary information. In this way, we shed light on specific differ-ences of the hemispheres which could at least partially be responsible for the various functions mentioned above.
Results
Interregional asymmetry in myelin structure.
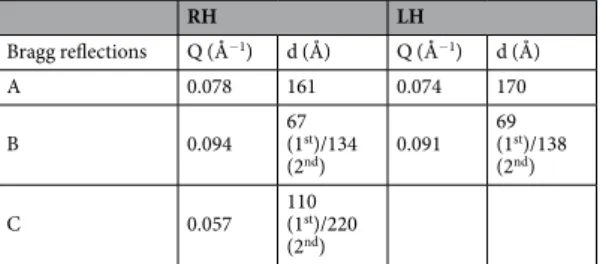
In Fig. 1a, we present the neutron diffraction patterns of RH and LH specimens measured at 27 °C on the diffractometer D16 at the Institut Laue-Langevin (ILL) in Grenoble, France. Table 1 lists the d-spacing of the observed diffraction peaks (d). Diffraction peaks can be seen at Q = 0.078 Å−1 (A1) for RH and Q = 0.074 Å−1 (A2) for LH that correspond to the second order Bragg reflections
of ordered multilamellar structures of the myelin sheath, with repeat distances of d1 = 161 Å (RH) and d2 = 170 Å
(LH). These results are in agreement with previous findings21–26 from extracted myelin fibers. The first order Bragg peak is extinct by the form factor.
The arrows at B1 and B2 show the unresolved 1st or 2nd order Bragg peaks at Q = 0.092 Å−1 (d1st = 134 Å,
d2nd = 67 Å) for RH and Q = 0.091 Å−1 (d1st = 138 Å, d2nd = 69 Å) for LH. The shift in the position of the Bragg
reflections suggests different myelin arrangements in RH hemispheres compared to LH hemispheres, with a non-negligible change in the sheath thickness (9 Å). Moreover, an additional reflection is revealed in the
Figure 1. Panel a: Diffraction patterns obtained for the RH (black symbols) and LH (gray symbols) at 300 K
measured on D16 at ILL. Second order Bragg peaks are found at A1 = 0.078 Å−1 (RH) and A2 = 0.074 Å−1 (LH).
B1 and B2 represent less pronounced first (1st) or second (2nd) order Bragg peaks at Q = 0.093 Å−1 (RH) and
Q = 0.088 Å−1 (LH). Additional reflection (C
1) is observed in LH at Q = 0.057 Å−1. Panel b: Sketch of a myelin
diffraction pattern of LH (C1) at Q = Q = 0.057 Å−1 corresponding to a periodicity of d1st/2nd = 110/220 Å. The
origin of peaks B and C is not clear to date and more experiments need to be performed for this; thus they are not further treated in the present work. Figure 1b presents a sketch of the sheath arrangement.
Interregional asymmetry in water dynamics at the micron to atomic scale.
a) Micron scale. Inconventional dMRI, the signal intensity, SI(b), in a free medium, is27: = −
SI b( ) SI e0 bADC (1) where b is the diffusion weighting factor, SI0 is the signal intensity at b = 0, and ADC is the apparent diffusion
coefficient. The parameter b is linked to the magnitude of the applied diffusion gradient pulses, the duration of the pulses and the diffusion time.
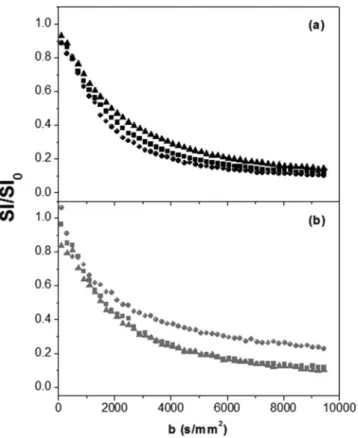
The signal decay SI (b) averaged (arithmetic mean) over the three orthogonal directions (x, y and z) is shown in Fig. 2, for RH and LH. For comparison, the signal of deionized water (Milli-Q) characteristic for pure water behavior is also reported, which suggests that a substantial fraction of the water in the brain has diffusive proper-ties that are altered by the macromolecular environment.
We observe for RH and LH that the signal deviates from a mono-exponential decay, as would have been expected in an unrestricted and homogeneous medium with a single water population (represented here by the free water signal). Indeed water diffusion in the brain is not a free random walk process, but hindered by the crowded environment. We recently published a paper showing that the dMRI signal decay is better fitted by a double exponential, since the mono-exponential decay only fits in the low b-region, where the signal is less sen-sitive to confinement effects28.
We fit the data to the following expression for the double exponential function29–31:
= − + − −
SI b
SI f e f e
( )
(0) slow D bslow (1 slow) Dfastb (2) where ffast = (1 – fslow) and fslow represent the relative fractions of the fast and slow contributions to the total signal
intensity with the associated fast (Dfast) and slow (Dslow) diffusion coefficients. The fit parameters are given in
Table 2. A clear difference between diffusion coefficients is not found between the two hemispheres. However, the double-exponential analysis highlights the existence of different distributions of water populations in the two hemispheres: in LH the percentage of restricted water component (fslow) is greater compared to RH.
RH LH Bragg reflections Q (Å−1) d (Å) Q (Å−1) d (Å) A 0.078 161 0.074 170 B 0.094 67 (1st)/134 (2nd) 0.091 69 (1st)/138 (2nd) C 0.057 110 (1st)/220 (2nd)
Table 1. Position of the Bragg reflections of RH and LH and associated repeat distances.
Figure 2. dMRI signal decay of RH (black symbols) and LH (gray symbols) averaged over the three orthogonal
directions; for comparison, the averaged signal decay of free water (deionized water Milli-Q, open symbols) is also shown.
www.nature.com/scientificreports
www.nature.com/scientificreports/
Anisotropy
.
In Fig. 3, we present the dependence of the water signal on b measured with dMRI for the three orthogonal directions.In the two samples, the water diffusion is clearly anisotropic, particularly in LH, in which one dimension (y) shows more restriction. The corresponding diffusion coefficients are reported in Table 3, where the fslow
percent-age of LH(y) appears almost three times higher than that of RH(y).
b) Atomic scale
.
In Fig. 4, we present the normalized incoherent quasi-elastic neutron scattering (QENS) spec-tra of RH and LH measured on IN5 as a function of the energy spec-transfer, obtained by binning over the whole range of Q (0.33–0.96 Å−1). Data at Q ≤ 0.26 Å−1 were not included in the analysis because of the existence of Braggfslow Dfast Dslow
RH 0.241 ± 0.007 0.610 ± 0.008 0.078 ± 0.003
LH 0.32 ± 0.01 0.62 ± 0.02 0.083 ± 0.004
Table 2. Fitting parameters evaluated from the dMRI data using the bi-exponential model. Dfast and Dslow are
the fast and slow diffusion coefficients and fslow (with ffast = 1- fslow) the fraction of the slow water pool. Units for
Dfast and Dslow are expressed in [10−5 cm2/s].
Figure 3. dMRI signal decay of RH (panel a) and LH (panel b) normalized to signal decay at b = 0.5 s.mm−2, for
three orthogonal directions (x: squares, y: circles and z: triangles).
fslow Dfast Dslow
RH X 0.230 ± 0.006 0.605 ± 0.005 0.077 ± 0.003 Y 0.17 ± 0.02 0.64 ± 0.02 0.055 ± 0.001 Z 0.34 ± 0.01 0.59 ± 0.01 0.097 ± 0.004 LH X 0.16 ± 0.03 0.51 ± 0.02 0.042 ± 0.002 Y 0.46 ± 0.02 0.71 ± 0.03 0.074 ± 0.006 Z 0.39 ± 0.04 0.77 ± 0.05 0.15 ± 0.01
Table 3. Fitting parameters evaluated from the dMRI data using the bi-exponential model as a function of the
direction (x, y and z). Dfast and Dslow are the fast and slow diffusion coefficients and fslow (with ffast = 1 − fslow) the
peaks, as observed in the diffraction patterns reported in Fig. 1. In Fig. 4, an example of RH and LH QENS-fitted spectra at reference values of Q (Q = 0.40 Å−1 and 0.91 Å−1) is presented. For completeness, the instrumental
energy resolution function is also shown. A broadening of the elastic peak can be observed, suggesting motion falling within the time scale accessible using IN5 (~100 ps). From the average composition of the RH and LH tissues (84% and 83% of water percentage in mass for LH and RH, respectively, as experimentally estimated as the mass change before and after drying the tissue), the incoherent scattering signal arising from the water has been theoretically estimated to be ~80% of the total intensity. Therefore, the main contribution to the QENS spectra is ascribed to water diffusion.
The Q-dependent QENS data were fitted using an equation which takes into account free and restricted water dynamics described in terms of a model based on the coupling between translational (T) and rotational (R) motions32. The translational model used is the jump diffusion model33 in which the diffusion is assumed to occur via infinitely small, elementary jumps characterized by a negligible jump time τj during which the particle diffuses
and the residence time τ, i.e. the time a proton spends in a given position. The rotational model used is the contin-uous rotational diffusion on a circle34 describing the reorientation motion of a molecule, which rotates randomly on a spherical surface. An exhaustive description of the model and its application to the study of water dynamics in cells and tissues is reported in19,20,28,35. The fit function reads:
ω δ ω ω τ ω τ ω Γ ω ≈ + + + ⊗ ⁎ ⁎ ⁎ ⁎
(
)
S Q f p S Q D D p S Q D D p S Q Q R Q ( , ) ( ) , , , , ( , , , , ) ( , , ( )) ( , ) (3)fast fast Tfast fast Rfast slow slow Tslow slow Rslow
CH2 CH2 CH2
where f is the elastic fraction, describing protons contributing only through atomic vibrations and whose center of mass appears stationary within the instrumental resolution, R(Q, ω) measured with a standard vanadium. δ(ω) is the Dirac delta function; Sfast(Q, ω) and Sslow(Q, ω) are the total scattering intensities arising from the bulk-like
(fast) and restricted (slow) diffusive water populations, respectively. DTfast/slow and DRfast/slow are translational and
rotational diffusion coefficients, and τfast/slow are the residence times. SCH2(Q, ω) is an additional term assigned to
2-site jump rotational motion (described by a large and Q independent Lorentzian of width ΓCH2) for the CH2
groups belonging to proteins and other cellular components and accounting for ~10% of the total signal. pfast,
pslow and pCH2 are the fractions of atoms experiencing the three different dynamics, with f + pCH2 + pfast + pslow = 1.
The broadening of the Lorentzian scattering contributions (Γfast/slow) while obeying the relation:
Γ ∝ + τ D Q 1 D Q (4) fast/slow Tfast/slow 2 fast/slow Tfast/slow 2
for the translational motion, is Q independent in the framework of the rotational one.
The measured spectra, in the Q-range from 0.33 to 0.96 Å−1, were fitted simultaneously from −3.0 to
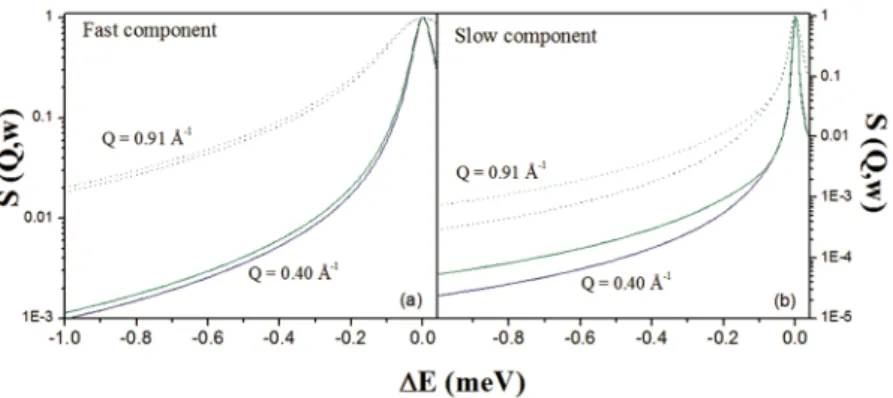
+0.1 meV using a global fit strategy. The different scattering contributions, convoluted with instrumental resolu-tion, are shown. The agreement between experimental data (symbols) and theory (solid line) in Fig. 5 is excellent. Best-fit parameter values are reported in Table 4. It is clear that the main difference in terms of water dynamics in the two hemispheres lies in the diffusion of the restricted water pool. Both translational and rotational diffusions seem to be affected, as demonstrated by the changes in the residence time of the translational contribution and the rotational diffusion constants. For a direct comparison, in Fig. 6 the fast/slow components of RH and LH (convolution of translational and rotational diffusion with the instrumental resolution function) are shown. In
Figure 4. Q-binned QENS intensities measured on IN5 of RH (green) and LH (blue) at 300 K. For
www.nature.com/scientificreports
www.nature.com/scientificreports/
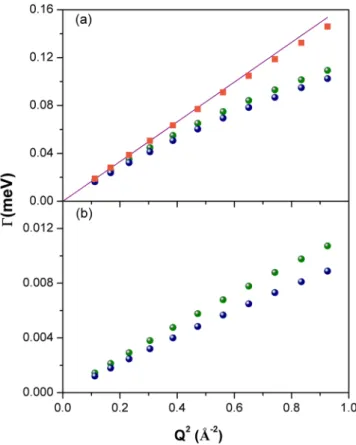
Fig. 7, we report the variation of the line-width of the translational diffusive contribution as a function of Q2, at
room temperature. Fick’s law function, describing a bulk-free Gaussian-like diffusion process, is also reported and, as expected, it properly fits the pure water data. For the two samples, after a linear variation in the low Q region (the translational diffusion coefficient is derived from the slope at small Q), the data deviate from Fick’s law, tending asymptotically to a constant value 1/τfast/slow (jump-diffusion model), with τfast/slow the residence time.
The deviation at high Q from pure long-range diffusion is a sign of partial restriction, from which a non-zero residence time (the time that a proton spends in a given position) suggests the interaction of water molecules with the cellular components. This deviation from the theoretical behavior is the indication of non-Gaussian diffusion. The plateau becomes visible in the “free” water component (Q2 » 1/ Dτ and 1/D
fastτfast ~ 2 Å−2), but this
is less pronounced in the restricted water component (1/Dslowτslow ~ 8 Å−2) even though a small deviation from
Fick’s law is already noticeable. Again, the RH Γ values lie above the LH ones due to less restriction in this sample.
Discussion
Lateralized behaviors (e.g. limb or eye preference) have been observed in a wide range of species, including dairy cows36,37. In humans, it is well accepted that there are several lateralization axes in the brain (symbolic communi-cation, perception/action, emotion…)38. Moreover, lateralization abnormalities have been observed in patients with schizophrenia and bipolar disorders39.
Using electron microscopy, differences in the axonal diameter and in the thickness of myelin sheath of the cortical white matter were observed in humans and macaque40. These differences lead to change in conductivity between left and right hemispheres. The benefit of such difference is not clear yet, but it has recently been pro-posed that it could lead a hemispheric dominance associated to a reduced inter-hemispheric communication and thereby improve processing time of lateralized functions38.
Therefore, lateralization seems to have important effects on the correct functioning of the brain, although studies of it are still scarce. The powerful combination of complementary dMRI and QENS experiments on RH and LH allows to investigate variations at the molecular dynamics’ level to reveal the non-Gaussian behavior of water dynamics at both micron and atomic scales. In particular, two different water components are characterized and quantified: a population of water hindered by macromolecular surfaces and not freely diffusing, and another population with a behavior similar to free water. In particular, the QENS analysis reveals that a major fraction (86% ± 1% for RH and 84% ± 2% for LH, percentage relative to total water) demonstrates fast dynamical proper-ties similar to those of bulk water, and a minor fraction (14% ± 3% RH and 16% ± 4% LH) displays significantly slower dynamics. There is no significant difference between the percentages of free and restricted components in the two hemispheres, suggesting comparable samples.
For the bulk-like water contribution, translational diffusion coefficients for the two samples are found to be similar to those of bulk water (2.5 ± 0.1 ·10−5 cm2/s in RH and 2.3 ± 0.1 * 10−5 cm2/s in LH; 2.3 ÷ 2.5 * 10−5 cm2/s
bulk water)36 but with higher residence times for proton jump diffusion (1.8 ps in RH and 1.8 ps in LH, 0.90-1.1 ps in bulk water). The higher residence times may reflect the longer times spent by the protons interacting with heterogeneities in the internal cerebral structure. This is in agreement with findings that have been observed in
Escherichia coli (E. coli)41,42, and red blood cells (RBC)43, prokaryotes44 and lipoproteins45. In particular, the higher residence times observed in E. coli and RBC have been interpreted by suggesting that water molecules spend
Figure 5. Example of QENS spectra of RH (green) and LH (blue) samples at Q = 0.40 Å−1 and Q = 0.91 Å−1
measured on IN5 at 300 K. The different scattering contributions, convoluted with instrumental resolution, are shown: experimental data (symbols), total fit (gray), elastic peak (orange), broad Lorentzian SCH2(Q, ω) (blue),
longer times in the first hydration shell of macromolecular structures than in the bulk phase. Jasnin et al. found moreover that a higher residence time is related to interactions between molecules and to exchange mechanisms of biomolecules with hydration water46.
On the other hand, the rotational diffusion coefficients for the bulk-like water component, for the two sam-ples, are in agreement with the value for bulk water (2.3 10−5 cm2/s)47.
In conclusion, the bulk-like water population has diffusion rates typical for pure free water but with a different residence time. However, no difference is found for this component between RH and LH.
The translational and rotational diffusive contributions of the restricted water proton dynamics show non-negligible variations from bulk water, confirming a strong reduction in water mobility. In particular, the translational diffusion coefficients (0.20 ± 0.02 10−5 cm2/s in RH, 0.16 ± 0.04 10−5 cm2/s in LH) are one order of
magnitude lower than those for bulk water and they are hemisphere-independent. On the other hand, a higher residence time is found for LH compared to RH. In the rotational diffusion coefficient (1.1 ± 0.1 10−5 cm2/s in RH
and 0.40 ± 0.06 10−5 cm2/s in LH), strong hemisphere dependence is also found. This difference highlights the
suppressed water dynamics in LH. In short, a second population of water with restricted behavior is found, with properties, which differ from one hemisphere to the other, resulting, in particular, in suppressed dynamics in LH. The results obtained with dMRI for the diffusion coefficient (0.078 ± 0.003 10−5 cm2/s in RH and 0.083 ± 0.004
10−5 cm2/s in LH) are in accordance with the behavior of water diffusion shown with neutron spectroscopy, even
though they are an order of magnitude different from those found in QENS measurements. The time over which the dMRI measurements are made is sufficiently long that significant interaction of water molecules with cellular constituents occurs. Indeed, during the 11 ms of diffusing time (td) applied here, the water molecules are able to
explore a distance (x) of ~4 μm (x2 = 2·D·t
d, with D the water diffusion coefficient at room temperature), i.e. the
typical size of a cell (from 0.9 μm for dendrites to 20–30 mm for ribosomes). Thus, viscosity and macromolecular crowding are among the possible causes of the reduction of the diffusion coefficients28,48,49. On the other hand, obstructive effects less influence D measured by neutron scattering, being a probe of atomic scale at which the macromolecular separation occurs. As revealed by our diffraction experiments (Fig. 1a), the compaction of the myelin sheath is clearly different in the two hemispheres. So the different microscopic structure between the two hemispheres may explain the differences in water diffusion. The enhanced anisotropic behavior of LH shown in Fig. 3 also supports this idea. Indeed, the restriction may not be the same for different directions of motion. In a study by Denis Le Bihan et al.50, the diffusion coefficient was found to be significantly smaller when the gradient pulses of the diffusion imaging sequence are perpendicular to the myelin fiber direction. The diffusion of water is restricted differently along and across fibers: in the direction transverse to the fibers, water motion is prevented by
f pfast pslow pCH2 DTfast DRfast τfast DTslow DRslow τslow ΓCH2
RH 0.040 ± 0.002 0.736 ± 0.002 0.123 ± 0.002 0.100 ± 0.002 2.5 ± 0.1 2.3 ± 0.2 1.8 ± 0.1 0.20 ± 0.02 1.10 ± 0.05 6.7 ± 0.3 0.39 ± 0.02
LH 0.062 ± 0.003 0.715 ± 0.003 0.135 ± 0.003 0.088 ± 0.003 2.3 ± 0.2 2.3 ± 0.3 1.8 ± 0.5 0.16 ± 0.03 0.40 ± 0.03 9.7 ± 0.3 0.33 ± 0.05
Bulk water* 2.5 2.3 0.9
Bulk water** 2.3 1.1
Table 4. Values of the parameters obtained when fitting at the same time 11 Q values, from 0.33 to 0.96 Å−1.
f is the fraction of immobile protons; pfast, pslow and pCH2 are respectively the fraction of free water population,
of restricted water population and of protons not attributed to water. DTfast/slow, DRfast/slow and τfast/slow are the
translational and rotational diffusion coefficients and residence times of free water (fast) and restricted water (slow). ΓCH2 is the line-width of the SCH2 (Q, ω) contribution. Units for DTfast, DTslow, DRfast, and DRslow are
expressed in [10−5 cm2/s], while τ
fast and τlow are expressed in [ps] and ΓCH2 in [meV]. * = Diffusion coefficient
of bulk water determined experimentally from a scan of pure water measured at 300 K on IN5 at the same energy resolution. ** = Diffusion coefficient of bulk water found in literature42,47 for T = 298 K. The associated errors were estimated using the Minuit minimization algorithm and the Minuit processor MINOS60.
Figure 6. Contributions of the fast (panel a) and slow (panel b) water pool to the global QENS signal. RH:
www.nature.com/scientificreports
www.nature.com/scientificreports/
the presence of the myelin sheet. This is in agreement with the earlier findings of Anderson et al.51, who reported interregional asymmetries in myelin sheath thicknesses through electron microscopy on post-mortem posterior superior temporal lobes in humans. In particular, left hemispheres were seen to be characterized by larger diam-eter axons surrounded by a thicker myelin sheath, reflecting the faster conduction required by the rapid sensory signal processing performed by the left hemisphere. To the best of our knowledge, the investigation of structural asymmetries of myelin size has not been extended, up to now, to other cortical areas. Thus, our work provides unique experimental evidence reinforcing the idea of left-to-right asymmetry in hemisphere tissue myelination. Unfortunately, the anisotropic behavior cannot be investigated at the atomic scale, since QENS provides averaged information on the dynamics of all the protons constituting the sample. In order to be direction sensitive, QENS scans must be acquired on oriented samples such as myelin fibers.
Moreover, Penhune and Hervé52,53 highlighted interregional asymmetry in the primary auditory areas13, which they suggested was due to the existence of larger volumes of white matter in the LH and thus to differences in the cellular organization of the two hemispheres, as speculated by Kantarci K. et al.54, who proposed that neuron and glia were more compactly packed in LH than in RH. Similar findings were reported by Amunts et al.55, who showed that the right hemisphere was characterized by a greater percentage of cell soma in the cortical regions (difference in volume density of nerve cells up to 5%), while the left hemisphere contained more dendrites, axons and synapses.
The diameter of the fibers and the thickness of the myelin sheath may be small (e.g. as thin as 0.1 µm56,) and thus challenging to address with in vivo dMRI, a technique which has a low sensitivity to short diffusion times57. Probing water diffusion at the atomic scale using neutron scattering could therefore help describing fine differ-ences in brain conductivity and help understand how brain lateralization contributes to brain function. Further experiments are required to evaluate how changes in myelin sheath properties and/or axonal diameter can be evaluated by neutron scattering.
Materials and Methods
Tissue extraction and sample preparation.
Fresh post-mortem bovine brains were obtained from the slaughterhouse in Padova (Italy). Brain tissues were extracted at the Department of Animal Medicine, Production and Health of the University of Padova (Italy). The brains were removed in two parts: the cerebellum and the cerebrum, then separated at the junction of the pons and the cerebral peduncle. Sections (0.5 × 1 cm2) of RH andLH were extracted from the cerebrum and frozen at −160 °C in liquid nitrogen vapor and divided in two prior to the dMRI and neutron scattering experiments.
Figure 7. FWHM (Γ) of the translational motion for bulk-like water component (a) and restricted water
component (b), for RH (green symbols), LH (blue symbols) and pure water (orange symbols), as a function of Q2, at 300 K. A Fick’s law function (purple line) has also been reported.
dMRI experiments.
dMRI measurements of bovine brain tissue at room temperature wereper-formed at the MRI Facility of Grenoble (IRMaGe, France) using a 4.7 T Biospec 47/40 USR system (Bruker, Ettlingen, Germany), capable of delivering gradient strengths of 600 mT/m in 120 μs, and a volume transmit/ receive coil. T2 (transverse relaxation time) control scans were performed using a Carr Purcell Meiboom Gill sequence (64 spin-echoes between 5 and 320 ms, TR = 2000 ms, field of view = 70 × 70 mm², matrix = 128 × 96, slice thickness = 3 mm, 2 averages). Diffusion weighted images were obtained using a spin-echo echo-planar sequence (TE = 23.2 ms, δ = 7 ms, Td = 11 ms, TR = 2000 ms, same geometry as that of the T2 sequence above, matrix = 64 × 48, 2 averages). Twelve reference images (b = 0.5 s/mm², where b is the diffusion weighting factor) were followed by diffusion weighted images. Forty-eight values of b, varying between 100 and 9400 s/mm², were applied in each of the 3 gradient orientations (x, y and z with a total of 144 diffusion weighted images). Data were further analyzed using a bi-exponential model29–31.
Neutron scattering experiments.
For the neutron experiments, 50 μm thick slices of RH and LH were cut using a cryotome (Thermo Scientific, Shandon Cryotome SME Cryostat, 77210160 - France) at the histological laboratory of the Biomedical Facility of the European Synchrotron Radiation Facility (ESRF, Grenoble-France), while preserving the tissue temperature at constant −20 °C. The thickness of the tissue slices was chosen in order to limit neutron absorption from water (H2O), thus minimizing multiple scattering events. The sample was closedin vacuum-tight pure aluminum flat sample holder.
For the diffraction experiments, to enhance the coherent signal and the neutron contrast, the tissue was left to equilibrate in a D2O atmosphere for 30 minutes in order to promote isotope H-D exchange. The coherent
scattering cross-section of D is indeed larger with respect to H (σcD = 5.6 10-24 cm2; σcH = 1.76 10-24 cm2). The
resulting diffraction pattern was obtained on the small momentum transfer diffractometer D16 ILL (Grenoble, France). The instrument was operating with the MILAND 3He position sensitive detector consisting of 320 × 320
detection channels with 1 mm resolution, resulting in a sensitive area of 32 × 32 cm2. The monochromator was
set to deliver a wavelength λ = 4.75 Å with Δλ/λ = 0.01 (FWHM) and the sample-to-detector distance was set to 950 mm. The data were corrected for detector efficiency, normalized to incident neutron flux and integrated vertically in the range −1.2° < 2θvert < 2.8°.
To estimate the diffusion coefficient of protons at the atomic scale, QENS experiments were carried out at room temperature on the high-resolution time–of–flight spectrometer IN558 at ILL.
For the present work, we chose the instrument setup configuration at λ = 10 Å, corresponding to an energy resolution of δE ~ 10 µeV FWHM (which is equivalent to 10−10 s) and Q < 1.1 Å−1 (equivalent to 6 Å). Consecutive
short QENS scans were acquired (15 minutes each) and compared before binning. During the measured laps of time (2 hours), the scattering signal was stable, meaning that no variation was observed in proton dynamics. Data reproducibility and changes in the tissues dynamics upon the conservation protocol, cryogenic towards formalin addition, were discussed in dedicated papers published by our group19,20.
The program LAMP59 was used for data reduction, consisting in the a) normalization of the raw data to the neutron flux, b) subtraction of the empty cell contribution and c) normalization with respect to a vanadium scan (a totally incoherent sample) to compensate for differences in detector efficiency and geometry. In order to avoid corrections from multiple scattering events, cell thickness were properly chosen to minimize neutron absorption from the sample (sample transmission ∼90%).
Conclusion
Our data showed that significant differences in the behavior of water exist between RH and LH in bovine brain hemispheres, with the water in LH more restricted than in RH both in the micron and atomic scales, accompa-nied by asymmetries in the myelin sheath thickness. Although the composition of such physiological systems is complex, the average proton dynamics at the atomic scale (ps-ns time scale) probed using QENS reveals signif-icant differences in water diffusion when looking at tissues. The QENS analysis allowed us to quantify and dis-criminate free and restricted water diffusion processes through translational and rotational diffusion coefficients and residence times. Interregional asymmetries are found in the dynamic properties of the restricted water pool, while the bulk-like component remains unaffected. Moreover, our dMRI measurements allowed us to highlight the anisotropic behavior of water diffusion within the tissue.
Data Availability
The data are accessible at osf.io/adw9q. Data Digital Object Identifier: https://doi.ill.fr/10.5291/ILL-DA-TA.8-05-416.
References
1. Kandel, E. R., Schwartz, J. H. & Jessel, T. M. Principi di Neuroscienza. (ed. Casa Editrice Ambrosiana Milano) (1994).
2. Pakkenberg, B. & Gundersen, H. Neocortical neuron numbers in humans: effect of sex and age. J. Comp. Neurol. 384, 312–320 (1997).
3. Pakkenberg, B. et al. Aging and the human neocortex. Exper. Geront. 38, 95–99 (2003).
4. Williams, R. W. & Herrup, K. The control of neuron number. Ann Rev Neuroscience 11, 423–453 (1988).
5. Ross, E. D. & Monnot, M. Neurology of affective prosody and its functional-anatomic organization in right hemisphere. Brain Lang.
104(1), 51–74 (2008).
6. George, M. S. et al. Understanding emotional prosody activates right hemisphere regions. Arch Neurol. 53(7), 665–670 (1996). 7. Dehaene, S., Spelke, E., Pinel, P., Stanescu, R. & Tsivkin, S. Sources of mathematical thinking: behavioral and brain-imaging
evidence. Science 7(284), 970–4 (1999).
8. Schenker, N. M., Sherwood, C. C., Hof, P. R. & Semendeferi, K. Microstructural asymmetries of the cerebral cortex in humans and other mammals in The evolution of hemispheric specialization in primates (ed. Hopkins, W. D.) American Society for Primatologysts. Pub. Elsevier Ldt (2007).
9. Partadiredja, G., Miller, R. & Oorschot, D. E. The number, size, and type of axons in rat subcortical white matter on left and right sides: a stereological, ultrastructural study. J. of Neurocytology 32, 1165–1179 (2003).
www.nature.com/scientificreports
www.nature.com/scientificreports/
10. Zaidel, D. W., Esiri, M. M. & Harrison, P. J. Size, shape, and orientation of neurons ine the left and right hippocampus: investigation of normal asymmetries and alteration in schizophrenia. Am. J. Psychiatry 154(6), 812–818 (1997).
11. Watkins, K. E. et al. Structural asymmetries in the human brain: a voxel-based statistical analysis of 142 MRI scans. Cerebral Cortex
11, 868–877 (2001).
12. Miller, A. K., Alston, R. L. & Corsellis, J. A. Variation with age in the volume of grey and white matter in the cerebral hemispheres of man: measurements with an image analyser. Neuropathol. Appl. Neurobiol. 6, 119–132 (1980).
13. Blinkov, S. M. & Glezer, I. I. The human brain in figures and tables: A Quantitative Handbook. (Plenum Press, New York, 1968). 14. Brante, G. Studies on lipids in the nervous system with special reference to quantitative chemical determination and topical
distribution. Acta physiol. scand. 18(Suppl. 63), 1–189 (1949).
15. Iturria-Medina, Y. et al. Brain hemisperic structural efficiency and interconnectivity rightward asymmetry in human and nonhuman primates. Cerebral Cortex 21, 56–67 (2011).
16. Fabiano, A. J., Horsfield, M. A. & Bakshi, R. Interhemispheric Asimmetry of Brain Diffusivity in Normal Individuals: A Diffusion-Weighted MR imagin Study. AJNR Am J Neuroradiol. 26, 1089–1094 (2005).
17. Helenius, J. et al. Diffusion-weighted MR imaging in normal human brains in various age groups. Am. J. Neuroradiol. 23, 194–199 (2002).
18. Naganawa, S. et al. Regional ADC values of the normal brain: differences due to age, gender, and laterality. Eur. Radiol. 13, 6–11 (2003).
19. Natali, F. et al. Water dynamics in neural tissue. J. Phys. Soc. Jpn. 82, SA017 (2013).
20. Natali, F., Gerelli, Y., Stelletta, C. & Peters, J. Anomalous proton dynamics of water molecules in neural tissue as seen by quasi-elastic neutron scattering. Impact on medical imaging techniques. AIP Conf. Proc. 1518, 551 (2013).
21. Kirschner, D. A. & Caspar, D. L. D. Myelin structure transformed by dimethylsulfoxide. Proc. Nat. Acad. Sci. USA 72(9), 3513–3517 (1975).
22. Kirschner, D. A., Caspar, D. L. D., Schoenborn, B. P. & Nunes, A.C. Neutron Diffraction Studies of Nerve Myelin. Neutron Scattering for the analysis of biological structures. Brookhaven Symposia in Biology 27 (1975).
23. Caspar, D. L. D. & Kirschner, D. A. Myelin Mebrane structure at 10 A resolution. Nature new biology 231, 46–52 (1971). 24. Parsons, D. F. & Akers, C. K. Neutron Diffraction of Cell Membranes (Myelin). Science 165, 1016–1018 (1969).
25. Reconstituted Myelin Sheaths Investigated by Neutron Scattering: the Role of Myelin Proteins. Wiebke Knoll. Phd thesis (2012). 26. Knoll, W. et al. Structural and dynamical properties of reconstituted myelin sheaths in the presence of myelin proteins MBP and P2
studied by neutron scattering. Soft Matter 10(3), 519–529 (2014).
27. Yablonskiy, D. A. & Sukstanskii, A. L. Theoretical models of the diffusion weighted MR signal. NMR Biomed. 23, 661–681 (2010). 28. Natali, F. et al. Anomalous water dynamics in brain: a combined diffusion Magnetic Resonance Imaging and Neutron Scattering
investigation. Journal of the Royal Society Interface. In press.
29. Maier, S. E. & Mulkern, R. V. Biexponential analysis of diffusion related signal decay in normal human cortical and deep gray matter.
Magn. Reson. Imaging 26(7), 897–904 (2008).
30. Minati, L. et al. Biexponential and diffusional kurtosis imaging, and generalized diffusion-tensor imaging (GDTI) with rank-4 tensors: a study ina a group of healthy subjects. Magn. Reson. Mater. Phy. 20, 241–253 (2007).
31. Clark, C. A. & Le Bihan, D. Water diffusion compartmentation and anisotropy at high b values in the human brain. Magn. Reson. In
Medicine 44, 852–859 (2000).
32. Sears, V. F. Theory of cold neutron scattering by homonuclear diatomic liquids: I Free rotation. Can J. Phys. 44, 1279–1297 (1966). 33. Bee, M. Quasielastic neutron scattering (Adam Hilger: Bristol) (1988).
34. Volino, F. & Dianoux, A. J. Neutron incoherent scattering law for diffusion in a potential of spherical symmetry: general formalism and application to diffusion inside a sphere. Molecular Physics 41(2), 271–279 (1980).
35. Piazza, I. et al. Dynamical properties of water in living cells. Frontiers in Physics 13(1), 138301 (2018).
36. Kappel, S., Mendl, M. T., Barrett, D. C., Murrell, J. C. & Whay, H. R. Lateralized behaviour as indicator of affective state in dairy cows.
PLoS One 12(9), e0184933 (2017).
37. Phillips, C. J., Oevermans, H., Syrett, K. L., Jespersen, A. Y. & Pearce, G. P. Lateralization of behavior in dairy cows in response to conspecifics and novel persons. J Dairy Sci. 98(4), 2389–400 (2015).
38. Karolis, V. R., Corbetta, M. & de Schotten, M. T. The architecture of functional lateralisation and its relationship to callosal connectivity in the human brain. Nature Communications, 10–1417 (2019).
39. New, F. H. et al. Hemispheric lateralization abnormalities of the white matter microstructure in patients with schizophrenia and bipolar disorder. J Psychiatry Neurosci 42(4), 242–251 (2017).
40. Liewald, D., Miller, R., Logothetis, N., Wagner, H. J. & Schüz, A. Distribution of axon diameters in cortical white matter: an electron-microscopic study on three human brains and a macaque. Biol. Cybern. 108(5), 541–557 (2014).
41. Frölich, A. et al. From shell to cell: neutron scattering studies of biological water dynamics and coupling to activity. Faraday Discuss.
141, 117–130 (2009).
42. Jasnin, M., Moulin, M., Haertlein, M., Zaccai, G. & Tehei, M. Down to atomic-scale intracellular water dynamics. EMBO Rep. 9, 543–547 (2008).
43. Stadler., A. M. et al. Cytoplasmic Water and Hydration Layer Dynamics in Human Red Blood Cells. J. Am. Chem. Soc. 130, 16852–16853 (2008).
44. Martinez, N. et al. High protein flexibility and reduced hydration water dynamics are key pressure adaptive strategies in prokaryotes.
Sc. Rep. 6, 32816 (2016).
45. Golub, M. et al. High hydrostatic pressure specifically affects molecular dynamics and shape of low-density lipoprotein particles. Sc.
Rep. 7, 46034 (2017).
46. Jasnin, M., Stadler, A., Tehei, M. & Zaccai, G. Specific cellular water dynamics observed in vivo by neutron scattering and NMR.
Phys. Chem. Chem. Phys. 12, 10154–10160 (2010).
47. Teixeira, J. & Bellissent-Funel, M. C. Experimental determination of the nature of diffusive motions of water molecules at low temperatures. Physical Review A 31(3), 1913–1917 (1985).
48. Chen, K. C. & Nicholson, C. Change in brain cell shape creates residual extracellular space volume and explains tortuosity behavior during osmotic challenge. Proc. Nat. Acad. Sci. 97, 8306–8311 (2000).
49. Le Bihan, D. & Johansen-Berg, H. Diffusion MRI at 25: Exploring brain tissue structure and function. Neuroimage 61(2), 324–341 (2012).
50. Le Bihan, D., Turner, R. & Douek, P. Is water diffusion restrited in human white matter? An echo-planar NMR imaging study.
NeuroReport 4, 887–890 (1993).
51. Anderson, B., Southern, B. D. & Powers, R. E. Anatomic asymmetries of the posterior superior temporal lobes: a postmortem study.
Neuropsychiatry Neuropsychol. Behav. Neurol. 12(4), 247–254 (1999).
52. Penhune, V. B., Zatorre, R. J., MacDonald, J. D. & Evans, A. D. Interhemispheric anatomical differences in human primary auditory cortex: probabilistic mapping and volume measurement from magnetic resonance scans. Cerebral Cortex 6, 661–672 (1996). 53. Hervé, P. Y., Crivello, F., Perchey, G., Mazoyer, B. & Tzourio-Mazoyer, N. Handedness and cerebral anatomical asymmetries in young
adult males. Neuroimage 29, 1066–1079 (2006).
54. Kantarci, K. et al. Mild cognitive impairment and Alzheimer disease: regional diffusivity of water. Radiology 219, 101–107 (2001). 55. Amunts, K. et al. Asymmetry in the human motor cortex and handedness. Neuroimage 4, 216–22 (1996).
56. Sultan, F. Exploring a critical parameter of timing in the mouse cerebellar microcircuitry: the parallel fiber diameter. Neurosci Lett.
280(1), 41–4 (2000).
57. Van, A. T., Holdsworth, S. J. & Bammer, R. In vivo investigation of restricted diffusion in the human brain with optimized oscillating diffusion gradient encoding. Magn. Reson. Med. 71(1), 83–94 (2014).
58. Ollivier, J., Plazanet, M., Schober, H. & Cook, J. C. First results with the upgraded IN5 disk chopper cold time-of-flight spectrometer.
Physica B: Condensed Matter 350(1-3), 173–177 (2004).
59. Richard, D., Ferrand, M. & Kearley, G. Analysis and Visualisation of Neutron-Scattering Data. Journal of Neutron Research 4, 33–39 (1996).
60. James, F. & Roos, M. MINUIT — A system for function minimization and analysis. Comput. Phys. Commun. 10, 343–367 (1975).
Acknowledgements
We would like to thank Dr. Y. Gerelli (ILL, Grenoble-France) for his help with data analysis and in particular for providing the software tool used in this paper. We also wish to thank C. Le Clec’h for her support at the histological laboratory of the Biomedical Facility of ESRF, J. Peters for the help with Fig. 1b, and I. Piazza for helping with the manuscript revision. IRMaGe is partly funded by “Investissements d’Avenir” run by the French National Research Agency, grant “Infrastructure d’avenir en Biologie Santé” [ANR-11-INBS-0006].
Author Contributions
F.N. devised, designed and coordinated the study, performed the experiments, co-analyzed the data and wrote the manuscript; C.D. performed the experiments, co-analyzed the data and helped draft the manuscript; J. Peters performed the experiment and critically revised the manuscript; C.S. provided the brain samples; B.D. and J.O. helped during the neutron experiments and critically revised the manuscript; G.L. helped with the sample preparation for the neutron experiments; A.C. critically revised the manuscript; E.L.B. lead the dMRI experiments.
Additional Information
Competing Interests: The authors declare no competing interests.
Publisher’s note Springer Nature remains neutral with regard to jurisdictional claims in published maps and
institutional affiliations.
Open Access This article is licensed under a Creative Commons Attribution 4.0 International
License, which permits use, sharing, adaptation, distribution and reproduction in any medium or format, as long as you give appropriate credit to the original author(s) and the source, provide a link to the Cre-ative Commons license, and indicate if changes were made. The images or other third party material in this article are included in the article’s Creative Commons license, unless indicated otherwise in a credit line to the material. If material is not included in the article’s Creative Commons license and your intended use is not per-mitted by statutory regulation or exceeds the perper-mitted use, you will need to obtain permission directly from the copyright holder. To view a copy of this license, visit http://creativecommons.org/licenses/by/4.0/.