HAL Id: hal-02972524
https://hal.archives-ouvertes.fr/hal-02972524
Submitted on 1 Dec 2020
HAL is a multi-disciplinary open access
archive for the deposit and dissemination of
sci-entific research documents, whether they are
pub-lished or not. The documents may come from
teaching and research institutions in France or
abroad, or from public or private research centers.
L’archive ouverte pluridisciplinaire HAL, est
destinée au dépôt et à la diffusion de documents
scientifiques de niveau recherche, publiés ou non,
émanant des établissements d’enseignement et de
recherche français ou étrangers, des laboratoires
publics ou privés.
Visual exploration of rating datasets and user groups
Fabian Colque Zegarra, Juan Carbajal Ipenza, Behrooz Omidvar-Tehrani,
Viviane Moreira, Sihem Amer-Yahia, João L.D. Comba
To cite this version:
Fabian Colque Zegarra, Juan Carbajal Ipenza, Behrooz Omidvar-Tehrani, Viviane Moreira, Sihem
Amer-Yahia, et al.. Visual exploration of rating datasets and user groups. Future Generation
Com-puter Systems, Elsevier, 2020, 105, pp.547-561. �10.1016/j.future.2019.12.011�. �hal-02972524�
Visual Exploration of Rating Datasets and User Groups
Authors’ Copy
Fabian Colque Zegarraa, Juan C. Carbajala, Behrooz Omidvar-Tehranib, Viviane Moreiraa, Sihem Amer-Yahiac,d, Jo˜ao L. D. Combaa
aUFRGS (Brazil) bNAVER LABS Europe (France) cUniversity of Grenoble Alpes (France)
dCNRS (France)
Abstract
The increasing availability of rating datasets (i.e., datasets containing user evaluations on items such as products and services) constitutes a new opportunity in various applications ranging from behavioral analytics to recommendations. In this paper, we describe the design of VugA, a visual enabler for the exploration of rating data and user groups. VugA helps analysts, be they novice analysts or domain experts, acquire an understanding of their data through a seamless integration between exploring users and exploring their collective behavior via group analysis. VugA is data-driven and does not require analysts to know the value distributions in their data. While automated systems can identify and suggest potentially interesting groups, they can do that for well-specified needs (e.g., through SQL QUERIES or constrained mining). VugA helps analysts filter and refine their exploration as they discover what lies in the data. VugA enables analysts to easily acquire statistics about their data, form groups, and find similar and dissimilar groups. While most visual analytics systems are data-dependent, VugA relies on a data model that captures user data in such a way that a variety of group formation and exploration approaches can be used.
Email addresses: [email protected] (Fabian Colque Zegarra), [email protected] (Juan C. Carbajal),
[email protected] (Behrooz Omidvar-Tehrani),
[email protected] (Viviane Moreira), [email protected] (Sihem Amer-Yahia), [email protected] (Jo˜ao L. D. Comba)
We describe the architecture of VugA and illustrate its use via tasks and a user study. We conclude with a discussion on future work enabled by VugA. Keywords: User Data Exploration, User Group Exploration, Visual Analytics, User Data, Dimensionality Reduction
1. Introduction
Scientists and non-scientists increasingly rely on user data to achieve a variety of tasks with the target goal of finding people of interest or analyzing collective behavior. Many examples of user data can be found on the social web and more particularly in online rating systems. In general terms, rating datasets can be
5
described by a combination of demographics (e.g., age, gender, occupation) and events (e.g., movie or book ratings). Given their high volume, understanding what lies behind those datasets is a daunting task. More specifically, identifying group behavior in those datasets relies on the ability to explore the space of users, aggregate their demographics and interests, and compare groups. While
10
automated systems can identify and suggest potentially interesting groups, the need for an interactive process that provides filtering capabilities requires a visual interface. The combination of a visual interface and statistics with filtering capabilities is referred to as a Visual Analytics (VA). In this paper, we describe VugA, a VA system for exploring users and forming and exploring
15
groups in datasets that have demographics and ratings.
A visual user group analytics system integrates user data exploration and group explorationvia a visual interface. User data exploration is the process through which analysts acquire an understanding of users and their statistics [1]. This process relies on the ability to visually filter users based on common
20
demographics or interests. This process results in a seed group that is built by the analyst for further exploration. Group exploration takes as input a seed group and returns similar and dissimilar groups [2]. User and group explorations both serve scenarios where analysts express partial needs and require to build on the knowledge they acquire as they see more data. Providing an interface
25
enables visual inspection of the data and lets the analyst intervene to apply filters, handpick users in groups, form new groups, and request related groups. VugA caters to analysts with varying levels of expertise. Novice analysts are generally interested in completing daily tasks such as finding a movie or starting a book club. For that, they need to find people like them and alternate between a
30
user-centric view and a group-centric view of the data. They also need to explore individual and collective interests to reach a decision. Domain experts, on the other hand, tend to look for validating assumptions on their data, the so-called “Confirmatory Analysis” [3]. For instance, they want to verify if middle-aged people prefer Drama movies over Comedies. For that, they need to obtain a
35
holistic view of statistics and data distributions associated with demographics and movie genres. VugA offers an integrated system within which both users and groupscan be explored.
While the status quo of analyzing user data and user groups is to get statistics, form groups, and explore them with separate tools [4], VugA combines the
40
power of a visual interface with an interactive exploration of user data and groups. This has both transfer and time overheads [5]. Some existing work alleviates that by providing partial handshaking between different components. For instance, visual interfaces are integrated with user exploration [6] and group exploration [7, 8, 9, 10]. There are also many exploration methods without a
45
visual interface [11, 12, 13, 14]. VugA is a fully-integrated visual exploration system for rating data.
VugA relies on a data model that captures a variety of user data and additional information that allows to compose and iterate between the user and group explorations. The model represents a user as a single vector that gathers
50
demographics and interests. A set of users is then a set of vectors to which a 2D projection is applied for visualization. The projection is based on computing vector similarity between user vectors and visualizing similar users closer to each other. The 2D projection is done using t-distributed Stochastic Neighbor Embedding technique (t-SNE) [15], which is widely applied in machine learning,
55
seed group which is fed to group exploration to find similar/dissimilar groups. This interleave between modeling users and groups enables seamless handshaking between user and group explorations through a visual interface.
Contributions. VugA makes the following contributions.
60
1. The ability to represent, ingest and visualize a variety of user and rating data in a generic fashion.
2. The ability to visually filter and form user groups on-the-fly along multiple dimensions. Additionally, the visualization is enriched with a coordinated view of various statistics associated with groups.
65
3. The ability to use a group exploration method that takes a seed group and find similar/dissimilar groups through seamless integration between a user-centric and a group-centric view of user data.
4. Support for different use cases that cater to analysts with different data expertise. Two representative use cases and a user study that validate the
70
need for an integrated system for user and group explorations.
Outline. Section 2 describes the components of VugA and positions our contributions with respect to related work. The design considerations of a visual exploration system for user data are outlined in Section 3. The overall architecture of VugA is outlined in Section 4. A detailed description of VugA in
75
action is described in Section 5. We present a user study in Section 6. Section 7 concludes with a summary and a discussion of future directions.
2. Related Work
Exploring rating data calls for an understanding of data about users and the ability to handpick users of interest (referred to as group formation). A group is
80
a set of individuals with common demographics and events. Forming such groups enables analysts to understand the collective behavior of individuals in groups.
Often there exist millions of groups in user data which put a burden on analysts to pick groups of interest manually. Group exploration methods help analysts to navigate in the plethora of groups in an effective way. Visualization helps
85
analysts make sense of explored data and groups. VugA is a mixed-initiative framework [16] which incorporates rating data exploration, group exploration, and visualization, in a fully connected fashion. We structure the related work by the features and analytical tasks that VugA provides. First, we review visual analytics approaches which enable sense-making of user data (Section 2.1).
90
Second, we discuss systems which help analysts understand and explore users and groups using visual variables (Sections 2.2 and 2.3, respectively). Third, we discuss underlying connections between group formation and exploration, and review systems that implement partial handshaking (Section 2.4). Last, we discuss how current systems support alternating between the user and group
95
context (Section 2.5).
2.1. Visual analytics for understanding user data
Visualization refers to a set of approaches which enable sense-making of data using visual variables [17]. It adds value to insights with the use of visual views rather than textual or tabular content [18]. The combination of
100
analytical reasoning and visualization gave birth to the field of Visual Analytics (VA) [19, 20]. This field is responsible for the formulation, refinement, and validation of hypotheses about data using interactive visual interfaces. VugA implements visual analytics for analyzing user data. A common challenge for visualizing user data is clutteredness, i.e.,, the huge volume and heterogeneity
105
of user data hinders its effective visualization. We review related work which tackled this challenge to provide a clear visualization of user data.
Scatter plots and parallel coordinates. A preliminary solution is to employ visual views which can separate user data naturally, i.e., scatter plots [21] and parallel coordinates [6]. However, the drawback of such views is that they
110
only serve numerical attributes. Also, they do not fully solve the problem of clutteredness, as a rich user data with many attributes is still problematic to be
visualized with such methods.
Summarization. Another way to address clutteredness is to visualize only a summary of user data. In [22], a visualization approach is proposed to summarize
115
sequences of user events and provide details-on-demand only. In [13], the analysis is limited to a pre-defined set of groups (i.e., cubes) to reduce the amount of visualized data in each analysis iteration. However, the challenge with most summarization methods is that they are lossy, i.e., there is no way to revert to the unsummarized version of the data, or it is time- and space-consuming.
120
Customizability. There is a recent trend whose effort is to provide a set of “visual grammars” where analysts can customize the analysis process and define what they want to see, hence reducing unnecessary content to visualize [23]. Vega is among the most popular visual grammars in the literature [10], where analysts can employ “signals” to associate their customized way of visualizing data to
125
visual variables. Signals are dynamic variables that parameterize a visual element (e.g., a circle representing a group) for interactive behavior. Full customizability of visual grammars enables analysts to express clear visualizations for their analysis tasks. While visual grammars are beneficial to define the structure of an analysis task and reduce visual content, it is time-consuming, and analysts
130
are not necessarily knowledgeable about visual grammar rules.
Dimensionality reduction. Recently, dimensionality reduction has become the method of choice in visual analytics to represent a clear 2D visualization of user data [24]. The proximity in the 2D view reveals the similarity between users. Popular dimensionality reduction methods are Principle Component Analysis
135
(PCA), Multidimensional Scaling (MS) and t-distributed Stochastic Neighbor Embedding (t-SNE) [15], and more recently UMAP [25]. The focus of PCA is to capture variance in user data [26]. Given a user and its attributes, PCA uses its covariance matrix to perform a linear transform from the attributes to two new orthogonal dimensions with the largest possible variance (aka, the Rayleigh
140
quotient). However, the linearity of PCA dismisses the similarities between group members. MS focuses on finding a matching from the n-dimensional space to a
2-dimensional space which preserves similarities between group members [27]. The advantage of MS over PCA is in its extended functionality to non-linear mappings. MS minimizes a stress function which captures the difference of user
145
similarities between the original view and the 2D view. While t-SNE has the same manifold nature as MS, it focuses on local structures of group members to obtain a clearer view [28]. Instead of the stress function, t-SNE minimizes the KL-divergence between the distribution of user similarities in the original view and the 2D view to separate dissimilar members even more. For all these
150
reasons, we employ t-SNE in this work to obtain a clear 2D view of user data. UMAP [25] is the newest among these dimensionality reduction techniques. It has similar visualization capabilities compared to t-SNE, but at a lower cost. 2.2. Visual enablers for group formation
The integration of VA approaches with group formation enables visual
in-155
spection of user groups. Analysts inspect formations in a visual form, and if they are not satisfied enough for their task, they change filters to form other groups. Self-Organizing Maps [29] are employed to visualize the overall distribution of events in user groups. Belt charts (or Sunbursts) [30] are also used to provide a more focused view on biases in distributions (dominating attribute-values) of a
160
single group (e.g., presence of more females in groups than males.) In case the analyst wants to focus on one specific facet of formed groups, a 3D regression heatmap can be adapted to user groups to organize all groups in a 3D grid reflecting the extent of correlation between groups and the given facet [31]. In the work of Makanju et al. [32], hierarchical relations between groups are visualized
165
to provide a big picture of the group space. PivotSlice focuses on one single group and visualizes relations between users in that group [33]. TruGRC [34] describes a group recommendation system that relies on aggregation strategies of user profiles. In VugA, analysts observe users and their similarities in a 2D view. Selecting each subset of users in this view renders immediately a set of
170
statistics about them, which help analysts decide which users to consider for group formation.
2.3. Visual enablers for group exploration
The integration of VA approaches with group exploration enables interactive visualizations for user groups. Visualized groups facilitate expressing needs
175
for analysts [7, 35]. Zenvisage provides a visualization view for query-based explorations [7]. Data Tweening is another visualization view which enables analysts to retain changes between consecutive iterations of exploration [8]. Vexus is a visualization framework to provide native support for exploring user groups [9]. FlashView is also a visualization interface for fast exploration of
180
user groups using approximate query processing (AQP). In VugA, a seed group will be selected in the 2D view and the system will explore other similar and dissimilar groups to the seed group.
2.4. Handshaking between group formation and exploration
Group formation and exploration have each their separate systems and it is
185
often hard to enable a natural formation exploration loop, due to their different nature. Few approaches in the related work incorporate them into the same loop. In [11, 36], groups are formed as frequent patterns, and the analyst can only examine groups selected by an objective function. In [12], the focus is more on exploration where groups are sampled from the group space and analysts can
190
guide the sampling process according to their interests. Also in [13, 14], a set of pre-computed groups are available for exploration. Boratto et al. [37] describe an approach for automatic group detection that follows a group modeling strategy. The main challenge in all such systems is that the interaction between formation and exploration is weak as one needs to start a group formation process from
195
scratch when alternating from an exploration process. 2.5. Alternation between users and groups
Most user analytics approaches provide results either in the form of individual users or groups, hence there is no alternation between users and groups. In [29, 30, 31, 11, 36], user data is analyzed only in the form of groups, hence inquiring
200
about their members is nearly infeasible. While groups and their members are
both considered in [33, 38], interactions with groups is missing. It is crucial for a user analytics system to provide means to alternate between groups and their users anytime during the exploration. In VugA, analysts can select any subset of users from the 2D view to obtaining detailed information at the individual
205
level. They can then handpick a few users among them for group formation.
3. Design Considerations
We discuss four design considerations underlying the development of a visual analytics system for user data and user groups.
3.1. Represent and visualize user demographics and rating data Rating user data
210
involves demographic information about the users and the items they review. The visualization of demographics using charts offers a simple way to drive exploration for each of the demographic categories. A more challenging task is the creation of a visualization that allows exploration of users with similar interests (e.g., similar genres of rating items). Such a task requires
215
the creation of a view of the data that allows analysts to inspect users with similar interests. VugA represents user interests as feature vectors and maps each vector using a 2D projection. The 2D projection positions users based on their similarity offering an additional way to explore users in the subsequent steps (group formation and exploration).
220
3.2. Enable filtering and group formation
Given a set of users, the analyst should be able to filter them based on their demographics and interests. The system should also allow the analyst to build a seed group that will serve as a basis for further exploration. VugA associates a set of statistics to the displayed users. Analysts can select users of interest
225
using one of two ways: by simply using a lasso tool to select users, or by using demographics and interests filtering. In all cases, a seed group is constructed, and a coordinated view of various statistics associated with the seed group is provided. The coordinated view is updated as group membership evolves.
Tiffany who wants to find a person she met at last night’s party
in Westford, Massachusetts (MA). She does not remember
his name or any other indicating contact. Hence no querying
mechanism is of help. Tiffany uses V
EXUSto inspect the list
of Mike’s friends. Mike is the party host and V
EXUSforms
groups from Mike’s friends (
aggregated analytics). V
EXUSreturns three groups (limited options) which are “engineers in
MA who work in NextWorth company”, “engineers in
bioinfor-matics” and “part-time market managers in Boston”. Those
groups are diverse to provide different analysis directions and
cover most of Mike’s friends (optimality). Tiffany remembers
that the person she is looking for was talking about “data
visualization”, thus he should not be working for NextWorth,
a recycling company. She also remembers that he mentioned
he is a full-time employee; thus he should not belong to the
last group either. So she selects the group of engineers in
bioinformatics. In the next iteration, she immediately receives
three subsets of that group (efficiency). She notices a group of
“software engineers in BioView” (a company for cell imaging
and analysis) where she finds the person she was looking for.
Our contributions in V
EXUSare as follows.
Exploratory Analysis. V
EXUSis particularly targeted to
sce-narios of exploratory analysis where explorers have a partial
understanding of the underlying user data and need to refine
their objectives as they discover new insights. V
EXUSexploits
appropriate indexing paradigms to enable fluid interactions.
Moreover, V
EXUSbuilds an explorer profile and uses it
to anticipate follow-up steps and select groups on-the-fly
depending on the explorer’s evolving needs. V
EXUSserves
essential applications on a variety of datasets, such as building
a program committee for a conference [14], assembling a team
of experts in crowd data sourcing [17], recommending items
to a group [2], and validating hypotheses such as “young
professionals are more inclined to buying organic food” [12].
To the best of our knowledge, V
EXUSis the first framework
which enables fluid navigation of user groups in an exploratory
context.
Visualization. V
EXUSuses state-of-the-art visualization
tech-niques to interact with the explorer. User groups are visualized
in a directed force layout to prevent clutter. Histograms and
charts show detailed statistics about groups. Those statistics
are displayed in coordinated views where a brush on one
(e.g., histogram) updates all other statistics instantaneously.
The explorer can also request to see members of a group
where a two-dimensional projection provides a clustered view
of those users.
II. S
YSTEMA
RCHITECTUREFig. 1 shows the overall architecture of our system. First,
V
EXUSpre-processes user data offline to obtain user groups.
Groups form a disconnected undirected graph G where an
edge exists between two groups if they are not disjoint. Group
exploration is a navigation in that graph.
A. VEXUS Modules
Pre-processing. In the offline process, V
EXUSreceives the
input user data either as a dataset (in the form of a CSV
Images P
Layout Detection
Tabular Discovery
OCR
NLP
ER
Schema
Data-box Generation
Insights
Heuristics
SQL INSERT
Generation
User feedback
Database
Rule tables
User Database User Group Discovery User Data Index GenerationPre-processing GroupViz Context Explore Stats Focus Memo Save Group Exploration History Backtrack ETL
Fig. 1. VEXUS Architecture.
file) or as a data stream. An ETL process (including data
cleaning) precedes the data import to prepare data for analysis.
Each record in user data describes one user action (e.g., rating
a book). We consider the generic schema [user, item,
value] for user data. For instance the tuple [Mary, Mr
Miracle, 4] means that the user “Mary” rates the book
“Mr Miracle” with the score 4 (out of 5). Each user is also
associated to a set of demographics.
The user data is given as input to a group discovery
algo-rithm. V
EXUSis independent of this process. For user datasets,
different group discovery algorithms such as LCM [16] and
↵-MOMRI [13] can be used. In case of user data streams,
S
TREAMM
INING[9] and B
IRCH[18] can be employed. For
each group, its members and their common attributes will be
returned.
For efficient navigation in the space of groups, we build an
inverted index per group in g 2 G that contains all groups in
G
{g} in decreasing order of their similarity to g. We use
the Jaccard distance to compute the similarity between each
pair of groups. To reduce both time and space complexity, we
only materialize 10% of each inverted index which is shown
in [14] to be adequate to deliver satisfying results.
Group Exploration. Fig. 2 shows a screen-shot of group
exploration. Inspired from OLAP and in conformance with
visual analytics principles [4], we consider five visual modules
in V
EXUS: G
ROUPV
IZ, C
ONTEXT, S
TATS, H
ISTORYand
M
EMO. In G
ROUPV
IZ, an explorer examines a limited number
of groups to obtain one or more groups of interest. She can
then ask to navigate to other groups which are similar to
what she has already liked (i.e., interactivity). The explorer
preference, captured in the form of feedback, is illustrated in
C
ONTEXT. The sequence of selected groups is visualized in
H
ISTORY. The explorer can backtrack to any previous step in
H
ISTORY. The explorer may request to delve into more details
and observe group members. In this case, an exhaustive set of
statistics will be shown in S
TATS. At any stage of the process,
the explorer can bookmark a group or a user in M
EMO. The
analysis ends when the explorer is satisfied with her collection
in M
EMO, which serves as her analysis goal.
G
ROUPV
IZvisualizes k groups in the form of circles. It
is shown in previous research [11] that k 7 is an ideal
match for human perception capacity. The position of circles
is enforced by a directed force layout to prevent visual clutter.
The size of circles reflects the number of users in groups.
Circles are be color-coded by any attribute of choice (e.g., by
gender in Fig. 2) to provide immediate insights. The group
Data Prepara)on
User data
2D projec)on (t-SNE) lasso, demographic filters seed group seed group, parameters k-groupsVisual User
Explora)on
Visual Group
Explora)on
Analyst
Visual Analy)cs Interface
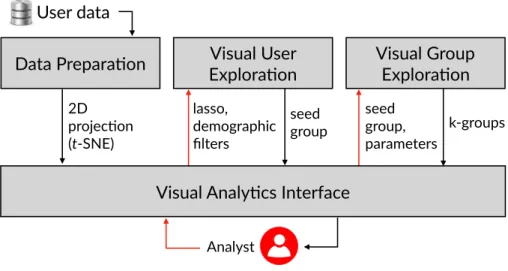
Figure 1: VugA components. The red arrows show inputs from the analyst and the black arrows reflect the communication among components.
3.3. Enable group exploration
230
Given a seed group, the system must provide a way to use it as a starting point in exploring the space of existing groups. The exploration should not confine the analyst to specific regions of the space. In VugA, the analyst can ask for similar/dissimilar groups. With this feature, the analyst can choose to maintain her train of thought by continuing to explore groups with similar
235
demographics and interests or could choose to jump in the space of groups via the dissimilarity feature.
3.4. Enable handshaking between user data exploration and group exploration This handshaking closes the loop between the two key components of user group analytics: analytics on users and analytics on groups. Analysts must be
240
able to switch from a user-centric view to a group-centric view and vice versa. In both cases, VugA relies on a data model that enables the efficient ingestion of user data and provides a visual interface to switch from user data to groups and vice versa.
4. The Components of VugA
245
VugA1provides a visual analytics interface that communicates with three components depicted in Figure 1: the Data Preparation component that admits raw user data and produces a 2D projection that is made available to the analyst; the Visual User Exploration component that takes as input a 2D projection produced by data preparation and possibly filters specified by the
250
analyst using a lasso tool or demographic attributes, and generates a seed group; the Visual Group Exploration component that admits a seed group and finds k similar/dissimilar groups (k is provided by the analyst). The visual analytics interface acts as an enabler to the components of VugA and allows seamless integration of user exploration and group exploration. It also enables a full
255
loop by allowing the analyst to select one or several groups out of the k groups returned by exploration as an input to the user exploration component to enable the inspection of their members and their statistics. We now describe the components of VugA in more detail. First, we discuss the Data Preparation component which renders the visual layout (Section 4.1). Then we provide an
260
overview of the visual analytics interface (Section 4.2). Last we present User Exploration and Group Exploration components (Sections 4.3 and 4.4). 4.1. Data Preparation
VugA supports user data from different domains. For this purpose, it uses a generic format that allows direct integration with the visual interface.
265
The format consists of four different tables: users U , items I, events E, and similarity features X. The table U contains user demographics (e.g., age, gender, occupation, etc.), I contains descriptions of items (e.g., movie or book information, medical treatments, etc.), E describes relations between users and items (e.g., review of a movie or book from a given user, a medical treatment for
270
a given user, etc.), and X describes features derived from user demographics. We represent derived data in a similarity feature space that contains an n-dimensional
record (where n is the number of genres) for each user, where similarity is defined as the distance between points in this space. We provide an example to explain how the similarity features are derived. Consider a dataset of movie reviews,
275
and two users A and B, both having reviewed 100 movies. Suppose user u1 reviewed 60 drama, 20 comedy, 15 romance, and 5 children’s movies. Similarly, user u2 reviewed 10 drama, 50 comedy, 25 romance, and 15 children’s movies. One way to compare users is to encode the genre of movies as a 4D record using the percentage of reviews per genre. In this case, assuming that the dimensions
280
are drama, comedy, romance, and children’s, the result record for u1 would be h0.6, 0.2, 0.15, 0.05i and for u2 h0.1, 0.5, 0.25, 0.15i. User similarity can then be computed using any metric in the feature space, such as Cosine and Pearson Correlation.
Analysts have access to both demographics and similarities through the
inter-285
face. However, instead of interacting with the similarity space in a complicated n-dimensional space, we project it into two dimensions using a dimensionality reduction technique called t-SNE [15], which is widely applied in areas such as machine learning, visual analytics, and data mining. Like other dimensionality reduction techniques, t-SNE positions points closer to each other in the 2D
290
projected space if their counterparts in the original n-dimensional space are also close. Many aspects impact the position of projected high-dimensional points. Ideally, projected points are the least overlapping possible while keeping similar points close to each other. t-SNE admits as input the number of iterations and perplexity. These two parameters dictate how the projection shapes up. In this
295
paper, we computed projections in trial-and-error iterations of varying parameter combinations to choose the one with a reduced projection error and a good separation of points (i.e., uncluttered view). Since the t-SNE computations are costly, the projection is performed offline by the Data Preparation component. Although extremely powerful, the effective use of t-SNE is challenging. The
300
guidelines proposed by Wattenberg and colleagues [39] suggest running several tests with varying values for t-SNE parameters. The first parameter is called perplexity, which roughly speaking, encodes a distance from a point to its
A F E
G
C D B
H
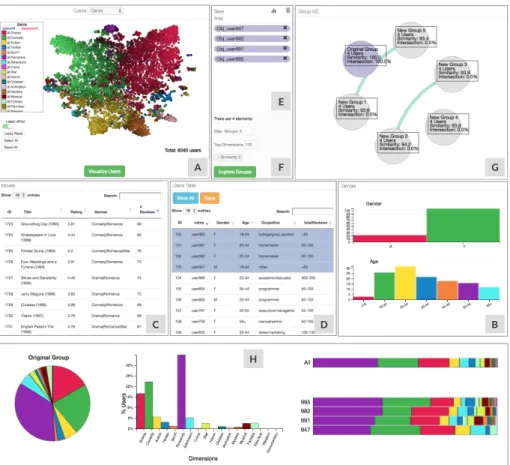
Figure 2: VugA visual interface displaying the MovieLens dataset. User selection can be done either in can be selected either in view A or B. Other views are Other areas include: items view (C), user description view (D), user selection area (E), group exploration configuration (F), group exploration results (G), and group charts (H).
neighbors that aims to balance between local and global aspects of the data. The second parameter is the number of iterations, which indicates the maximum
305
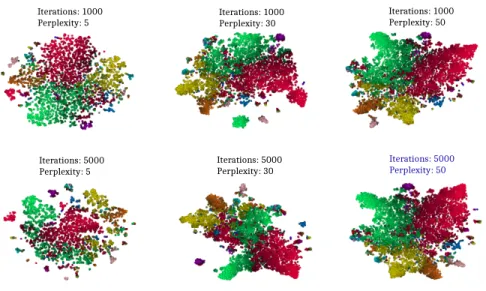
number of times an optimization process runs until a cost function C can be found optimal and adequate. According to experiments done in previous works [15], the recommended values for the number of iterations are 1000 and 5000 iterations, while for perplexity, the recommended values are 5, 30, and 50.
We ran several tests using a combination of these parameters and list the
310
Figure 3: Projection results using different t−SNE parameters in the MovieLens dataset. Iterations: 5000 Perplexity: 30 Iterations: 5000 Perplexity: 50 Iterations: 5000 Perplexity: 5 Iterations: 1000
Perplexity: 5 Iterations: 1000Perplexity: 30
Iterations: 1000 Perplexity: 50
resulting cost value for both datasets using a combination of perplexity (5, 30, and 50) and the number of iterations (1000 and 5000). Each combination was executed three times to account for variability in the results. We highlight for each dataset the minimum cost function value found. In the MovieLens dataset,
315
the optimal values correspond to the perplexity of 50 and 5000 iterations. In Fig. 3, we display the projection obtained for varying values of perplexity and the number of iterations in the MovieLens dataset. By comparing the distinct projections, we observe that the projection using the optimal parameters found in our tests (iterations = 5000 and perplexity = 50) created a projection that
320
does a better job in separating the users with a strong preference for the three main genre classes (drama-red, comedy-green and action-yellow.
4.2. Visual Analytics Interface
Figure 2 illustrates the visual analytics interface of VugA. The interface has distinct views to display information and statistics of users, configure group
325
formation and exploration, and display the generated groups. VugA uses a coordinated user interface that updates the information displayed after any
Table 1: Varying t − SN E hyperparameters (perplexity and nunber of iterations) for the MovieLens and BookCrossing datasets. Each configuration was executed three times. The configuration with the minimum cost function value is chosen to generate the projection.
Configuration Cost
# Run # Iterations Perplexity MovieLens BookCrossing
1 1000 5 1.802657 1.199160 2 1000 5 1.765758 1.203062 3 1000 5 1.778850 1.193867 1 5000 5 1.575450 1.026430 2 5000 5 1.556541 1.027299 3 5000 5 1.613056 1.025825 1 1000 30 1.693772 1.122926 2 1000 30 1.705552 1.134787 3 1000 30 1.673824 1.135139 1 5000 30 1.649885 1.097255 2 5000 30 1.672916 1.095400 3 5000 30 1.669642 1.087319 1 1000 50 1.570772 1.070013 2 1000 50 1.578098 1.077052 3 1000 50 1.5696902 1.074400 1 5000 50 1.5583727 1.051515 2 5000 50 1.5557487 1.040932 3 5000 50 1.5586364 1.043676 selection. Different views of this interface are explained as follows.
User projection view (A)displays a collection of points (from the tables X and E of user data), each corresponding to a user. The t-SNE projection defines
330
the position of users. We color-code points using a set of pre-defined mappings. Users can be selected in this view using a lasso tool.
Demographics view (B)displays statistics over the demographic attributes (from the table U of user data). Users can be selected directly over each demographic attribute, and the coordinated interface gets updated automatically
335
right after each analysis iteration.
(a)
(b)
(c)
(d)
(e)
(f)
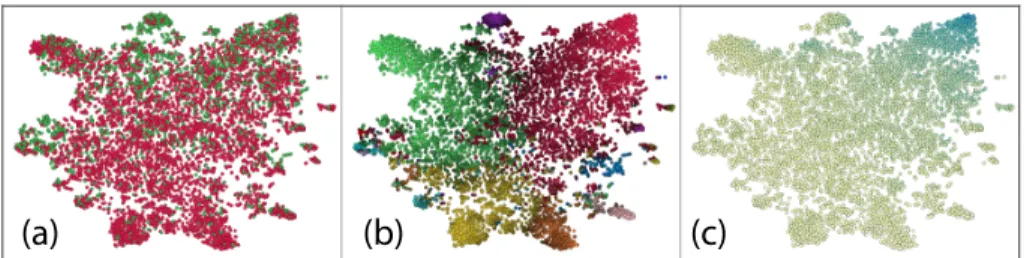
Figure 4: Variants of color mapping based on (a) gender (categorical scale), (b) dominant genre (categorical scale), (c) degree of genre dominance (continuous scale).
current selection of users. Items can be sorted according to any column in the table.
User description view (D)lists user’s detailed information (from the table
340
U of user data) in a table. Users can be sorted according to any column in the table.
User selection area (E) is a buffer that lists the users saved in the group formation phase (by the analyst) and which constitute the seed group for group exploration.
345
Group exploration configuration (F)is an area for configuring the group exploration parameters, including objective (similarity or dissimilarity) and the number of groups to return (k).
Group exploration results (G)is an area for displaying the results of group exploration.
350
Group charts (H)displays statistics about the seed and explored groups in the form of pie charts, bar charts, and stacked-bars.
The user projection view enables analysts to visually inspect similarities between users. Note that there is no notion of coordinate axes in the 2D projection, and the view reflects only the proximities. However, other visual
355
variables (i.e., color hue, brightness, transparency, and glyphs) are employed in the 2D view to providing more information about users. For instance, we use different color mappings to differentiate among users attributes. Analysts can
configure the interface to define the mapping between attributes and colors, color scales, and weights of color brightness. Figure 4 shows different configuration
360
settings, where each point depicts a user. The example on the left shows a categorical red-green color-coding, where gender is used for mapping. The middle example maps a categorical color table to each genre. The color of each point is defined by the dominant genre of its corresponding user. The dominant genre of a user is the one whose number of reviews is the largest. The color
365
weight of the point is also defined by the amount of dominance. For instance, if Drama is the dominant genre of a user covering 80% of her reviews, a bright red point (red is associated to Drama) represents this user in the 2D view. The example on the right features a continues color-coding mapped to the amount of genre dominance. Such color-coded views enable the comparison of all genres in
370
one place. We consider the middle example of Figure 4 as our default view in VugA’s interface.
4.3. Visual User Exploration
The input to User Exploration is the 2D projection of user data. This component supports the ability to explore statistics about users and build a seed
375
group out of individual users. This is done in two steps: selection and inspection. First, the analyst picks a subset of users either by selecting demographics or by using a lasso tool. Then she inspects the information and statistics provided for these users to handpick few users of interest, which constitute her seed group for further exploration.
380
User selection. Analysts can use two different views of VugA’s interface to select users or refine a previous selection: user projection view and demographics view, i.e., views A and B in Figure 2, respectively. Both views are coordinated, hence a selection on one reflects the other. Figures 5-A and 5-B illustrate the selection process using the user projection area. First, a lasso tool is
385
provided where analysts can draw freehand selections around the users in the projection. There is also a categorical selection which allows the analyst to choose dominating genres of interest. Figure 5-C illustrates the selection process
A B C
Figure 5: Selection methods for group formation: lasso selection in the user projection area (A), category selection in the user projection area (B), and demographics selection (C).
in demographics view, where attributes can be selected by clicking on their corresponding histogram bar (e.g., filtering users to college/grad students in
390
the figure). The selection process is composable, i.e., a later selection can add/remove users to/from an initial selection. For instance, a lasso selection can then be refined by selecting a few demographic attributes of interest.
User inspection. In Figure 2, views C and D are used for inspection. They list the items that the selected users are associated to (i.e., reviewed movies/books),
395
and demographics of those users, respectively. The analyst can handpick users of interest in the user description view (Figure 2-D). Handpicked users will be added to the user selection area (Figure 2-E). Group charts (Figure 2-H) displays some aggregated statistics (in the form of pie charts, bar charts, and stacked-bar charts) for the current selection of users in the user selection area. This
400
helps the analyst to see how insightful her current selection is. While the user
projection view (Figure 2-A) only convey genre dominance information, group charts provide more details in the form of distributions of different demographic attributes.
4.4. Visual Group Exploration
405
Group exploration admits as input a seed group returned by group formation and generates similar or dissimilar groups. Few parameters dictate the function-ality of group exploration. First, we review these configurable parameters, and then we discuss the process of group exploration.
Group exploration parameters. Analysts can configure the parameters of
410
group exploration in the “group exploration configuration” view (Figure 2-F). The first parameter, k, is the number of groups to return by the group explo-ration process. The second parameter (i.e., top dimensions) allows discarding negligible dimensions. The parameter specifies the percentage of the top most relevant dimensions of the seed group. For instance, if the selected users in the
415
user selection area expressed reviews on 18 different genres, then tuning this parameter to 90% would consider 16 most relevant genres for exploration. The parameter is set to 100% by default (i.e., use all dimensions). The third configu-ration parameter defines the objective of exploconfigu-ration, be it either similarity or dissimilarity. For instance, if the analyst sets k = 5, top dimensions to 100% and
420
similarity as the objective, then 5 similar groups will be generated as exploration options using all available dimensions of the seed group.
Group exploration process. Given a seed group, group exploration returns k similar/dissimilar groups and illustrate them in the “group exploration results” view (Figure 2-G). Each new group can become a seed group in the next
425
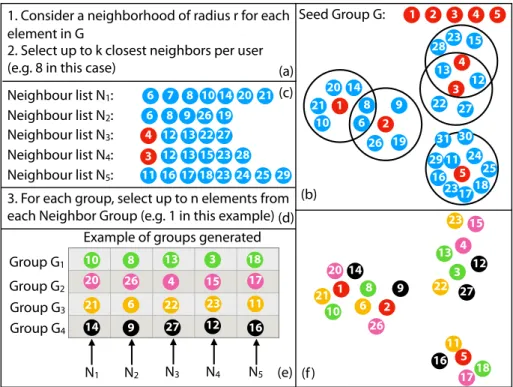
analysis iteration. Figure 6 illustrates the process of group exploration in VugA. For each user in the seed group, we compute all neighbor users in a radius r and then select the top-m closest/farthest neighbors, in case the objective is similarity/dissimilarity, respectively. Note that the similarity computation and comparison are performed in the original n-dimensional space. Then for each
user u, we obtain a list Nuwhich contains m neighbor users of u at the distance r. A candidate group can be generated for exploration by randomly selecting k users from neighbor lists. Other candidate groups will be generated in the same fashion but with no user intersection with previously generated groups. The parameters r and m define the “pool size” and “heterogeneity” of exploration,
435
respectively. The higher r and m are, new groups pick more heterogeneous users from a larger pool. Note that these parameters are not explicitly placed in the interface. However, analysts can tune these parameters in the back-end configurations. In our use cases, we set r to the 10% of the largest distance between a pair of users and m = 50 as a result of minimizing error in a k-fold
440
cross-validation.
VugA is generic and can incorporate different group exploration methods. In this paper, we focused on the similarity/dissimilarity exploration method as an intuitive way of sensemaking in user data. However, other methods can also be integrated in VugA, e.g., diversity exploration [14], contrast group
445
exploration [40], distribution exploration [41], and multi-objective exploration [1]. One of our future directions is to perform a thorough study on several exploration methods and their influence on user group analysis.
5. VugA in Practice
In this section, we demonstrate usage scenarios of VugA in exploring users
450
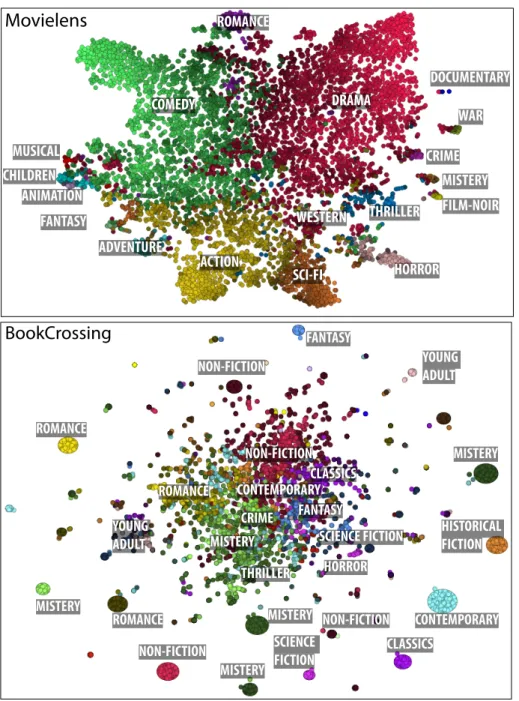
and exploring user groups in MovieLens and BookCrossing datasets. To focus on the practical aspects of our approach, we provide use cases for analysts in their role as domain experts (Section 5.1) and novices (Section 5.2). In each case, we define a hypothetical exploratory scenario and describe the exploration steps and the results obtained. In Figure 7, we show dominant genres for each
455
dataset in the projection to illustrate areas where a given genre dominates others. We used different sets of t-SNE parameters for each dataset to obtain the most uncluttered projection. For MovieLens, we use 5000 iterations and perplexity of 50. For BookCrossing, we use 1000 iterations and a low perplexity of
Neighbour list N1:
Seed Group G: 1 2 3 4 5
1. Consider a neighborhood of radius r for each element in G Neighbour list N2: Neighbour list N3: Neighbour list N4: Neighbour list N5: 1 7 20 21 10 2 3 4 5 9 12 15 16 1718 11 19 22 13 23 23 24 25 6 8 14 26 27 28 29 30 31 Group G1
2. Select up to k closest neighbors per user (e.g. 8 in this case)
Example of groups generated 3. For each group, select up to n elements from each Neighbor Group (e.g. 1 in this example)
20 21 6 7 8 1014 19 6 8 9 26 132227 12 131523 12 24 25 11 16171823 4 3 28 29 N1 N2 N3 N4 N5 Group G2 Group G3 Group G4 16 12 27 9 14 11 23 22 6 21 17 15 26 20 18 13 1 2 3 4 5 8 10 8 13 3 18 20 26 4 15 17 21 6 22 23 11 14 9 27 12 16 10 (b) (a) (c) (d) (e) (f)
Figure 6: Illustration of the group exploration process. In this example, four new similar groups are generated from a seed of group of five users (users 1 to 5).
5. A glance at the figures shows that Drama and Comedy are dominant in
460
MovieLens, while Non-Fiction and Mystery are the most reviewed genres in BookCrossing.
5.1. Finding Movie Critics
MovieLens is a movie review dataset2 consisting of over 1M ratings for 3,952 movies given by 6,040 users. User attributes are ID, name, gender, age,
465
and occupation. Movie attributes are ID, title, and the list of genres for the movie. The ratings relate a user to a movie and contain a score (from 0 to 5) which reflects the user’s opinion on the movie. As instructed in Section 4.1, first we build a feature space which encodes dominant genres. Since there are 18
ROMANCE ACTION THRILLER SCI-FI ADVENTURE COMEDY DRAMA FILM-NOIR CRIME WAR HORROR CHILDREN ANIMATION MISTERY MUSICAL FANTASY WESTERN DOCUMENTARY
Movielens
BookCrossing
ROMANCE NON-FICTION ROMANCE NON-FICTION MISTERY ROMANCE FANTASY FANTASY HISTORICAL FICTION CLASSICS CLASSICS THRILLER SCIENCE FICTION CRIME YOUNG ADULT YOUNG ADULT CONTEMPORARY CONTEMPORARY HORROR NON-FICTION MISTERY MISTERY MISTERY MISTERY SCIENCE FICTION NON-FICTIONFigure 7: Projection view for MovieLens and BookCrossing with dominant genres mapped over distinct regions.
different genres in MovieLens, the feature vectors have 18 dimensions, each
470
normalized by the total number of reviews.
Exploration task. Our goal in this use case is to gather a diverse set of reviews at the first screening of Drama and Comedy movies. We set out to identify a group of reviewers to achieve that goal. The generated group should contain 5 reviewers with Comedy as the dominant genre, another 5 reviewers whose
475
dominant genre is Drama, and a mix of 10 additional reviewers who differ from them either in demographics or in interests. In the following, first we describe the role of the analyst as a domain expert, and then illustrate how exploring users and groups in VugA enables the analyst to find a set of movie reviewers. Exploration as a domain expert. In this use case, we consider a domain
480
expert who has a rich knowledge about the exploration task, and also the attributes and the structure of the underlying data (i.e., MovieLens). However, it is often the case that the background knowledge is only subjectively available in the mind of the analyst, and is not formally represented in form a knowledge base. Hence it is almost infeasible for such analyst to directly query or filter out
485
data based on her needs. In this case, the analyst requires to interact with the system in several iterations to describe her needs and obtain relevant results. It is also crucial for domain experts to access details of their data in different levels of granularity, and the system should provide enough support to navigate between those different levels.
490
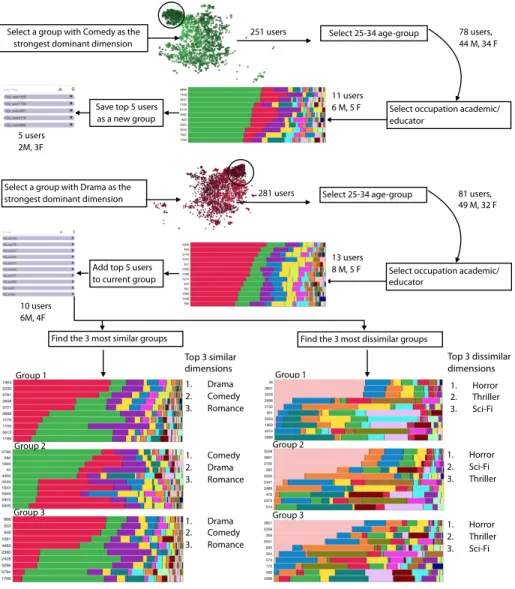
User exploration. We illustrate the exploration process in Figure 8. The domain expert starts the exploration by looking for reviewers that have Comedy as their dominant genre. For this purpose, she selects reviewers with Comedy as their dominant dimension using the categorical checkbox in the projection view. This selection limits the view to only green shaded points (the color green
495
is associated with the Comedy dimension). Then she employs the lasso tool to select a set of reviewers in the top-left area of the projection. The result of this selection is 251 reviewers, and the coordinated interface is updated to only display the information associated with the current selection. The expert
performs subsequent selections in the demographics to narrow down the age
500
range to 25-34 years old, resulting in 78 reviewers (44 male and 34 female). She also selects the occupation as academic/educator, resulting in a group of 11 reviewers (6 male, 5 female). She inspects the stacked-bar histogram for those 11 reviewers, which are ordered top-down by the dominance factor, and saves the top-5 reviewers in the user selection area (2 male and 3 female). The analyst
505
repeats the process above after changing the dominant genre to Drama. The result of this process generates an additional 5 reviewers, leading to a seed group of 10 reviewers (6 male and 4 female).
Group exploration. The exploration task is to find a mix of 5 to 10 reviewers who differ from the seed group in demographics and interests. Given the seed
510
group, the domain expert invokes the group exploration algorithm to generate the 3 most similar and the 3 most dissimilar groups. All generated groups are distinct from the seed group. By a visual comparison of the stacked bar chart of the seed group against all 3 most similar groups, she observes that the histograms are consistently similar, which is also confirmed by computing the
515
Kullback-Leibler divergence. Also, 2 out of 3 most similar groups have Drama, Comedy, and Romance (in this order) as dominant genres, while one group has Comedy, Drama, and Romance. The expert examines the demographics of reviewers in those 3 groups and handpicks 5 reviewers whose age > 34 and whose occupation differs from academic/educator. She adds those 5 reviewers to the
520
seed group resulting in a total of 15 reviewers who have similar dominant genres and different demographics. Similarly, she examines the most dissimilar groups to the seed group and identify Horror, Thriller, and Sci-Fi as their dominant genres. She handpicks 5 reviewers whose demographics are age within 25-34 and occupation is academic/educator. By adding those 5 reviewers to the seed group,
525
the analyst ends up with 20 reviewers in total.
Select a group with Comedy as the strongest dominant dimension
251 users Select 25-34 age-group 78 users, 44 M, 34 F
Select occupation academic/ educator
11 users 6 M, 5 F Save top 5 users
as a new group 5 users
2M, 3F
Select a group with Drama as the
strongest dominant dimension 281 users Select 25-34 age-group 81 users, 49 M, 32 F
Select occupation academic/ educator
13 users 8 M, 5 F
10 users 6M, 4F
Add top 5 users to current group
Find the 3 most similar groups Find the 3 most dissimilar groups
Top 3 dissimilar dimensions 1. Horror 2. Thriller 3. Sci-Fi 1. Horror 2. Sci-Fi 3. Thriller Top 3 similar dimensions Group 1 Group 2 Group 3 1. Drama 2. Comedy 3. Romance 1. Comedy 2. Drama 3. Romance 1. Drama 2. Comedy 3. Romance Group 1 Group 2 Group 3 1. Horror 2. Thriller 3. Sci-Fi
Figure 8: Exploring the MovieLens dataset to gather a diverse set of reviews at the first screening of Drama and Comedy movies.
5.2. Forming a Book Club
BookCrossing is a book review dataset3with 101,376 ratings for 46,380 books given by 8,167 users. Users have a unique ID, a name, a location, and age,
3
while books have an ID, a title, an author, a year of publication, a publisher and
530
a genre. Since the original BookCrossing dataset does not contain information on book genres, we append the genre information crawled from the Goodreads website4. Ratings relate a user to a movie (in a scale from 1 to 10). We built a feature space that encodes dominant book genres (in the same way we did for MovieLens).
535
Exploration task. Our goal in this use case is to build a book club for Romance that appeals to senior readers, to delay their memory decline [42]. We set out to identify the most popular authors among readers in that age range. We also look for books that received a high number of reviews among similar readers. In the following, first we describe the role of the analyst as a novice, and then
540
illustrate how exploring users and groups in VugA enables an agnostic analyst to build a book club.
Exploration as a novice. In this use case, we consider that the analyst does not have a rich knowledge about the task and the data structure, and she builds her knowledge by observing insights on users and groups. As the analyst’s
545
knowledge is built iteratively, it is of critical importance that the analyst receives the most interesting set of insights at each iteration. In other words, VugA should act as a “guidance mechanism” which helps the agnostic analyst make wiser decisions.
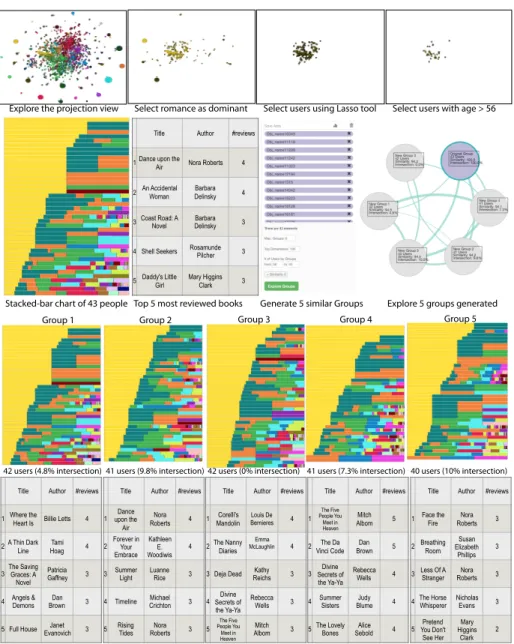
User exploration. We illustrate the exploration process in Figure 9. The
550
novice analyst starts by looking at the projection to obtain a bird’s-eye view of the data. Points colored in yellow have Romance as their dominant genre. To clean the projection view, she selects Romance, which filters the view to only show relevant points. Given the high number of points, she employs the lasso tool to select a subset of those points. Then the analyst refines her search to
555
only consider people above 54 years old. The result is a group of 43 reviewers who have as dominant genres Romance, Contemporary, and Historical Fiction.
4http://goodreads.com
She examines the contents of that group and notices that only 17 books out of 2,657 received more than 3 reviews! Since we are interested in popular authors, the analyst selects the top-5 most reviewed books only and find that Barbara
560
Delinsky has two books on that list. She marks her as an author of interest. Group exploration. Then the novice attempts to find additional popular authors of Romance books. To do that, she saves the group of 43 reviewers as a seed group and asks the algorithm to generate 5 similar groups, resulting in groups that contain about 40 reviewers each. The analyst examine the contents
565
of those groups carefully and find that one has no reviewers in common with the seed group and, 4 have up to a 10% overlap in reviewers. The analyst observes that the author Nora Roberts, who was present in the seed group, also appears in the generated groups four times with different books. That leads us to mark her as an author of interest. Additional authors, not in the seed group, like Dan
570
Brown, Mitch Alborn, and Rebecca Wells appear twice. She also marks them as authors of interest. The analyst observes additional two books : Divine Secrets of the Ya-Ya Sisterhood that has received a total of 7 reviews across all groups and The Five People You Meet in Heaven with a total of 8 reviews across all groups. She marks those as books of interest.
575
6. User Study
We performed a within-subject user study [43] to evaluate the usefulness of VugA in practice using the MovieLens dataset. We recruited 16 subjects each of which took the role of an analyst in the study. Initially, subjects were given an interactive tour of our tool (one minute, approximately). Then, they
580
were asked to complete five tasks which consisted in exploring the dataset and answering questions about the results they obtained. Subjects were also asked whether they encountered any problems during the execution of the task and had the opportunity of giving feedback. At the end, they were asked to complete a usability questionnaire [44].
585
Title Author #reviews 1 Dance upon the Air Nora Roberts 4 2 An Accidental Woman DelinskyBarbara 4 3 Coast Road: A Novel DelinskyBarbara 3 4 Shell Seekers Rosamunde Pilcher 3 5 Daddy's Little
Girl
Mary Higgins Clark 3
Explore the projection view Select romance as dominant Select users using Lasso tool Select users with age > 56
Stacked-bar chart of 43 people Top 5 most reviewed books Generate 5 similar Groups Explore 5 groups generated
42 users (4.8% intersection) 41 users (9.8% intersection) 42 users (0% intersection) 41 users (7.3% intersection)
Title Author #reviews 1 Where the
Heart Is Billie Letts 4 2 A Thin Dark Line HoagTami 4 3The Saving Graces: A
Novel Patricia Gaffney 3 4 Angels & Demons BrownDan 3 5 Full House EvanovichJanet 3
Title Author #reviews 1 upon the Dance
Air Nora Roberts 4 2 Forever in Your Embrace Kathleen E. Woodiwis s 4 3 Summer Light Luanne Rice 3 4 Timeline Michael Crichton 3 5 Rising Tides RobertsNora 3
Title Author #reviews 1 Corelli's
Mandolin BernieresLouis De 4 2 The Nanny Diaries McLaughlin Emma 4 3 Deja Dead ReichsKathy 3 4 Secrets of Divine the Ya-Ya Sisterhood Rebecca Wells 3 5 The Five People You Meet in Heaven Mitch Albom 3
Title Author #reviews 1 The Five People You Meet in Heaven Mitch Albom 5 2Vinci CodeThe Da BrownDan 5 3 Secrets of Divine
the Ya-Ya Sisterhood
Rebecca Wells 4 4 Summer Sisters BlumeJudy 4 5 The Lovely Bones SeboldAlice 4
Title Author #reviews 1 Face the
Fire Nora Roberts 3 2 Breathing Room Elizabeth Susan
Phillips 3 3 Less Of A Stranger RobertsNora 3 4 The Horse Whisperer Nicholas Evans 3 5 You Don't Pretend
See Her Mary Higgins
Clark 2
40 users (10% intersection)
Group 1 Group 2 Group 3 Group 4 Group 5
Figure 9: Exploring the BookCrossing dataset. In this case we explore a group of people that prefer Romance genres and are older than 54 years-old.
the impact of expertise on our user study, we assume that all our subjects are “partially informed users”, where they don’t necessarily have a full knowledge of the datasets and the tasks. However, we asked about their experience with
Figure 10: Boxplot of task questionnaire results using the Likert scale.
data visualization tools in pre-questionnaire, where we found that 44% have
590
knowledge of info-graphics used in websites and newspapers, 68% use traditional graphics techniques at work, 19% use data visualization tools at work, and 50% use data visualization in their research projects (experience choices were not exclusive in our study). We defined five tasks including common actions (such as selecting, filtering, and saving users), followed by group exploration and analysis.
595
Based on the categorization of visualization tasks in [45], we considered the following list of tasks in increasing order of difficulty.
• T1: Using the lasso tool, select users who have a strong preference for Sci-Fi movies. What are the most common demographics (gender, age group, and occupation) in the selected group?
600
over the highest bar to narrow down the selection of users. Save the selected users in the Save Area. How many users have you obtained? What are the three most dominant genres in this group of users?
• T3: The list of saved users corresponds to your seed group. In the group
605
exploration area, generate n groups of similar users. Inspect the new groups and choose one of the new groups. Find films that appear both in the seed group and in the new group chosen. Among those, identify the two movies with the highest number of reviews.
• T4: Using the groups generated in T3, explore the genre charts for the original
610
and the new group. Movie genres in the stacked bar charts are presented in order of dominance. Are these stacked bar charts different across groups? If so, describe what you observed.
• T5: Generate groups that are most dissimilar in relation to the seed group. Explore these groups and identify the three dominant genres in the dissimilar
615
groups.
Each task contains questions which help us assess whether the subject was able to achieve the intended goals of the exploration. Although some questions did not have an exact answer (as the answer depended on the actual selection of users made by the subject), we were able to have an inkling of the possible
620
range of answers – we carried out the tasks ourselves a number of times and made notes about the possible answers.
For each task, we recorded the subjects’ comfort in completing the task using a Likert scale, from 1 (difficult) to 5 (easy). With the user study, we can assess whether the design considerations discussed in Section 3 were achieved.
625
• Represent and visualize user demographics and rating data (Section 3.1) – This goal was measured in tasks Tasks T1 and T2. The questions in T1 were answered correctly by 15 out of 16 subjects. In T2, one of the subjects reported the total number of users rather than the number of selected users, and the same subject who had a problem understanding T1, also reported
630
movie genres that were not in the possible range of correct answers. Thus, for T2 we have 15 subjects with correct results. The successful completion of T1 and T2 showed that this design goal was met.
• Enable filtering and group formation (Section 3.2) – T3 assessed whether subjects’ were able to perform these tasks in VugA. Again, only one of the
635
subjects reported implausible answers to the questions associated with T3. These results confirm that this design goal was also met.
• Enable group exploration (Sections 3.3 and 3.4) – Tasks T4 and T5 evaluated these design considerations. All answers to questions associated to these tasks were plausible, indicating that the visual comparison of groups using stacked
640
bar-charts allowed the analysis of (dis)similarity across groups.
Figure 10 shows the boxplot of the task completion assessments of the subjects in the Likert scale. We observed that subjects felt comfortable in completing all five tasks, with a median value equal to or greater than 4. We ran an Analysis of Variance (ANOVA) to test whether there was a difference in mean across the five
645
tasks. The calculated p-value was 0.068, which means that we accept the null hypothesis stating that there were no differences across tasks at a 95% confidence level. Since the tasks were in increasing order of difficulty, we attribute this result to two possible causes: the learning effect experienced by subjects as they progressed in the exploration tasks, or simply because all tasks were fairly easy
650
for them to accomplish.
At the end of the tasks, users were asked to complete the System Usability Scale (SUS) questionnaire [44], which is a widely used tool for evaluating usability. VugA scored 76.4 points. A study by Sauro et al. [46] analysing 500 SUS questionnaires concluded that a SUS score greater than 68 are above average and
655
that a score of 74 converts at percentile rank of 70%. Thus, a score of 76.4 means that VugA fared better than at least 70% of the systems analysed by the authors. Figure 11 shows a stacked bar chart of all 16 questionnaires completed by the subjects of the user study. For visualization purposes, agreement/disagreement with positive/negative questions on a scale from 1 to 5 were converted to a scale
3 3 6 6 10 11 3 4 4 7 12 4 7 3 5 3 7 7 10 6 0 8 2 6 1 1 4 4 2 2 1 1 1 1 0 1 2 1 0 1 0 0 0 0 0 0 0 0 0 0 1 2 3 4 5 6 7 8 9 10 ++ + 0 ‐ ‐‐
Figure 11: Results for System Usability Scale questionnaire.
from ‘- -’ to ‘++’, according to the opinion polarity they conveyed. No subject has given a strongly negative score to any of the ten questions. Out of the ten questions, the most positive opinions were regarding questions 5–“I found the various functions in this system were well integrated”, for which there was a strong agreement and 6–“I thought there was too much inconsistency in this
665
system”, for which there was a strong disagreement. Most negative opinions were given in response to question 2–“I found the system unnecessarily complex ”, for which half the subjects chose the ‘neutral’ answer, one subject gave a negative, score and the remaining seven gave positive scores. We believe this happened because most visualization systems that the subjects are used to interacting are
670
simpler than VugA.
Limitations. Despite the positive results of the user study, the feedback given by some subjects have pointed out limitations of VugA. Two subjects mentioned that the need for scrolling up and down a few times in order to complete tasks T4 and T5 made them lose focus. One subject suggested that movie genres
675
should be listed alphabetically. Finally, one subject mentioned she would have liked to select multiple groups to compare (and not just two).
7. Summary and Discussion
We described VugA, a visual enabler for user data exploration and group exploration. We provided representative tasks and showed how VugA helps
680
analysts achieve different goals. Despite its strong points, VugA has limitations. Some subjects in the user study identified specific features they wish were adjusted. Furthermore, the number of colors that we can assign to the circles in the Projection Area is limited by the number of colors a human can perceptually distinguish. In this article, we used a maximum of 18 colors/categories and
685
feel that this would upper bound – studies recommend using no more than ten colors [47]. In addition, the number of users and groups that can be clearly displayed depends on the size of the screen – e.g., in a small laptop screen, a user can comfortably see at most ten groups. We designed our user interface to accommodate a small graph (with up to 20 groups) because the group exploration
690
task we envisioned were also limited by a small number of groups the user wants to simultaneously compare. If necessary, increasing this limit would require scaling the graph drawing technique to support the display of larger graphs, as discussed in the work of Graves [48].
A user study is limited to qualitative analyst-centric evaluations. Hence the
695
need for a principled evaluation methodology arises, which we consider as a future perspective. Despite the established body of related work for evaluating user data exploration, group exploration, and visualization alone, there is no evaluation methodology for their combination [4, 49, 50]. A valid question is whether we can evaluate VugA with a combination of methods proposed to
700
evaluate its components? Adapting exploration-based and visualization-based evaluation protocols (i.e., quality and user experience axes) does not cover its quantitative aspects (e.g., how fast its formation method performs.) While user studies alone are often biased and incomplete [51], we discuss four novel opportunities of all-together evaluation of user exploration, group exploration,
705
and visualization, as follows.