HAL Id: hal-01427294
https://hal.sorbonne-universite.fr/hal-01427294
Submitted on 9 Jan 2017HAL is a multi-disciplinary open access archive for the deposit and dissemination of sci-entific research documents, whether they are pub-lished or not. The documents may come from teaching and research institutions in France or abroad, or from public or private research centers.
L’archive ouverte pluridisciplinaire HAL, est destinée au dépôt et à la diffusion de documents scientifiques de niveau recherche, publiés ou non, émanant des établissements d’enseignement et de recherche français ou étrangers, des laboratoires publics ou privés.
Surface-Driven Magnetotransport in Perovskite
Nanocrystals
Ha Le Thi N’Goc, Louis Donald Notemgnou Mouafo, Céline Etrillard,
Almudena Torres-Pardo, Jean-François Dayen, Simon Rano, Gwenaëlle
Rousse, Christel Laberty-Robert, Jose Gonzales Calbet, Marc Drillon, et al.
To cite this version:
Ha Le Thi N’Goc, Louis Donald Notemgnou Mouafo, Céline Etrillard, Almudena Torres-Pardo, Jean-François Dayen, et al.. Surface-Driven Magnetotransport in Perovskite Nanocrystals. Advanced Ma-terials, Wiley-VCH Verlag, 2017, 29 (9), pp.1604745. �10.1002/adma.201604745�. �hal-01427294�
1
Surface-driven magnetotransport in perovskite nanocrystals
Ha Le Thi N’Goc, Louis Donald Mouafo Notemgnou, Céline Etrillard, Almudena Torres-Pardo,Jean-François Dayen, Simon Rano,Gwenaëlle Rousse,Christel Laberty-Robert, Jose Gonzales Calbet, Marc Drillon, Clément Sanchez, Bernard Doudin,David Portehault Dr. H. L. Thi N’Goc, S. Rano, Prof. C. Laberty-Robert, Prof. C. Sanchez, Dr. D. Portehault Sorbonne Universités, UPMC Univ Paris 06, CNRS, Collège de France, Laboratoire de Chimie de la Matière Condensée de Paris (CMCP), 11 place Marcelin Berthelot, F-75005, Paris, France
D. Mouafo Notemgnou, Dr. Céline Etrillard, Dr. J.-F. Dayen, Prof. M. Drillon, Prof. B. Doudin
Institut de Physique et Chimie des Matériaux de Strasbourg, Université de Strasbourg, CNRS UMR 7504, 23 rue du Loess, BP 43, F-67034 Strasbourg Cedex 2, France
Dr. A. Torres-Pardo, Prof. J. Gonzales Calbet
Departamento de Química Inorgánica I, Facultad de Químicas, Universidad Complutense CEI Moncloa, 28040 Madrid (Spain)
Dr. G. Rousse
Sorbonne Universités, UPMC Univ Paris 06, Chimie du Solide et de l’Energie, UMR 8260, Collège de France, 11 place Marcelin Berthelot, 75231 Paris Cedex 05, France
Prof. J. Gonzales Calbet
Centro Nacional de Microscopía Electrónica, Universidad Complutense, 28040 Madrid, Spain
Corresponding authors:
E-mail: [email protected]
2
Abstract
Unique insights into magneto-transport in 20 nm ligand-free La0.67Sr0.33MnO3 perovskite
nanocrystals of nearly perfect crystalline quality are provided by using state-of-the-art
electron microscopy and transport studies. A chemically altered 0.8 nm-thick surface layer
results in exceptionally large magnetoresistance at low temperature, independently of the
degree of spin polarization of the ferromagnetic fraction of the particles. This discovery sheds
new light on how the nanoscale impacts magneto-transport in a material widely spread as
electrode in hybrid spintronic devices.
3
The manganite perovskite of composition La0.67Sr0.33MnO3 (LSMO) has been of prime
importance for spin electronics.[1] Ferromagnetic and metallic up to room temperature, it has
been claimed to possess a fully spin-polarized density of states at its Fermi level. Hence, it
should be ideally suited as spin injector or detector for devices taking advantage of the spin
degree of freedom of current carriers. While experiments unambiguously show that the
diffusive current is highly spin polarized in the bulk material,[2] the degree of spin polarization
of the tunneling current remains controversial.[3] This surface sensitive quantity, expected to
reflect the spin-split density of states, usually exhibits values in the 40-60% range, with
exceptional larger values (between 80 and 90%) found only at low temperatures on samples
grown under very specific conditions.[4]
Its chemical stability makes LSMO the ‘gold standard’ for spin transport through
molecular moieties. Hybrid organic-inorganic spintronics studies have relied on it extensively,
with the vast majority of successful devices making use of LSMO as one of the electrodes.[5]
Within these devices, interfaces between LSMO and the organic medium dominate transport
properties. The properties of these open surface electrodes exposed to atmosphere and
solvents are however hard to reconcile with those of epitaxial (buried) interfaces in thin films
grown under stringent high vacuum or controlled oxygen pressure conditions. Especially,
quantitative measurements from surface studies[6,7] require measurements over large areas due
to the limited sensitivity of experimental tools, so that nanoscale variations of electrical
transport properties are not reported,[8] thus leaving an open question: how does spin transport
occur at the surfaces and interfaces of LSMO nanostructures and how does it impact hybrid
spintronics?
Due to increased surface-to-volume ratio, LSMO nanoparticles should be ideal
systems to unravel physical properties that are highly surface-sensitive, in particular
magnetism and electrical transport. They also enable addressing long-term stability of
4
manganites also open the door to magnetic properties tuning[9] or electronic phase separation
(EPS) control.[10,11] These recent examples demonstrate the key relevance of manganite
nanoparticles for fundamental understanding and insights into applicability of these materials
in the field of spin electronics. However, such studies require defined and
well-crystallized nano-objects, attaining the structural quality of epitaxial thin films. Reported
synthesis processes do not meet such stringent requirements, as LSMO nanoparticles obtained
mainly through ball milling[12] or the combination of the sol-gel process and combustion
reactions, exhibit significant amounts of defects and unknown surface composition and
properties.[13–15]
We highlight herein remarkable low temperatures spin transport behaviour of LSMO
nanomaterials by using an original combination of a dedicated colloidal synthesis of high
crystalline quality nanocrystals, and a device ideally suited for robust magnetotransport
studies through a small number of nanoparticles. Cube-shape LSMO nanocrystals of about 20
nm in size are synthesized at the gram-scale in an inorganic molten salt that provides well
defined, ligand-free surfaces with very low amounts of defects, in contrast to previous
reports.[13–17] State-of-the-art analytical scanning transmission electron microscopy (STEM)
and magnetometry studies provide a clear picture of particles having core-shell properties.
The remarkable structural quality of our samples makes possible atomic-resolved electron
microscopy imaging of the core and the surface. We thus provide the first quantitative insight
into chemical deviations from a perfect LSMO material and show that they are limited to a
surface shell of less than 1 nm thickness. Unprecedented high magnetoresistance (MR) is
observed at low temperatures. We demonstrate that such large effects cannot rely on the
half-metallic character historically used to explain MR properties in bulk polycrystalline LSMO[18]
and magnetic tunnel junctions.[19] These findings bring therefore new perspective on the
problem of spin transport in LSMO, especially on its properties that are robust upon exposure
5
LSMO nanocubes are synthesized from metal nitrates in molten potassium nitrate at
600 °C for 1 h (see the Methods section). The heating profile was adjusted to optimize a
narrow particle size distribution. Using a high temperature ionic molten salt enables relatively
large-scale synthesis as more than 1 gram of powder is readily obtained in a single lab-scale
batch. The resulting black powder is exposed to water during the purification step and stored
under ambient atmosphere. X-ray powder diffraction reveals the typical rhombohedral
perovskite structure of the resulting unstrained LSMO with a= 5.50387(15) Å, c= 13.3451(5)
Å cell parameters from Rietveld refinement, in agreement with tabulated values (see
Supplementary Information (SI) Figure S1 and Table S1).[20] Hence, the particles can be
considered strain-free. The unit cell volume is evaluated at 350 Å3, also in very good
accordance with the expected structure and composition.[20] Note that the XRD Bragg peaks
present a typical Lorentzian size broadening leading to an estimated crystallite size of 16(3)
nm. Elemental analysis by Inductively Coupled Plasma Optical Emission Spectrometry
(ICP-OES) yields a Sr:La ratio of 0.51, close to the ideal La0.67Sr0.33MnO3 composition and that
agrees with the value expected from the initial ratio of La and Sr precursors. High resolution
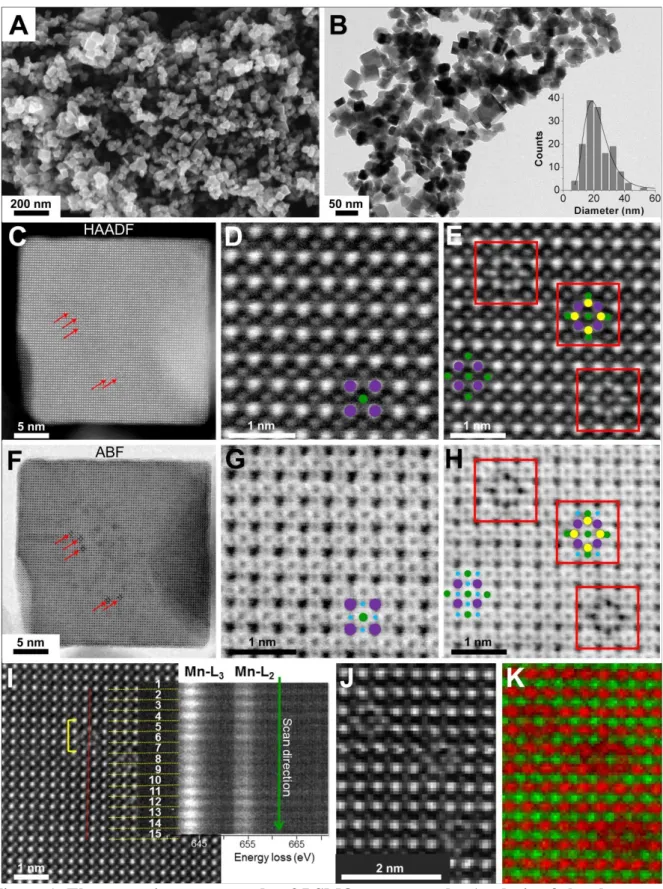
SEM (Figure 1A) shows that the powder is predominantly made of 15-30 nm nanocubes, as
confirmed by TEM and the corresponding size distribution (Figure 1B). The maximum of the
statistics is measured at 21 nm.
Our samples present a unique advantage over thin films for electron microscopy
investigations, as they do not require any invasive (cutting, milling) sample preparation
procedure. In order to get deeper insight into the structure of each nanoparticle, atomic
resolution STEM images (Figure 1C-K) have been recorded on an aberration-corrected
transmission electron microscope operating at 120 kV, in order to limit beam damage to these
potentially fragile nanostructures. Z-contrast images were acquired in the high angle annular
dark field (HAADF) mode to highlight heavy elements La, Sr and Mn (Figure 1C-E), and in
6
detection modes confirm the perovskite structure. The few crystalline defects observed in the
core (Figure 1E and 1H) are identified as inclusions of cubic La2O3 (see detailed discussion
in SI) that do not disturb the high crystalline quality of the perovskite. According to the
crystallographic orientation (Figure 1C-D and 1F-G), The nanocubes exhibit {001}cubic facets
of the ideal cubic perovskite structure, corresponding to the {012} faces of the rhombohedral
LSMO structure. The mean oxidation state of manganese was measured by high energy
resolution electron energy loss spectroscopy (EELS), along line scans in the particles cores
(Figure 1I and S2). The intensity ratio of the Mn-L3 and Mn-L2 lines was used to quantify the
average oxidation state versus a calibration curve from references of known oxidation states
Mn2+, Mn3+ and Mn4+ (Figure S3 and Table S2). Measurements over different scan lines
show that the core is very homogeneous, with an average Mn oxidation state of +3.3 ± 0.1, in
good agreement with the value of +3.34 expected from the La/Sr ratio measured by elemental
analysis on the whole batch of particles. In summary, all data demonstrate that the
nanoparticles cores exhibit the expected structure and composition of unstrained LSMO.
7
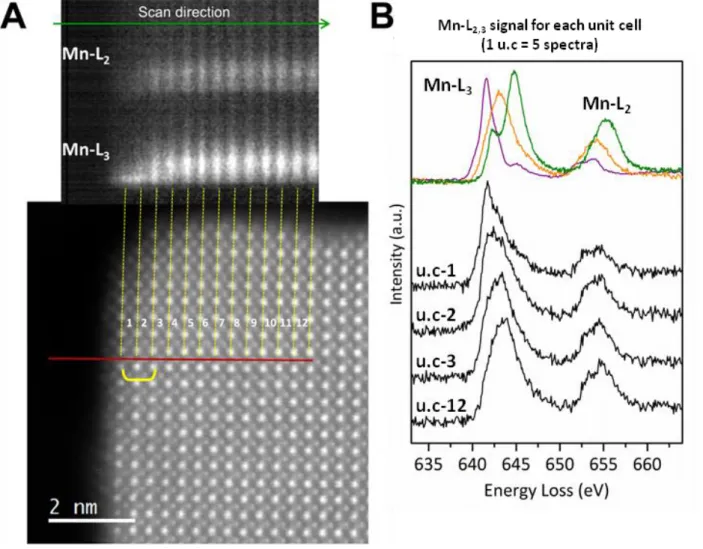
Figure 1. Electron microscopy study of LSMO nanocrystals: Analysis of the shape and the particles core. (A) SEM and (B) low magnification TEM images of LSMO particles
showing the homogeneous nanocube morphology, (B insert) TEM size distribution of the nanocubes with lognormal distribution. STEM-HAADF images of (C) a whole nanocube, (D) its crystalline perovskite core and (E) few defects observed in the core. STEM-ABF images (F-H) have been recorded simultaneously with the STEM-HAADF pictures (C-E). Purple, green, blue and yellow disks highlight La/Sr, Mn, O and La atomic columns, respectively. (I) STEM-HAADF image of a part of the core where high energy resolution EELS spectra have
8
been recorded along a scan line (red line). Mn-L2,3 EELS spectra for each unit cell are shown
in two dimensions. They are obtained by averaging the 5 spectra recorded over each unit cell. The yellow bracket highlights a defect on the 5th, 6th and 7th unit cells. (J) STEM-HAADF image and (K) corresponding atomic resolution mapping obtained by summing the Mn-L2,3
(green) and La-M4,5 (red) EELS maps.
Magnetization curves (Figure 2a) confirm that the particles are ferromagnetic and
suggest a two-phases magnetic behaviour with the superposition of a ferromagnetic-like
component with a paramagnetic-like phase made of disordered spins. Such systems in
sub-100 nm nanoparticles are often interpreted in terms of a ‘core’-‘shell’ model of the
magnetization of nanoparticles.[21] A more quantitative analysis, illustrated in Figure 2b, uses
an approximation of the low-temperature magnetization curve:[22] 𝑚 (𝐵) = Θ(𝐵)𝑚𝐹+ ℒ(𝛼𝐵)𝑚𝑃, (1)
where the magnetization 𝑚(𝐵) is the superposition of a ferromagnetic curve Θ(𝐵) for the expected ‘core’ of the particles (with saturation magnetization 𝑚𝐹) and a paramagnetic-like contribution described by a Langevin function with saturation value (at infinite field value) of
𝑚𝑃. The pre-factor 𝛼 = 𝑘(𝑇+𝑇𝜇
0), includes an effective temperature correction T0 that describes
interactions between moments, expected antiferromagnetic coupling in manganites, with resulting overall paramagnetic-like behaviour.[22] We performed high-fields curves fittings
between 1.8 and 50 K, resulting in estimating the values of T0 ≈ 100 K and ≈ 10 B, which
correspond to the magnetic moment of ∼3 Mn ions, reflecting interactions between Mn
nearest neighbours. The ferromagnetic component (B) is calculated as the difference
between the total measured magnetic moment and the fitted Langevin function (Fig. 2B). It dominates the ‘low field’ magnetization response. The paramagnetic-like contribution
dominates the ‘high-field’ magnetization response and illustrates a resulting sample
magnetization difficult to saturate. The ferromagnetic component shows a magnetization of
9
Breaking the symmetry at the surface of the material, as well as possible changes in the Mn
oxidation states near the surface related to oxygen vacancies, may disturb the ferromagnetic
double exchange Mn3+ - Mn4+ mechanism towards antiferromagnetic interactions, and result
in the so-called ‘dead magnetic layer’[23] or surface antiferromagnetic /spin glass-like
phases[24] reported for thin films of LSMO, in agreement with the magnetic ‘core’-‘shell’
model usually considered to describe the magnetic properties of sub-100 nm nanoparticles.[21]
In this approximation, for particles of ∼20 nm size, a shell thickness would extend up to 4.0 ±
0.5 nm. Thin films typically exhibit 2 nm-thick dead layers,[25] with larger thicknesses when
grown on non-epitaxial substrates[26] while smaller values, down to 1 nm, have been reached
on optimized strain-controlled epitaxial thin films.[27] The two components description of the
data captures the key idea of nanoparticles made of two magnetic phases. Coexistence of
electronic phases is recognized as a general phenomenon under the term electronic phase
separation (EPS). Generally, EPS stems from the peculiar interplay between several orderings
intrinsic to complex systems, like manganite perovskites, and can persist far from the bulk
transition temperature.[28] For compounds prone to phase segregation, the EPS length scale
can reach the 500-800 nm range.[11] We are not aware of unambiguous experimental insight
into the EPS length scale in LSMO, except that it should be much smaller, not exceeding the
10 nm range.[29,30] Hence, the two-phase model extracted from magnetic measurements is
coherent with the EPS model. In our specific nanoparticle configuration, we expect the
paramagnetic-like phase to dominate at the surface of the particles (as in thin films), while the
ferromagnetic component is likely located in the core, thus pinning the EPS in a core-shell
structure.[21] The larger volume fraction of the shell compared to films illustrates how
free-standing nanoparticles amplify the proportion of surface atoms relative to bulk ones. This
suggests that LSMO presenting open surfaces should exhibit significant surface-sensitive
10
Figure 2. Magnetic properties of LSMO nanocubes. (A) Magnetization curves at several
temperatures. (B) Decomposition of the magnetic signal at 1.8 K into a ferromagnetic core component (blue curve) dominant at low fields and a paramagnetic-like shell (red curve) dominant at high field (fitted on the experimental grey curve between 3 and 7 Tesla field 0H,
light blue curve). Inset is a scheme of a core-shell nanocube, with aligned core magnetic moments.
Electrical characterization of nanoparticles assemblies have been performed on
samples made by drop-casting a concentrated suspension of nanoparticles in ethanol over
electrodes separated by a very short distance (Figure 3A). We take advantage of our approach
of fabricating reliable wide (20 to 100 m) Au electrodes facing each other and separated by
80 ± 10 nm distance.[31] This allows robust and reproducible electrical probing of samples
with large resistivity. This electrode geometry therefore provides straightforward
experimental access to the average resistance value of 3-4 particles in series (Figure 3B-C).
Under an applied magnetic field, the samples exhibit a remarkably high change of resistance,
reaching one order of magnitude. Note that the MR data (Figure 3B-C) are recorded under
rather large voltage bias of 2 V, essentially to improve data precision recording for these
samples of high resistance. Larger MR values are found at smaller bias (see SI, Figure S4).
The measurements are reproducible within 10% from sample to sample. Devices are stable
over months when left under ambient conditions. We only observed a significant decrease of
11
resistance values) when nanoparticles were left for more than one month in ethanol prior to
drop-casting on devices.
Figure 3. Electrical properties of LSMO nanoparticles. (A) Top-view SEM picture inset
illustrating the device, made of two gold electrodes facing each other, separated by a 80 nm trench and bridged by ensembles of LSMO nanocubes. (B, C) Magnetoresistance curves at several temperatures for an applied bias of 2 V. (D) Normalized magnetoconductance (from B and C) as a function of the sample magnetic moment (Figure 2A), with bottom coloured areas as a reminder of the dominant magnetic nanoparticles component contributing to the moment (blue: ferromagnetic core, red: paramagnetic-like shell). (E) Normalized magnetoconductance as a function of the fitted paramagnetic-like ℒ(𝛼𝐵)𝑚𝑃 shell magnetic moment (see
Equation 1, Figure 2B).
The large change of resistance, with a typical factor 8 under large applied field and
reaching even 20 under smaller voltage bias values (Figure S4), cannot be explained by a
simple model of spin-polarized tunnelling between neighbouring particles. Indeed, under the
hypothesis that we are probing an ensemble of particles with expected random magnetic
12 should follow the formula:
𝑀𝑅 =𝑅(𝐵)−𝑅(0)𝑅(0) = 1+𝑚12𝑃2 , (2)
where m denotes the normalized magnetization value and P the (tunnelling) spin polarization.
Under the hypothesis of tunnelling between perfectly spin polarized half-metals, Eq. (2) limits
the MR to 50 % (or a doubling of the magnetoconductance). Interactions between adjacent
particles can lead to deviations from random neighbour magnetic alignment, but this model
remains hard to reconcile with our data showing a magnetoconductance more than 4 times
larger than the maximum expectation of Eq. (2). Coulomb-blockade effects, and in particular
cotunnelling enhancement,[32,33] cannot explain our high MR values as well, especially as they
persist up to large voltage bias (higher than 1 V/junction, see Figure S4), largely exceeding
all estimates of Coulomb blockade energy values.
The key experimental results indicating that the (half)-metal ferromagnetic component
of the nanoparticles do not contribute to the MR are shown in Figure 3D, which illustrates
how resistance evolves with the sample magnetization: it shows negligible variation when the magnetization change relates to the core particles, and varies approximately like 𝑚𝑃2 at higher
fields (Figure 3E).
Remarkably, all measurements between 1.5 and 150 K merge onto a single master
curve (Figure 3D), even though the sample resistance changes by three orders of magnitude,
and the MR ratio by a factor 8 (Figures 3B and C). This key result shows that our low
temperatures MR behaviour is strikingly different from what is documented for bulk LSMO
samples ranging from single-crystals down to nanocrystalline materials. Hwang et al.[18]
reported a significant low-field change of the resistance (LFMR) that was attributed to the
alignment of LSMO domains in the bulk and to the tunnelling between highly spin polarized
domains or grains. On the contrary, the high-field magnetoresistance (HFMR) they reported
13
domains. The LSMO nanocubes exhibit a completely different behaviour with negligible
LFMR. Hence, the magnetization process that aligns the core magnetization of our
nanoparticles, resulting in more than half the magnetization scale in our applied field window,
does not impact the sample resistance. In our case, the large field necessary to align the
paramagnetic-like component changes the sample resistance value drastically and results in a
huge HFMR. The master curve in Figure 3D illustrates how the amplitude of the MR simply
reflects the degree of paramagnetic alignment reached at maximum applied field. The MR
therefore does not rely on tunnelling from/to the half metallic core of LSMO.
To explain such peculiar behaviour, we propose that the observed magnetoresistance
in assemblies of nanocubes originates from a mechanism similar to the colossal
magnetoresistance (CMR), well-documented for manganites close to their Curie
temperature.[1] CMR is the very large change of resistance that occurs under modifications of
the magnetic alignment of neighbour Mn cations coupled ferromagnetically through the
double exchange mechanism in Mn3+-O-Mn4+ units. The charge transfer probability is
enhanced in the magnetically-aligned state. CMR therefore relates to the huge change of
resistance near the magnetic transition between disordered (usually paramagnetic) and
ordered (usually ferromagnetic) phases. The corresponding change in conductivity stems from
the insulator-to-metal transition as the material goes through magnetic ordering, at around
360 K for LSMO,[1] where a typical one order of magnitude change of conductivity is
observed under high magnetic fields (typically 10 T). In our case, magnetic alignment,
especially at the nanoparticles surfaces, is forced under high magnetic fields applied at low
temperatures, even though the material is far from its bulk transition to a paramagnetic state.
Such behaviour can be related to the magnetization configuration in the LSMO nanocubes
described as a two-phase material. Electrical measurements provide therefore further support
to a phase-separation model, with the magnetic field driving the paramagnetic insulating
14
shown on the I-V curves (Figure S5) with a power-law expression of the current at large bias,
which is reminiscent of multi-step tunnelling transport through localized states.[34] Such a
model has been invoked to explain the properties of perovskite thin films with artificial grain
boundaries.[35] Our well-defined single-crystal nanoparticles with small grain size therefore
provide insight into electrical properties dominated by charge transfer between conductive
metallic islands through insulating barriers. The core of the particles, expected to exhibit
magnetic ordering, should therefore be metallic-like, while the spin disordered nanoparticles
surfaces should play the role of insulating shells. A more precise analysis of the structural
properties of the LSMO nanocubes outer surfaces is needed to confirm this hypothesis. It is
performed below by using state-of-the-art STEM.
To address the core-shell picture suggested by magnetic and electrical measurements,
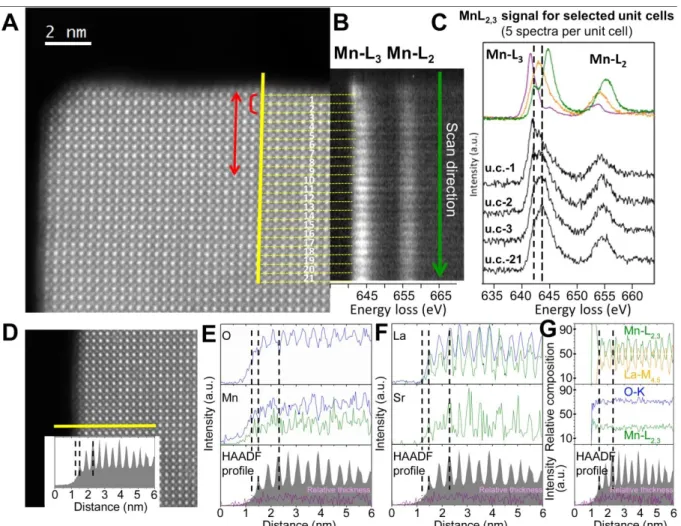
the surface structure has been assessed by high-resolution STEM techniques. First,
STEM-HAADF (Figures 4 and S6-S7) shows that contrary to many other oxide nanoparticles, the
crystal structure is retained right up to the outer surface layer. Hence, the 2-phase magnetic
structure does not originate from surface amorphisation. Chemical information was then
15
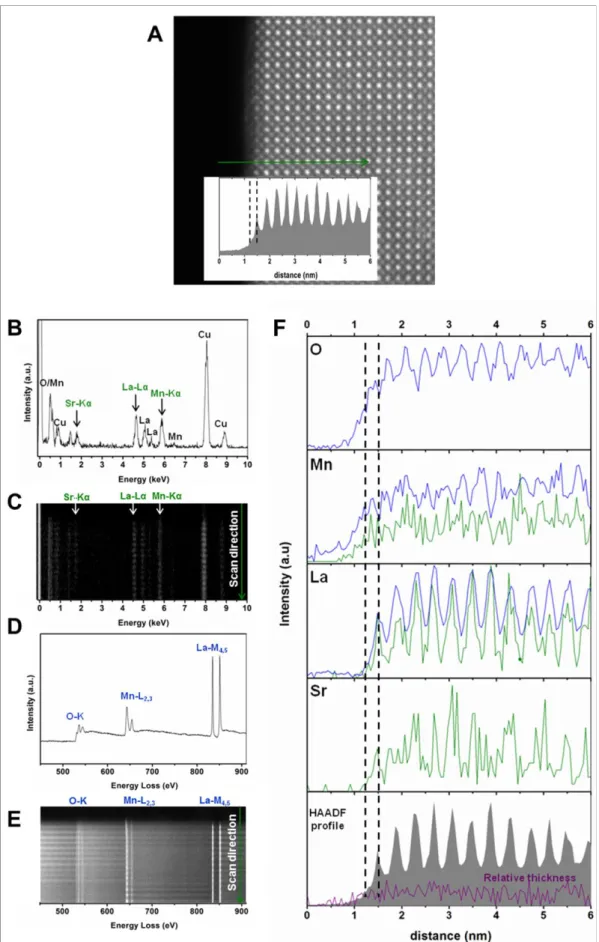
Figure 4. Electron microscopy study of LSMO nanocrystals: STEM analysis of the particles edges. (A) STEM-HAADF image of the edge of a nanocube where high energy
resolution EELS spectra have been recorded along a scan line (yellow line). (B) Mn-L2,3
EELS spectra for each unit cell are shown in two dimensions. The red bracket in (A) highlights the 2 outer unit cells where the Mn oxidation state is decreased according to the energy loss value and the intensity ratio of the Mn-L3 and Mn-L2 lines in (B) -see SI-. The red
arrow in (A) highlights the thickness of the shell where magnetisation is disturbed. (C) EELS spectra of selected unit cells (black) and references of Mn2+ (purple) Mn3+ (orange) and Mn4+ (green) oxidation states. (D) STEM-HAADF image of a nanocube edge where high energy resolution EELS spectra have been recorded along a scan line (yellow line). Inset shows the HAADF signal recorded during the simultaneous acquisition of EELS and EDS line spectra. (E and F) Signal profiles of the different elements obtained from EDS (green) and EELS (blue) signals. (G) La:Mn and Mn:O relative compositions (%)obtained from EELS signals. The HAADF signal and the black dashed lines are included to better identify the first Mn-O and La/Sr-O planes, as well as the two first unit cells in the STEM-HAADF image. The relative thickness computed from the simultaneously acquired Zero Loss signal is also shown (purple line).
The Mn oxidation state is the key parameter governing charge and magnetic ordering
and can be accurately measured by EELS (Figure 4 and Table S2). The mean value is
16
described above, the Mn average charge of +3.3 ± 0.1 is homogeneous over the whole particle,
except for the outer two pseudo-cubic unit cells that correspond to a thickness of 0.8 nm.
These two surface layers with 3 manganese-containing planes exhibit a significant decrease of
the Mn oxidation state to Mn+2.8 ± 0.1.
To understand charge compensation in the strongly reduced perovskite shell, we then
address the exact composition of the nanocube outer atomic layers. The atomic La, Sr and Mn
distributions across the edge of the nanocrystals is monitored by EELS and EDS spectra
simultaneously acquired since the low signal-to-noise ratio of the Sr-M4,5 line (at 1940 eV)
prevents its analysis by EELS (Figure S7). The zero-loss EELS signal (Figures 4 and S7)
intensity is homogeneous over the entire nanocube and shows that the thickness is constant, so
that any change in relative intensities can be ascribed to chemical features and not
morphological causes. The EDS/EELS-derived overall atomic composition of the
nanocrystals is in agreement with the nominal one and the ICP-OES values (see SI). No
difference in the Sr:La ratio is detected across the surface of the nanocrystals (Figure 4F), so
that any change in the Sr:La stoichiometry can be discarded, even at the outer surface layer.
This contrasts with previous surface studies on LSMO films suggesting that Sr can possibly
segregate to the surface, making its first atomic layers transform in another possibly insulating
phase.[36]
Next the oxygen content is questioned. The atomic resolution analysis of the Mn:O
relative concentration (%) of the core (Figures 4G and S8D) is in good agreement with the
25:75 (±5) ratio expected for the LSMO perovskite structure. However, a slight increase in
the Mn:O relative content is evidenced within the two pseudo-cubic unit cells close to the
edge of the LSMO nanocubes (Figures 4G and S8D). This feature points to a decrease in the
oxygen concentration within a ~1nm-thick shell. As the La:Sr and La:Mn stoichiometries are
constant over the nanocrystal (Figures 4F-G, S7 and S8), the depletion of the Mn oxidation
17
oxidation state Mn+2.8±0.1 in the shell, the oxygen vacancy content is about ~8%at..
Furthermore, no ordering could be detected by EELS mapping, so that the vacancies are
presumably randomly distributed, in agreement with reports on bulk manganite perovskites
with a similar vacancies content.[37,38] Note that oxygen gradient in the shell from the outer
atomic layer to the core is likely. Indeed, according to atomic resolution EELS analysis, the
{001}c facets are always terminated by Mn-O planes that show even lower Mn oxidation state
(Figure S6B) and oxygen content (Figure S8D) than planes located deeper beneath the
surface. Besides, the detection threshold of the EELS analysis of O vacancies is ~5%at., so
that O deficiency could extend deeper than 0.8 nm.
All in all, and in relation to magnetic and transport properties, the nanocubes can be
described as core-shell nanocrystals on the basis of the atom-scale composition. According to
electron microscopy, the core is made of highly crystalline LSMO with ideal stoichiometry,
and a ~1 nm-thick shell contains strongly reduced manganese cations and a significant
amount of oxygen vacancies, while the perovskite structure is maintained. The thickness of
the layer containing reduced Mn ions, of about two perovskite unit cells, is remarkably small,
revealing samples of quality similar to epitaxial thin films grown in UHV or
oxygen-controlled environments. The highlighted compositional core-shell structure is related to the
magnetic properties. Indeed, the low Mn oxidation state in the shell suggests insulating
properties of the nanoparticle surface, in agreement with the paramagnetic-like component of
the two-phase magnetic configuration at low applied magnetic field. Clearly, the changes in
surface composition affect the magnetic and electrical properties over a depth exceeding the
expectations inferred from structural and composition considerations. This difference may
arise from (i) the above-mentioned detection threshold of EELS-STEM suggesting
non-stoichiometry gradient extending deeper than 0.8 nm; (ii) the competition between the
different spin configurations in a 0.8 nm-thick paramagnetic-like layer and the ferromagnetic
18
(iii) occurrence of EPS. This latter model describes mixed-phase nanocrystals and is actually
in agreement with a core-shell picture where the paramagnetic-like phase would be “pinned”
by the surface compositional deviations from ideal LSMO. The EPS model would also agree
with the large volume fraction of spin disordered phase.
To conclude, we presented an approach to synthesize manganite perovskite
nanoparticles with unprecedented structural quality. This scalable process yields nanoscale
objects that possess the single crystal structure of LSMO, with oxygen deficiencies and
related manganese reduction confined to just two outer surface perovskite layers. The degree
of structural and compositional order is on par with epitaxial thin films, yet the magnetically
disordered volume fraction of these free-standing nanoparticles reaches 75%, extending over
a depth significantly larger than the thickness of detected chemical disorder, and suggesting
the occurrence of EPS in LSMO nanocubes ~20 nm in diameter. Magnetoresistance data highlight that transport is controlled by the paramagnetic-like phase component, expected at
the particle interfaces. The large magnetoresistance values relate to the drastic change of
conductivity under magnetic alignment of the spins in the paramagnetic-like phase analogous
to normal CMR, although the experiments are performed very far from the bulk LSMO
magnetic transition and the CMR temperature range. This finding is in strong contrast with
models invoking very high spin polarization of current or density of states when extracting
charges from LSMO. In view of the structural quality of the nanocrystals reported herein, the
results indicate that magnetoresistance properties intrinsic to LSMO and its interfaces should
not be neglected when investigating heterogeneous devices using LSMO electrodes,
especially when exposed to air, solvents and organic moieties. The outer surface properties we
unveil highlight unexpected physical and chemical phenomena associated to charge and spin
transport in LSMO-based devices. These new behaviours thus shed a new light on the
19
unique test bench material for gaining fundamentals insight into electronic phase separation in
magnetic perovskites.
Experimental Section
Synthesis: The synthesis of LSMO nanocubes was inspired by a previously reported
procedure[16,17] that was modified to yield highly crystalline and faceted nanocrystals with
narrow size distribution. A mixture of manganese nitrate tetrahydrate (Aldrich, 6.5 mmol),
lanthanum nitrate hexahydrate (Aldrich, 3.86 mmol), strontium nitrate (Aldrich, 1.99 mmol)
and potassium nitrate (65 mmol) was milled with few drops of ethanol for 2 min by using a
Retsch MM400 ball miller. After drying under vacuum over night at 40 °C, the powder was
put in an alumina crucible and inserted into a tubular oven pre-heated at 600 °C where it was
treated under air flow during 2 h. Then, the black liquid reaction mixture was removed from
the furnace and quenched at room temperature. It was washed with water and the resulting
black precipitate was washed by 5 cycles of centrifugation-redispersion in deionized water.
The powder was dried overnight under vacuum at 40 °C. Typically, 1.4 g of black powder are
obtained, which represents a yield of 96 %.
Bulk structural characterization and elemental analysis: Powder XRD was performed on a
Bruker D8 advance diffractometer equipped with a Cu K source. Rietveld refinements were
performed with the FullProf Suite.[39] Field-emission scanning electron microscopy was
performed on a Hitachi SU-70 microscope. Inductively Coupled Plasma Optical Emission
Spectrometry was performed on a Varian Vista analyser.
Scanning TEM and analytical STEM: A total number of 8 nanocrystals were studied by
analytical STEM and yielded similar results, thus showing the reproducibility of the
measurements. Atomic resolution STEM-HAADF and STEM-ABF images were acquired
using a JEOL JEMARM200cF aberration-corrected STEM electron microscope (Cold
20
emission density ~0.8·pA and probe size ~0.08 nm). See supporting information for further
details about the optimization of the analytical STEM experimental conditions to avoid beam
damage. Inner and outer collection semi-angles of 68 and 280 mrad, respectively, for HAADF
and 11 and 22 mrad, respectively, for ABF with a nominal camera length of 60 mm were
employed. EELS experiments were acquired using a GIF-QuantumERTM with a collection
semi-angle of 18 mrad and a convergence semi-angle of 20.3 mrad. EELS chemical maps
were acquired with a spatial resolution ~0.08 nm, over a total acquisition time of ~5 min with
an energy dispersion of 0.5 eV/channel. Principal Component Analysis was performed on
EELS data set to de-noise the spectra by using the Hyperspy data analysis toolbox. The
atomic column by atomic column Mn oxidation state was analyzed in the perovskite structure
from the Energy-Loss Near-Edge fine Structure (ELNES) of Mn-L2,3 signals. ELNES spectra
were acquired using the spectrum line mode, with an energy dispersion of 0.1 eV/channel and
an acquisition time of 0.5 s over a total number of 150 points. The zero loss peak was
simultaneously acquired by using Dual EELS (10-4 s acquisition time) to assure the accuracy
of the Mn-L2,3 energy loss. The average Mn oxidation state for each Mn atomic column in the
nanocubes was estimated by analyzing the relative intensity of the Mn-L2 and Mn-L3 white
lines. Using the Gatan GMS2 software, the I(Mn-L2) and I(Mn-L3) were obtained by fitting
the positive component of the second derivative of the Mn-L2,3 white lines to a Gaussian
curve and calculating the area under the curve. The experimental relative intensity I(Mn-L3)/
I(Mn-L2) was compared with the values obtained from reference Mn2+ (Ca2Mn3O5), Mn3+
(LaMnO3) and Mn4+ (Ca2Mn3O8) samples. Crystal by crystal chemical composition was
determined by energy-dispersive spectrometry (EDS) X-ray microanalysis using an Oxford
SDD Detector for TEM - X-MaxN 100TLE. The atomic La:Sr stoichiometry was evaluated
using the Gatan GMS2 software from La-M4,5, Mn-L2,3, O-K, La-Lα, Mn-Kα, and Sr-Kα
signals recorded from EELS and EDS spectra simultaneously acquired, in order to circumvent
21
distribution by EELS. EELS and EDS spectrum lines were recorded with an energy dispersion
of 0.25 eV/channel and an acquisition time of 0.5 s, over a total number of 200 points. The
EELS zero loss peak was simultaneously acquired by using Dual EELS (10-4 s acquisition
time).
Transport studies: Electrical interconnects made of Au/Ti were obtained by lift-off optical
lithography and angle deposition technique to create a separation of 80 ± 5 nm between
electrodes of 20, 50 and 100 m wide, over Si/SiO2 substrates. Details can be found in ref [31].
After sonication (10 min) in ethanol, the dispersion was centrifuged to remove large
aggregates. The particles (~90% of discrete, non-aggregated nanoparticles) were drop-casted
over the substrate and investigated inside a He4 dynamic cryostat, using a superconducting
magnet to impose the external field. Magnetic data were taken on dry powder inside a
superconducting quantum interference magnetometer (Quantum design MPMS).
Supporting Information
Supporting Information is available below.
Acknowledgements
We acknowledge the numerous and insightful discussion with M. Coey and STnano
cleanroom facility technical help. Labex NIE 11-LABX-0058_NIE within the Investissement d’Avenir program ANR-10-IDEX-0002-02, USIAS. Gutenberg Fellowship programs also partly supported this research.
[1] J. M. D. Coey, M. Viret, S. von Molnár, Adv. Phys. 1999, 48, 167–293.
[2] B. Nadgorny, I. I. Mazin, M. Osofsky, R. J. Soulen, P. Broussard, R. M. Stroud, D. J.
Singh, V. G. Harris, A. Arsenov, Y. Mukovskii, Phys. Rev. B 2001, 63, 184433.
[3] B. Nadgorny, J. Phys. Condens. Matter 2007, 19, 315209.
[4] P. R. Leclair, J. S. Moodera, in Handb. Spin Transp. Magn. (Eds.: E. Tsymbal, I.
Zutic), CRC Press, Taylor And Francis Group, 2012.
[5] V. A. Dediu, L. E. Hueso, I. Bergenti, C. Taliani, Nat. Mater. 2009, 8, 707–716.
[6] F. Li, Y. Zhan, T.-H. Lee, X. Liu, A. Chikamatsu, T.-F. Guo, H.-J. Lin, J. C. A. Huang,
22
[7] M. Galbiati, S. Tatay, S. Delprat, C. Barraud, V. Cros, E. Jacquet, F. Coloma, F.
Choueikani, E. Otero, P. Ohresser, N. Haag, M. Cinchetti, M. Aeschlimann, P. Seneor,
R. Mattana, F. Petroff, Appl. Surf. Sci. 2015, 353, 24–28.
[8] A. Gambardella, P. Graziosi, I. Bergenti, M. Prezioso, D. Pullini, S. Milita, F.
Biscarini, V. A. Dediu, Sci. Rep. 2014, 4, 5353.
[9] A. Rajapitamahuni, L. Zhang, M. A. Koten, V. R. Singh, J. D. Burton, E. Y. Tsymbal,
J. E. Shield, X. Hong, Phys. Rev. Lett. 2016, 116, 187201.
[10] Y. Zhu, K. Du, J. Niu, L. Lin, W. Wei, H. Liu, H. Lin, K. Zhang, T. Yang, Y. Kou, J.
Shao, X. Gao, X. Xu, X. Wu, S. Dong, L. Yin, J. Shen, Nat. Commun. 2016, 7, 11260.
[11] J. Shao, H. Liu, K. Zhang, Y. Yu, W. Yu, H. Lin, J. Niu, K. Du, Y. Kou, W. Wei, F.
Lan, Y. Zhu, W. Wang, J. Xiao, L. Yin, E. W. Plummer, J. Shen, Proc. Natl. Acad. Sci.
2016, 113, 9228–9231.
[12] L. Balcells, J. Fontcuberta, B. Martínez, X. Obradors, Phys. Rev. B 1998, 58, R14697–
R14700.
[13] R. Epherre, E. Duguet, S. Mornet, E. Pollert, S. Louguet, S. Lecommandoux, C.
Schatz, G. Goglio, J. Mater. Chem. 2011, 21, 4393.
[14] a. K. Pradhan, R. Bah, R. B. Konda, R. Mundle, H. Mustafa, O. Bamiduro, R. R.
Rakhimov, X. Wei, D. J. Sellmyer, J. Appl. Phys. 2008, 103, 1–4.
[15] N. D. Thorat, K. P. Shinde, S. H. Pawar, K. C. Barick, C. a. Betty, R. S. Ningthoujam,
Dalt. Trans. 2012, 41, 3060.
[16] Y. Tian, D. Chen, X. Jiao, Chem. Mater. 2006, 3, 6088–6090.
[17] Y. Tian, W. Liu, Y. Lu, S. Sun, Nano 2016, 11, 1650059.
[18] H. Y. Hwang, S.-W. Cheong, N. P. Ong, B. Batlogg, Phys. Rev. Lett. 1996, 77, 2041–
2044.
[19] M. C. Martin, G. Shirane, Y. Endoh, K. Hirota, Y. Moritomo, Y. Tokura, Phys. Rev. B
23
[20] P. G. Radaelli, G. Iannone, M. Marezio, H. Y. Hwang, S.-W. Cheong, J. D. Jorgensen,
D. N. Argyriou, Phys. Rev. B 1997, 56, 8265–8276.
[21] T. Zhang, X. P. Wang, Q. F. Fang, X. G. Li, Appl. Phys. Rev. 2014, 1, 031302.
[22] J. M. D. Coey, Magnetism and Magnetic Materials, Cambridge University Press,
Cambridge, 2010.
[23] H. Boschker, M. Huijben, A. Vailionis, J. Verbeeck, S. van Aert, M. Luysberg, S. Bals,
G. van Tendeloo, E. P. Houwman, G. Koster, D. H. A. Blank, G. Rijnders, J. Phys. D.
Appl. Phys. 2011, 44, 205001.
[24] S. Valencia, L. Peña, Z. Konstantinovic, L. Balcells, R. Galceran, D. Schmitz, F.
Sandiumenge, M. Casanove, B. Martínez, J. Phys. Condens. Matter 2014, 26, 166001.
[25] A. Verna, B. A. Davidson, Y. Szeto, A. Y. Petrov, A. Mirone, A. Giglia, N. Mahne, S.
Nannarone, J. Magn. Magn. Mater. 2010, 322, 1212–1216.
[26] R. P. Borges, W. Guichard, J. G. Lunney, J. M. D. Coey, F. Ott, J. Appl. Phys. 2001,
89, 3868–3873.
[27] S. Valencia, A. Gaupp, W. Gudat, L. Abad, L. Balcells, B. Martínez, Appl. Phys. Lett.
2007, 90, 252509.
[28] E. Dagotto, T. Hotta, A. Moreo, Phys. Rep. 2001, 344, 1–153.
[29] J. H. Wu, J. G. Lin, J. Magn. Magn. Mater. 2006, 304, 7–9.
[30] L. Liang, L. Li, H. Wu, X. Zhu, Nanoscale Res. Lett. 2014, 9, 325.
[31] J.-F. Dayen, V. Faramarzi, M. Pauly, N. T. Kemp, M. Barbero, B. P. Pichon, H.
Majjad, S. Begin-Colin, B. Doudin, Nanotechnology 2010, 21, 335303.
[32] M. Pauly, J.-F. Dayen, D. Golubev, J.-B. Beaufrand, B. P. Pichon, B. Doudin, S.
Bégin-Colin, Small 2012, 8, 108–115.
[33] J. F. Dayen, E. Devid, M. V. Kamalakar, D. Golubev, C. Guédon, V. Faramarzi, B.
Doudin, S. J. Van Der Molen, Adv. Mater. 2013, 25, 400–404.
24
[35] R. Gross, L. Alff, B. Büchner, B. H. Freitag, C. Höfener, J. Klein, Y. Lu, W. Mader, J.
B. Philipp, M. S. R. Rao, P. Reutler, S. Ritter, S. Thienhaus, S. Uhlenbruck, B.
Wiedenhorst, J. Magn. Magn. Mater. 2000, 211, 150–159.
[36] H. Dulli, P. A. Dowben, S.-H. Liou, E. W. Plummer, Phys. Rev. B 2000, 62, R14629–
R14632.
[37] A. Reller, J. M. Thomas, D. A. Jefferson, M. K. Uppal, Proc. R. Soc. A Math. Phys.
Eng. Sci. 1984, 394, 223–241.
[38] R. Cortés-Gil, M. L. Ruiz-González, J. M. Alonso, M. Vallet-Regí, A. Hernando, J. M.
González-Calbet, Chem. Eur. J. 2007, 13, 4246–4252.
1
Supporting Information
Surface-driven magnetotransport in perovskite nanocrystals
Ha Le Thi N’Goc, Donald Mouafo Notemgnou, Céline Etrillard, Almudena Torres-Pardo, Jean-François Dayen, Simon Rano,Gwenaëlle Rousse,Christel Laberty-Robert, Jose Gonzales Calbet, Marc Drillon, Clément Sanchez, Bernard Doudin,David Portehault Dr. H. L. Thi N’Goc, S. Rano, Prof. C. Laberty-Robert, Prof. C. Sanchez, Dr. D. Portehault Sorbonne Universités, UPMC Univ Paris 06, CNRS, Collège de France, Laboratoire de Chimie de la Matière Condensée de Paris (CMCP), 11 place Marcelin Berthelot, F-75005, Paris, France
D. Mouafo Notemgnou, Dr. Céline Etrillard, Dr. J.-F. Dayen, Prof. M. Drillon, Prof. B. Doudin
Institut de Physique et Chimie des Matériaux de Strasbourg, Université de Strasbourg, CNRS UMR 7504, 23 rue du Loess, BP 43, F-67034 Strasbourg Cedex 2, France
Dr. A. Torres-Pardo, Prof. J. Gonzales Calbet
Departamento de Química Inorgánica I, Facultad de Químicas, Universidad Complutense CEI Moncloa, 28040 Madrid (Spain)
Dr. G. Rousse
Sorbonne Universités, UPMC Univ Paris 06, Chimie du Solide et de l’Energie, UMR 8260, Collège de France, 11 place Marcelin Berthelot, 75231 Paris Cedex 05, France
Prof. J. Gonzales Calbet
Centro Nacional de Microscopía Electrónica, Universidad Complutense, 28040 Madrid, Spain
Corresponding authors:
E-mail: [email protected]
2
XRD Structural analysis
Figure S1. Rietveld refinement of the XRD pattern of LSMO (T=300 K). Table S1. Structural parameters for LSMO deduced from XRD at 300 K.
STEM-EELS analysis of the Mn oxidation state in the nanocubes core
Figure S2. STEM-EELS analysis of the particles core and the average Mn oxidation
state. Discussion of the nature of structural defects in the core.
Table S2. Energy loss Mn-L2,3 edges for references Ca2Mn3O8, LaMnO3, Ca2Mn3O5.
Figure S3. EELS calibration and analysis of the Mn oxidation state.
Transport properties of the nanocubes within nanotrenches Figure S4. Voltage dependence of the magnetoresistance. Figure S5. I-V curves recorded at several temperatures.
Overall La-Sr-Mn composition from analytical STEM
Local analysis of the nanocubes composition: Mn oxidation state Figure S6. STEM analysis of a particle edge.
STEM analysis of the atomic La-Sr-Mn distribution in the nanocubes shell Figure S7. STEM-EELS-EDS analysis of the La:Sr:Mn composition.
STEM analysis of the atomic La-Mn-O relative concentration
Figure S8. STEM-EELS analysis of the content of oxygen vacancies.
Optimization of the EELS/EDS-STEM experimental conditions
3
Figure S1. Rietveld refinement of the X-ray powder diffraction pattern of LSMO (T=300 K). The red crosses, black continuous line and bottom gray line represent the
observed, calculated, and difference patterns, respectively. Vertical blue tick bars are the Bragg positions. Bragg R-factor=3.60 %, 2=3.26.
Table S1. Structural parameters for LSMO deduced from the Rietveld refinement of the
X-Ray diffraction pattern at 300 K. Comparison with results on bulk materials (ref 20 of the main text) indicates that the nanocrystals are in average strain-free.
Space Group R -3 c
a= 5.50387(15) Å, c= 13.3451(5) Å V= 350.10(2) Å3
Atom Wyckoff site x y z B(Å2)
La/Sr 6a 0 0 ¼ 0.74(4)
Mn 6b 0 0 0 1.12(6)
4
Figure S2. Electron microscopy study of LSMO nanocrystals: STEM-EELS analysis of the particles core. (A) from Figure 1 in the main text: (A) STEM-HAADF image of a part of
the core where high energy resolution EELS spectra have been recorded along a scan line (red line). Mn-L2,3 EELS spectra for each unit cell are shown in two dimensions. They are obtained
by averaging the 5 spectra recorded over each unit cell. The yellow bracket highlights a defect on the 5th, 6th and 7th unit cells. (B) EELS spectra of selected unit cells on the defect (red), defect-free (black) areas and references of Mn2+ (purple) Mn3+ (orange) and Mn4+ (green) oxidation states
La2O3 inclusions
Interestingly, few crystalline defects are also observed in the core (Figure 1E and 1H), although they do not disturb the high crystalline quality of the perovskite structure. These defects contain extra cationic heavy elements in a cubic arrangement according the HAADF and ABF images. EELS chemical mapping (Figure 1J and 1K) enables identifying La in these columns with La-La distances of 0.55 nm, so that such defects are presumably inclusions of cubic La2O3. Noteworthy, these inclusions do not disturb the anionic lattice as
an epitaxial relationship is observed between the lattices of LSMO and of cubic La2O3. EELS
experiments do not detect any change in the Mn oxidation state in the vicinity of the defects, which suggests that the La2O3 inclusions do not spread over the thickness of the cubes but are
rather localized and confined to a single cubic La2O3 unit cell. All in all, such defects are not
likely to disturb the magnetic and transport properties of the well crystalline LSMO perovskite core, and cannot be accounted for the spin-transport properties highlighted in the main text.
5
Table S2. Energy loss (eV) of the Mn-L2,3 edges for reference Ca2Mn3O8, LaMnO3,
Ca2Mn3O5 samples.
Sample E (eV) Mn-L3 E (eV) Mn-L2
Ca2Mn4+3O8 644.4 654.9
LaMn3+O3 643.2 654.0
Ca2Mn2+3O5 641.2 652.3
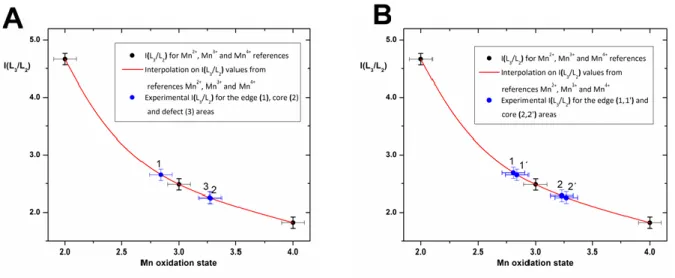
Figure S3. STEM-EELS study of LSMO nanocrystals: EELS calibration and analysis of the Mn oxidation state. The intensity ratio of the Mn-L3 and Mn-L2 lines has been measured
on Mn2+, Mn3+ and Mn4+ references (see Methods: Scanning TEM and analytical STEM for details), yielding the calibration line plotted in (A) and (B). Points 1 and 1’ correspond to two different edges of a nanocube. Points 2 and 2’ correspond to two different unit cells in the core without any defects. Point 3 corresponds to a unit cell in the core where a La2O3 defect is
observed. The proximity between points 1 and 1’ on one side, 2 and 2’ on the other side, shows the reproducibility of the measurement and the homogeneity of the particles. As points 2 and 3 are nearly superimposed, the defects in the core are punctual.
6
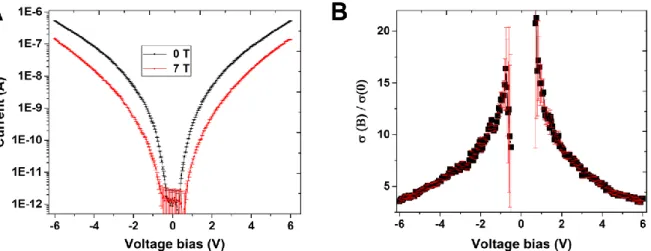
Figure S4. Voltage dependence of the MR. (A) Current measurements at 1.6 K under zero
field (black curve) and 7 T field (red curve). (B) The related normalized Magnetoconductance amplitude at 1.6 K as a function of the applied voltage bias.
IV curves recorded at zero and maximum applied magnetic field are used as straightforward method to determine how the MR evolves with applied bias. A significant decrease with bias is observed, with MR ratios exceeding one order of magnitude in the low bias range. Even at 6V bias, the MR exceeds predictions of a factor 2 from the tunnelling model in a randomly magnetized ensemble of particles.
Figure S5. I-V curves recorded at several temperatures. Values on the right are the
7
Overall analysis of the nanocubes composition: La-Sr-Mn composition from analytical STEM
Crystal by crystal chemical composition was determined by energy-dispersive spectrometry (EDS) X-ray microanalysis. From these analysis on 8 nanocubes, LSMO nanocrystals showed a constant composition with a La:Sr:Mn ratio in agreement with the nominal composition and the values retrieved from ICP-OES (atomic ratios La:Mn = 0.66 ± 0.06; Sr:Mn =0.29 ± 0.05; Sr:La = 0.43 ± 0.09).
Local analysis of the nanocubes composition: Mn oxidation state
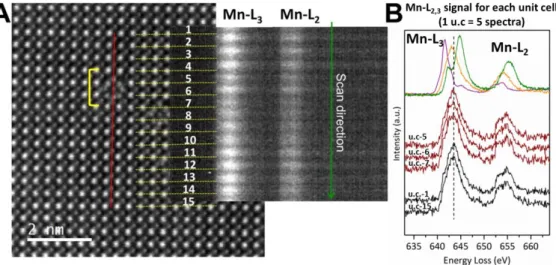
Figure S6 shows EELS analysis of the surface of a nanocube. It is fully consistent with the
data from Figure 4 in the main text, showing that the mean Mn oxidation state is reduced in the 2 outer unit cells.
Figure S6. Electron microscopy study of LSMO nanocrystals: STEM analysis of a second particle edge. (A) STEM-HAADF image of a nanocube edge complementary of the
one analysed in Figure 4 of the main text. High energy resolution EELS spectra have been recorded along a scan line (red line). EELS spectra for each unit cell are shown in two dimensions. They are obtained by averaging the 5 spectra recorded over each unit cell. The yellow bracket in (A) highlights the 2 outer unit cells where the Mn oxidation state is decreased according to the intensity ratio of the Mn-L3 and Mn-L2 lines. (B) EELS spectra of
selected unit cells (black) and references of Mn2+ (purple) Mn3+ (orange) and Mn4+ (green) oxidation states.
8
Local analysis of the nanocubes composition: atomic La-Sr-Mn distribution across the {001}c facets
Figures S7 shows the atomic resolution elemental analysis for La, Sr and Mn in a nanocube. The relative thickness of the nanocubes was first evaluated from the zero loss EELS signal (Figure S7F). No significant change of the thickness is observed. The combined analysis of EELS and EDS signal reveals that the nanocubes {001}c facets are terminated by Mn-O
planes. We also observe a depletion of both Sr and La in the first (La,Sr)-plane close to the edge. Notice that the distribution profiles of La, Sr, O and Mn show the same depletion at the outer plane, suggesting a decrease in the number of unit cells at the facet of the nanocube rather than a change in (La,Sr) stoichiometry at the surface. This is confirmed by the analysis of the relative La:Mn composition across the edge with atomic resolution (see Figure S8), as no deviation from the overall La:Mn ratio 0.66 is detected.
9
Figure S7. Electron microscopy study of LSMO nanocrystals: STEM-EELS-EDS analysis of the La:Sr:Mn composition. (A) STEM-HAADF image of a nanocube edge
where high energy resolution EELS spectra have been recorded along a scan line (green arrow). Inset shows the HAADF signal recorded during the simultaneous acquisition of EELS and EDS line spectra. (B) EDS sum spectrum and (C) corresponding 2D individual EDS
10
spectra over the analyzed line. (D) EELS sum spectrum and (E) corresponding 2D individual EELS spectra over the analyzed line Mn, Sr, La and O signals are clearly identified. (F) Signal profiles of the different elements obtained from EDS (green) and EELS (blue) signals. EELS profiles were obtained by integrating the intensity of each spectrum from O-K, Mn-L2,3
and La-M4,5 lines while EDS signals were obtained by integrating the intensity from Sr-Kα,
Mn-Lα and La-Lα lines. The HAADF signal and the dashed lines are included to better identify the first Mn-O and La-Sr-O plane in the STEM-HAADF image. The relative thickness computed from the simultaneously acquired Zero Loss signal is shown (purple line).
Local analysis of the LSMO nanocrystals composition: study of the atomic La-Mn-O relative concentration
Figure S8 shows the relative atomic composition of La, Mn and O elements monitored by
EELS. The experimental relative atomic composition % Mn:O ~25:75 % is in good agreement with nominal values. Notice that a slight increase of the atomic composition ratio Mn:O is observed within the 2 unit cells close to the edge of the LSMO nanocubes (marked with dashed lines in Figure S8A and D). However, in the same area, no deviation is observed in the La:Mn atomic composition, as the 40:60 % value perfectly matches the overall La:Mn value and the value measured in the core. This fact suggests that the slight decrease of the oxygen content in the ~ 1 nm-thick shell is due to the presence of oxygen vacancies. These vacancies should be responsible for the depletion of the Mn oxidation state in the perovskite structure. Additionally, the Mn-O plane is again confirmed as the terminating plane of the {001}c facets since only the Mn and O signals are detected in this plane. The Mn:O ratio in
the Mn-O facet plane is even higher than the value recorded in the shell as a consequence of the lower oxygen coordination of Mn in this outer plane.
11
Figure S8. Electron microscopy study of LSMO nanocrystals: STEM-EELS analysis of the content of oxygen vacancies (A) STEM-HAADF image of a nanocube edge where high
energy resolution EELS spectra have been recorded along a scan line (green arrow). Inset shows the HAADF signal recorded during the simultaneous acquisition of EELS and EDS line spectra. (B) EELS sum spectrum and (C) corresponding 2D individual spectra over the analyzed line. The presence of Mn, La and O signals are clearly identified. (D) La:Mn and Mn:O relative concentrations (%) obtained from EELS signals. The HAADF signal and the dashed lines are included to better identify the two first perovskite unit cells in the STEM-HAADF image. The relative thickness computed from simultaneously acquired Zero Loss signal is also shown (purple line).
12
Optimization of the EELS/EDS experimental conditions
In order to avoid damaging effect of the electron beam on the LSMO nanocubes, a set of preliminary tests were carried out in order to establish the experimental conditions allowing atom-resolved analysis without modifying neither the crystalline structure, nor the Mn oxidation state (Mn-L2,3 signal).
In this sense, we performed different EELS/EDS experiments while modifying the operation voltage, spatial resolution (number of pixels), and dwell time per pixel in order to evaluate changes in the Mn-L2,3 signals that could indicate degradation of the sample under the
electron beam. Additionally, we verified the quality of the EDS data set by evaluating the expected nominal composition from each EDS data set, discarding the over/under estimation of La, Mn or Sr signals due to a poor statistic. Taking into account these experimental limitations, we settled the operation voltage at 120 kV, and we limited the total acquisition time to ~100 s to achieve good enough EELS and EDS signal/noise ratio as well as atomic spatial resolution over a total of 10-20 perovskite unit cells.
Under the above conditions, we performed a sample stability test consisting in recording a series of consecutive spectrum lines over the exactly same area to evaluate changes in the position of the Mn-L2,3 lines as a function of the beam exposure-time. During these
experiments we kept the beam continuously scanning over the studied area even when we were not acquiring any spectroscopy data, so that the electron dose applied over the material was higher than in a conventional EELS/EDS experiment. The analysis of the Mn-L2,3 edges
showed that the Mn-L2,3 signals did not change at least during 20 min (Figure S9A). After 30
min, a clear shift to lower energies occurred, indicating a clear reduction of the sample due to beam damage. Additionally, we qualitatively evaluated any possible damage and/or sample drift recording HAADF images before and after each data acquisition. We did not observe any evidence of sample damage in the area raster by the electron beam (Figure S9B and C). As a result of the sample stability test, we estimated that any feature that we observed on the Mn-L2,3 lines after a regular experiment (total exposition time ~ 75 s) could be considered a
13
Figure S9. LSMO nanocubes stability test for EELS/EDS-STEM experiments. (A)
Mn-L2,3 EELS spectra recorded over the same area of a representative LSMO nanocube at
accumulative beam exposition time in order to evaluate sample damage. The sample stability was evaluated by monitoring the Mn-L2,3 edges at the core (green line) and the shell (red line)
of the nanocrystals. Changes in Mn-L2,3 edges from the sample are only detected after ~30
min of continuous scanning over the same area. Mn-L2,3 edges corresponding to Mn2+ (orange
line), Mn3+ (black line) and Mn4+ (blue line) reference samples are included. (B) and (C) HAADF images recorded before (top) and after (bottom) acquisition of the EELS/EDS data sets over area marked by the green line. From the contrast of the images, no sample damage is observed.