HAL Id: hal-01433239
https://hal.archives-ouvertes.fr/hal-01433239
Submitted on 1 Apr 2017
HAL is a multi-disciplinary open access
archive for the deposit and dissemination of
sci-entific research documents, whether they are
pub-lished or not. The documents may come from
teaching and research institutions in France or
abroad, or from public or private research centers.
L’archive ouverte pluridisciplinaire HAL, est
destinée au dépôt et à la diffusion de documents
scientifiques de niveau recherche, publiés ou non,
émanant des établissements d’enseignement et de
recherche français ou étrangers, des laboratoires
publics ou privés.
Recent Improvements on ILP-based Clustering for
Broadcast News Speaker Diarization
Grégor Dupuy, Sylvain Meignier, Paul Deléglise, Yannick Estève
To cite this version:
Grégor Dupuy, Sylvain Meignier, Paul Deléglise, Yannick Estève. Recent Improvements on
ILP-based Clustering for Broadcast News Speaker Diarization. Odyssey 2014: The Speaker and Language
Recognition Workshop, 2014, Joensuu, Finland. �hal-01433239�
Odyssey 2014:
The Speaker and Language Recognition Workshop 16-19 June 2014, Joensuu, Finland
Recent Improvements on ILP-based Clustering for
Broadcast News Speaker Diarization
Gr´egor Dupuy, Sylvain Meignier, Paul Del´eglise, Yannick Est`eve
LUNAM Universit´e, LIUM, Le Mans, France
Abstract
First we propose a reformulation of the Integer Linear Pro-gramming (ILP) clustering method we introduced at Odyssey 2012, for broadcast news Speaker Diarization. We included an overall distance filtering which drastically reduce the complex-ity of the problems to be solved. Then, we present a clustering approach where the problem is globally considered as a con-nected graph. The search for Star-graph sub-components allows the system to solve almost the whole clustering problem: only 8 of the 28 shows that compose the January 2013 test corpus of the REPERE 2012 French evaluation campaign, on which the experiments were conducted, were processed with the ILP clus-tering. Compared to the original formulation of the ILP cluster-ing problem, our contribution lead to a reduction of the number of variables in the ILP problem, from 1743 to 53 on average, and a reduction of the number of constraints, from 3449 to 53 on average. The graph content clustering method appears to be an interesting alternative to the current clustering methods, since its results are better than that of the state of the art approaches like GMM-based HAC (15.18% against 16.22% DER).
1. Introduction
The speaker diarization task plays an important role in many speech processing applications, such as automatic transcrip-tion, speaker identificatranscrip-tion, and multimedia indexing. Its pur-pose is to automatically annotate the temporal regions of an au-dio recording with speaker labels, in order to answer the well-known question “Who spoke when?”. This task has been de-fined by the NIST in the context of the Rich Transcription eval-uation campaigns as the partitioning of an input audio stream into segments, and the clustering of those segments according to the speakers. Speaker diarization is carried out without any a priori knowledge about speakers: neither the number of speak-ers, their identities, nor samples of their voices are available.
Speaker diarization systems dedicated to broadcast news are usually based on several segmentation and clustering steps. The state of the art clustering methods used so far rest on the hierarchical agglomerative clustering (HAC) approach, which iteratively merges the two closest clusters until the similarity between the two candidate clusters is positive. Systems using this bottom up approach along with Gaussian Mixture Models (GMMs) to model the speakers, obtained good results in vari-ous broadcast news evaluation campaigns, such as REPERE [1], Albayzin [2], ESTER2 [3] and RT-04F [4]. However, the HAC/GMM approach suffers from two main drawbacks. The first is the computational time: a new GMM has to be com-puted each time a merge occurs, and the similarities between this new GMM and the others must be estimated. In order to save time, the new GMM can be estimated using the saved
sta-tistical accumulators from the merged clusters. But no such shortcut is available for the time-consuming similarity estima-tion step. The second drawback is the error propagaestima-tion: HAC algorithm is not able to globally deal with the clustering prob-lem. Although merges are decided according to the best simi-larity between the candidate clusters, this is done only locally. Therefore, an incorrect merge will be propagated until the end of the process, which may lead to some other incorrect merges, and may ultimately increase the diarization error rate (DER).
We recently proposed a global optimization framework in order to overcome these drawbacks [5]. In our approach, the clusters (speakers) are modeled by i-vectors, which have be-come the state of the art in the Speaker Verification field. We expressed the clustering problem as an Integer Linear Program-ming (ILP) problem, in which all of the clusters are processed simultaneously (as opposed to the HAC approach in which clus-ters are processed sequentially). The objective solving func-tion of our ILP clustering aims to minimize both the number of clusters and the dispersion within each cluster, and this can be quickly solved using an ILP solver. This global optimiza-tion framework achieved better results than the HAC/GMM ap-proach, on broadcast news data, in terms of DER and compu-tation time [6]. The ILP clustering approach has also been in-vestigated in [7] and [8], as part of the REPERE [1] evaluation campaign.
In this paper, we give a reformulation of the ILP cluster-ing problem to reduce solvcluster-ing complexity, by removcluster-ing unnec-essary variables and constraints. Then, we introduce a graph-content speaker clustering approach. We first present the data on which experiments were performed, in section 2. In sec-tion 3, we give a presentasec-tion of the speaker diarizasec-tion archi-tecture. We focused on the HAC/GMM and ILP/i-vector clus-tering approaches, and we reproduced the experiments as pre-sented in [5], with different data. In section 4, we introduce the changes made towards the ILP clustering formulation, in order to reduce the number of variables and constraints. We then present a speaker clustering approach where the problem is globally considered as a connected graph. The search for connected sub-components allows us to solve almost the whole clustering problem. Only a few independent sub-components have to be solved using a clustering algorithm like the ILP ap-proach. Experiments and discussion on the methods and the results are given in section 5.
2. Data
The experiments presented in this paper are performed on the test corpus of the REPERE 2012 French evaluation campaign [9]. This campaign is in the field of multimedia people recogni-tion in television documents. The challenge was to answer the questions “who is speaking?” and “who is seen?” at any time
during the videos. One of the sub-tasks was Speaker Diariza-tion.
The January 2013 test corpus is composed of 28 TV shows recorded from the French TV channels BFM and LCP. The cor-pus is balanced between prepared speech, with 7 broadcast news TV programs, and spontaneous speech, with 21 political discus-sions or street interviews. Only 3 hours of the recordings are annotated.
3. Speaker diarization architecture
�������������� ����������������������� ��� ����� ����������� ���������������� �������������� ������� ��������������� �������������������� �������� ������ ���������� ��� ���� ���� �������� ������������������� ������������ �������
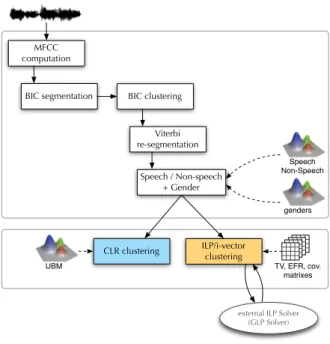
Figure 1: Diarization steps of the speaker diarization systems used to conduct experiments in this paper.
Experiments were carried out using the LIUM SpkDiarization toolkit1 [10]. This speaker
diariza-tion system, which was originally developed during the ESTER1 evaluation campaign [11], has achieved the best or second best results in the speaker diarization task on French broadcast news evaluation campaigns, such as ESTER2, ETAPE (2011) [12] and REPERE (January 2012, 2013 and 2014) [1].
As presented in Figure 1, the diarization system is based on an acoustic segmentation and a hierarchical agglomera-tive clustering using the Bayesian Information Criterion (BIC), both as a similarity measure between clusters (speakers), and as a stop criterion for the merging process. In this cluster-ing, speakers are modeled with full-covariance matrix Gaus-sian distributions. Segment boundaries are adjusted through a Viterbi decoding using 8-component GMMs learned on the data of each speaker via the Expectation-Maximization (EM) algo-rithm. Another Viterbi decoding is carried out to remove non-speech areas. This decoding relies on 8 one-state HMMs rep-resented by 64-component GMMs, trained by EM on ESTER1 training data [11]. Gender (male / female) and bandwidth
(nar-1http://www-lium.univ-lemans.fr/en/content/
liumspkdiarization
row / wide band) detection is performed using 4×128 diagonal component GMMs trained on 1 hour of speech from the ES-TER1 training corpus (there is 1 GMM for each of the combina-tions gender-bandwidth). Segmentation, clustering, and decod-ing are performed usdecod-ing 12 MFCC parameters, supplemented with energy.
At this point, each cluster is supposed to represent a single speaker (clustering purity is very high); however, several clus-ters can be related to the same speaker. A final clustering stage, which consists either in a HAC or an ILP clustering, is then performed in order to obtain a one-to-one relationship between clusters and speakers.
3.1. HAC clustering with GMMs
In this clustering stage, speakers are processed separately ac-cording to the gender previously detected. Speakers can now be modeled with GMMs, thanks to the high purity clustering resulting from the previous BIC-based HAC (the threshold λ is equal to 3). In the previous steps, features were not nor-malized because the channel contribution was useful to differ-entiate the speakers. In this clustering step, the channel con-tribution is removed with a normalization by mean and vari-ance. Speaker models are obtained for each cluster, by ap-plying a Maximum A Posteriori (MAP) adaptation on a Uni-versal Background Model (UBM). The 256 UBM components used as a base (one for each gender) result from the concate-nation of the two bandwidth-dependent 128 component GMMs used earlier (male/narrowband, male/wideband to process male clusters, and female/narrowband, female/wideband to process female clusters). This HAC uses the Cross-Likelihood Ra-tio (CLR) [13] to estimate the similarity between clusters, and the clustering process stops when the CLR gets higher than a threshold determined empirically. This system, including this HAC/GMM clustering, as well as the previous steps, is widely described in [14], and is very close to that of LIMSI [15]. 3.2. ILP clustering with i-vectors
In this approach, which acts as an alternative to the HAC/GMM, clustering is expressed as an Integer Linear Programming prob-lem. Speakers are modeled with i-vectors, and similarity be-tween i-vectors is estimated with a Mahalanobis distance [5]. The i-vector approach has become the state of the art in the field of Speaker Verification [16]. The i-vectors reduce acous-tic data of a speaker into a low-dimension vector by retaining only the most relevant information about that speaker. The i-vector approach was first adapted to speaker diarization using the k-means algorithm, using distances between i-vectors, to find utterances of speakers within a corpus where the number of speakers is known a priori [17]. In speaker diarization, the number of speakers is unknown.
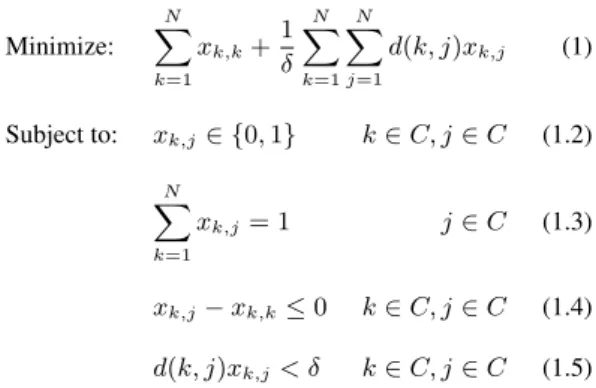
According to the segmentation resulting from the gender detection, a 60-dimensional i-vector is extracted from each clus-ter along with a 1024 GMM-UBM trained on the ESTER1 data. The GMM-UBM and i-vectors are extracted using the Alize toolkit [18]. I-vectors are length-normalized in an iterative pro-cess [19, 20] using a sub-set of the ESTER1 training corpus. Extraction of acoustic features is performed using 19 MFCC parameters supplemented with the energy, as well as the first and second order derivatives. The clustering problem consists in jointly minimizing the number C of cluster centers chosen among the N i-vectors, as well as minimizing the dispersion of i-vectors within each cluster. The set C ∈ {1, . . . , N} is to be automatically determined. The objective solving function of
the ILP problem (eq. 1) is minimized subject to the following constraints: Minimize: N � k=1 xk,k+1 δ N � k=1 N � j=1 d(k, j)xk,j (1) Subject to: xk,j∈ {0, 1} k∈ C, j ∈ C (1.2) N � k=1 xk,j= 1 j∈ C (1.3) xk,j− xk,k≤ 0 k∈ C, j ∈ C (1.4) d(k, j)xk,j< δ k∈ C, j ∈ C (1.5)
Where xk,k (eq. 1) is a binary variable equal to 1 when the
i-vector k is a center. The number of centers C is implicitly included in equation 1: indeed, C =�N
k=1xk,k. The distance
d(k, j)is computed using the Mahalanobis distance between i-vectors k and j. 1/δ is a normalization factor. The binary variable xk,jis equal to 1 when the i-vector j is assigned to the
center k. Each i-vector j will be associated with a single center k(eq. 1.3). Equation 1.4 ensures that the cluster k is selected if an i-vector is assigned to cluster k. The i-vector j associated with the center k (i.e. xk,j = 1) must have a distance d(k, j)
shorter than the threshold δ empirically determined (eq. 1.5). The ILP problem is solved by the glpsol solver included in the GNU Linear Programming Toolkit2.
3.3. HAC/GMM vs. ILP/i-vector experiment
The results of experiments conducted on the January 2013 test corpus of the REPERE evaluation campaign (cf. section 2), with both HAC and ILP clustering methods, are given in Table 1. Although the data used here differs from that of the original ILP clustering formulation the results are consistent with [5].
HAC/GMM ILP/i-vector Threshold DER (%) Distance δ DER (%)
0.0 19.55 75 17.01 -0.1 18.80 80 16.60 -0.2 19.76 85 15.94 -0.3 17.57 90 15.45 -0.4 17.69 95 15.45 -0.5 17.83 100 15.03 -0.6 17.70 105 14.70 -0.7 16.22 110 15.56 -0.8 17.26 115 15.46 -0.9 17.44 120 15.33 -1.0 18.29 125 16.18 Table 1: Diarization Error Rate (DER), with several thresholds, for HAC clustering and ILP clustering, on the REPERE January 2013 test corpus.
The metric used to measure performance in the speaker di-arization task is the Didi-arization Error Rate (DER). DER was introduced by NIST as the fraction of speaking time which is not attributed to the correct speaker, using the best matching
2http://www.gnu.org/software/glpk/
between references and hypothesis speaker labels. The scor-ing tool was developed by LNE3as part of the ETAPE and the
REPERE campaigns. The main difference between this scoring tool and the one from NIST is on the speaker hypothesis and reference mapping. The tool from LNE relies on the Hungarian algorithm, which gives an optimal solution for the problem of assignment in a O(n3)polynomial time, whereas the NIST tool
uses an algorithm based on heuristics [21].
The DER obtained with the HAC/GMM clustering ap-proach, with various CLR thresholds ranging from 0 to -1, is compared to the DER obtained with the ILP/i-vector clustering approach, with various δ thresholds ranging from 75 to 125.
The DER of the input segmentation for these two clustering experiments, which corresponds to the BIC-based HAC output (λ = 3), is 22.63%. The best result obtained with the HAC ap-proach is 16.22% DER, with threshold −0.7. This result is a bit abnormal compared to the surrounding results which are close to 17.5%. The ILP clustering DERs are more stable with rela-tion to thresholds, even if some irregular (but minor) variarela-tions occurred. The DERs obtained with the ILP/i-vector approach are still better than those of HAC/GMM, with a global DER oscillating around 15.5%.
4. Improvements on computation efficiency
The ILP problem is solved with the Branch and Bound (B&B) algorithm of the solver tool. B&B is a general algorithm to determine, in particular, the optimal solution of discrete opti-mization problems. This algorithm may result in a systematic enumeration of all possible solutions for a given problem, but an analysis of this problem can be done to discard the fruitless candidate solutions. Contrary to HAC, B&B algorithm is not executed in polynomial time and, in some cases, may lead to un-reasonable processing durations (several hours). It is therefore essential, with this kind of algorithm, to formulate the problem by limiting the number of variables and constraints to deal with. We first present a reformulation of the ILP clustering. This reformulation aims to reduce the number of binary variables and constraints given as input to the solver. The ILP problem can be restricted to the only binary variables xk,j for which
d(k, j) < δ. From that optimization, we considered the ILP clustering problem as the search for connected sub-components in a totally connected graph. Indeed, the matrix associating dis-tances between clusters can be seen as a connected graph. Its simplification by removing the unnecessary edges, which cor-respond to the distances between the clusters (the graph nodes), allows the system to find connected sub-components. These sub-components correspond to independent speaker clustering problems to be processed.
4.1. ILP clustering with overall distance filtering
In the original formulation of the ILP clustering problem, as presented in section 3.2, we note that eq. 1.5 is the only equa-tion where the constraint on the distance between clusters is ex-pressed. This distance notion can be applied to each of the other constraints: the ILP problem can be restricted to the only binary variables xk,jfor which d(k, j) < δ, instead of freely
express-ing constraints on k and j. The distances between the i-vectors are necessarily computed before the ILP problem formulation; therefore, we propose to reformulate the objective solving func-tion to be minimized subject to constraints as:
let C ∈ {1 . . . N}, let Kj∈C={k/d(k, j) < δ} Minimize: � k∈C xk,k+1 δ � j∈C � k∈Kj d(k, j)xk,j (2) Subject to: xk,j∈ {0, 1} k∈ Kj, j∈ C (2.2) � k∈Kj xk,j= 1 j∈ C (2.3) xk,j− xk,k< 0 k∈ Kj, j∈ C (2.4)
Compared to the previous formulation of the ILP clustering, as expressed in section 3.2, eq. 1.5 is removed because distances are implicitly taken into account in eq. 2.2, eq. 2.3, and eq. 2.4, by using the set Kjin place of C.
Given a value j, the set Kj represents the set of possible
values of k (taken between 1 and N) for which distances be-tween clusters k and j are shorter than the δ threshold. 4.2. Speaker clustering as graph exploration
The matrix associating distances between clusters (i-vectors) can be interpreted as a graph, where the clusters are represented by the nodes, and the distances between the clusters are repre-sented by the edges. The original formulation of the ILP prob-lem (eq. 1) can be interpreted as a totally connected graph, as illustrated in the top scheme of Figure 2.
4.2.1. Decomposition into sub-components
The overall distance filtering we introduced in the ILP problem reformulation (eq. 2) can be applied to the totally connected graph of the original ILP clustering problem (eq. 1). The de-composition of that graph in connected sub-components splits the overall problem into several elementary sub-problems.
The totally connected graph can be simplified with the con-nectivity concept of the graph theory, by removing all the un-necessary edges corresponding to distances longer than the δ threshold (middle scheme of Figure 2). This simplification transforms the completely connected graph into a set of con-nected sub-components. These concon-nected sub-components can easily be found by iteratively using the depth-first search algo-rithm. The resulting subgraphs, which constitute independent subproblems that can be processed separately, are composed of a reduced number of elements. In some cases, the subgraphs only consist in only a single node, which means that the cor-responding speaker cluster can not be associated to any other cluster.
4.2.2. Search for Star subgraphs
All of the sub-components can be processed with a clustering algorithm to identify the cluster centers; however, most of the sub-component centers are obvious. The search of the cluster centers can be formulated as the search of Star-graphs in the set of connected sub-components (bottom scheme of Figure 2). A Star-graph is a special kind of tree composed of one central node attached to k leaves (with a single depth level). The com-plexity of the Star-graph search is done in O(n2), where n is
the number of clusters for which n − 1 nodes are connected. If a sub-graph is a Star-graph, there is no need to perform a tering: the central node corresponds to the center of the
clus-�� �� �� �� �� �� �� �� �� ��� ��� ��� �� �� �� �� �� �� �� �� �� ��� ��� ��� �� �� �� �� �� �� �� �� �� ��� ��� ��� �� ������������� ���� �������������� ���� ��� �� �� ������� ��������� ����� ���� ��� �� �� ������ ��� ���� ���������
Figure 2: Graph representation of the speaker clustering prob-lem: top, the completely connected graph; middle, the decom-position into components; bottom, the search for Star sub-graphs: the colored clusters are identified as centers, and the dashed circle indicates an ILP clustering to be performed.
tering sub-problem, so clusters corresponding to the leaves will be directly associated to that cluster center. If the sub-graph is neither a Star-graph, nor an isolated node (which is a particu-lar Star-graph without leaves), then the clustering sub-problem has to be processed with a clustering algorithm. In our exper-iments, we used the ILP clustering formulation, as described in section 4.1, in order to compare the efficiency of the graph content clustering in terms of the number of variables and con-straints.
5. Experiments and discussion
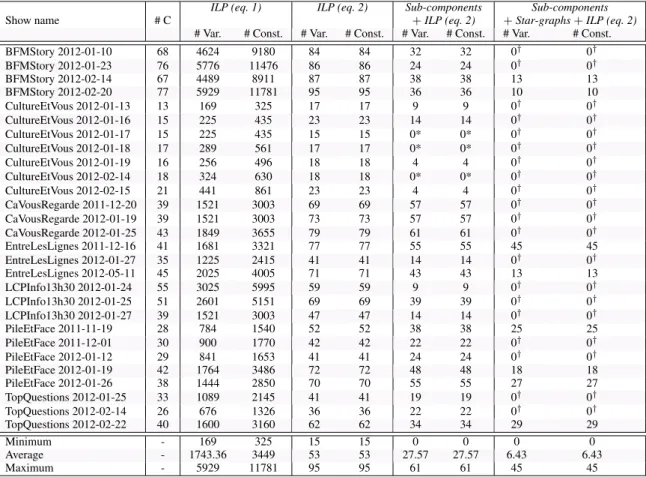
The experiments performed to observe the efficiency of the im-provements consist in a comparison between each of the meth-ods proposed in section 4. In Table 2, we present raw values and statistics (minimum, maximum, mean) on the number of binary variables and constraints of the ILP problems, for each of the shows in the corpus. The threshold was set to 105, since
Show name # C ILP (eq. 1) ILP (eq. 2) Sub-components+ILP (eq. 2) +Star-graphs + ILP (eq. 2)Sub-components # Var. # Const. # Var. # Const. # Var. # Const. # Var. # Const. BFMStory 2012-01-10 68 4624 9180 84 84 32 32 0† 0† BFMStory 2012-01-23 76 5776 11476 86 86 24 24 0† 0† BFMStory 2012-02-14 67 4489 8911 87 87 38 38 13 13 BFMStory 2012-02-20 77 5929 11781 95 95 36 36 10 10 CultureEtVous 2012-01-13 13 169 325 17 17 9 9 0† 0† CultureEtVous 2012-01-16 15 225 435 23 23 14 14 0† 0† CultureEtVous 2012-01-17 15 225 435 15 15 0* 0* 0† 0† CultureEtVous 2012-01-18 17 289 561 17 17 0* 0* 0† 0† CultureEtVous 2012-01-19 16 256 496 18 18 4 4 0† 0† CultureEtVous 2012-02-14 18 324 630 18 18 0* 0* 0† 0† CultureEtVous 2012-02-15 21 441 861 23 23 4 4 0† 0† CaVousRegarde 2011-12-20 39 1521 3003 69 69 57 57 0† 0† CaVousRegarde 2012-01-19 39 1521 3003 73 73 57 57 0† 0† CaVousRegarde 2012-01-25 43 1849 3655 79 79 61 61 0† 0† EntreLesLignes 2011-12-16 41 1681 3321 77 77 55 55 45 45 EntreLesLignes 2012-01-27 35 1225 2415 41 41 14 14 0† 0† EntreLesLignes 2012-05-11 45 2025 4005 71 71 43 43 13 13 LCPInfo13h30 2012-01-24 55 3025 5995 59 59 9 9 0† 0† LCPInfo13h30 2012-01-25 51 2601 5151 69 69 39 39 0† 0† LCPInfo13h30 2012-01-27 39 1521 3003 47 47 14 14 0† 0† PileEtFace 2011-11-19 28 784 1540 52 52 38 38 25 25 PileEtFace 2011-12-01 30 900 1770 42 42 22 22 0† 0† PileEtFace 2012-01-12 29 841 1653 41 41 24 24 0† 0† PileEtFace 2012-01-19 42 1764 3486 72 72 48 48 18 18 PileEtFace 2012-01-26 38 1444 2850 70 70 55 55 27 27 TopQuestions 2012-01-25 33 1089 2145 41 41 19 19 0† 0† TopQuestions 2012-02-14 26 676 1326 36 36 22 22 0† 0† TopQuestions 2012-02-22 40 1600 3160 62 62 34 34 29 29 Minimum - 169 325 15 15 0 0 0 0 Average - 1743.36 3449 53 53 27.57 27.57 6.43 6.43 Maximum - 5929 11781 95 95 61 61 45 45
Table 2: Number of variables (# Var.) and numbers of constraint (# Const.) for the 4 ILP methods in the problem submitted to the ILP solver (Results by show. #C is the number of clusters in the input diarization).
this value gives the best results with these data (cf. Table 1). The DER obtained is identical regardless of the method used (14.70% DER). Note that the number of variables and con-straints are dependent on the number of clusters given as input (cf. column #C in Table 2).
Compared to the original formulation of the ILP cluster-ing approach (ILP (eq. 1)), most of the binary variables and constraints have been removed thanks to the overall distance filtering method (ILP (eq. 2)). Splitting the overall ILP prob-lem into sub-probprob-lems, using the sub-components decomposi-tion method, reduces even more the number of variables and constraints (Sub-components + ILP (eq. 2)). Three of the shows do not need the ILP clustering (cf. * in Table 2). The reason is the distance between all the clusters of these shows are longer than the δ threshold, so, the related sub-graphs are composed of only a single node. The solution is so trivial that it is un-necessary to use the ILP clustering approach on the resulting subgraphs. Finally, the search for Star-graphs further more re-duces the number of variables and constraints ( Sub-components +Star-graphs + ILP (eq. 2)). 70% of the shows do not need to be processed with the ILP clustering (cf. † in Table 2), because their sub-graphs either consist in a single node, or are stars. 5.1. Reduction in number of variables and constraints The numbers of binary variables and constraints presented in Table 2 were determined by reading the files containing ILP problems given to the solver tool. The purpose of the following
section is to explain these values according to the ILP formula-tions expressed in sub-secformula-tions 3.2 and 4.1.
Regarding the formulation of ILP (eq. 1) for a clustering composed of N clusters, there are N2 binary variables and
2× N × (N − 1) + N constraints. Equation 1.2 does not generate constraints in the problem, it is implicitly generated by the solver tool. Equation 1.3 generates a constraint for each cluster, hence N constraints. Equation 1.4 generates N −1 con-straints for each cluster, i.e., N × (N − 1) since no constraint is generated for the case k = j. Equation 1.5 generates one constraint for each d(k, j) < δ, and another constraint for each d(k, j) > δ(equal to xk,j = 0). This last constraint is not
ex-pressed in the ILP formulation, and as in eq. 1.4, no constraint is generated for the case k = j. Therefore, Equation 1.5 finally generates N × (N − 1) constraints.
Regarding the formulation of ILP (eq. 2), the number of constraints is dependent on the threshold δ. Increasing the threshold reduces the number of constraints filtered by distance, and increases the number of edges in the related graph. With a threshold set to infinity, the number of constraints would be N + N× (N − 1), and the graph would be completely con-nected. Equation 2.3 generates N constraints, and equation 2.4 generates N × (N − 1) constraints. With the ILP formulation we introduced in this paper, the number of constraints is equal to the number of variables. A constraint is expressed for each candidate cluster center (N binary variables), and another con-straint is formulated for each edge leaving a node (i.e., there is one constraint, generated by eq. 2.3, for each d(k, j) > δ when
k�= j).
5.2. Speaker clustering as graph exploration
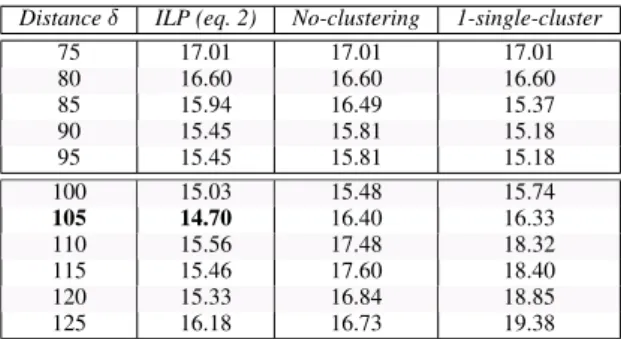
We came with to the idea of considering the clustering problem as a graph thanks to the ILP clustering, on which we have been working for several years, especially to globally process large collections of audiovisual recordings. It appears that the graph approach we proposed in this paper is efficient enough to ques-tion the interest of the clustering method to process the “com-plex” sub-components of the graph (which are neither Star-graphs nor isolated nodes). As presented in Table 2, only 8 of the 28 shows that composed the corpus required an ILP clus-tering to be performed on the sub-components. In Table 3, we compare the DERs between with and without ILP clustering for processing those complex sub-components.
Distance δ ILP (eq. 2) No-clustering 1-single-cluster 75 17.01 17.01 17.01 80 16.60 16.60 16.60 85 15.94 16.49 15.37 90 15.45 15.81 15.18 95 15.45 15.81 15.18 100 15.03 15.48 15.74 105 14.70 16.40 16.33 110 15.56 17.48 18.32 115 15.46 17.60 18.40 120 15.33 16.84 18.85 125 16.18 16.73 19.38
Table 3: Diarization Error Rate (DER) of the graph approach, with and without ILP clustering, on the REPERE January 2013 test corpus.
Three strategies to deal with the complex sub-components have been compared. The left column (ILP (eq. 2)) presents the DERs obtained when the ILP clustering is performed to pro-cess the complex sub-components. The middle column (No-clustering) presents the DERs obtained when nothing is done with the clusters related to the complex sub-components (i.e., the clusters are not merged at all). The right column (1-single-cluster) presents the DERs obtained when all the clusters of a complex sub-component are merged into a single cluster.
We observe, on the upper part of Table 3, that the 1-single-cluster strategy gives identical or better DERs than that of the ILP strategy. The opposite can be observed on the lower part of Table 3. The best DER from the 1-single-cluster strat-egy (15.18%) is only 0.48% worst than the best DER obtained with the ILP strategy (14.70%), and those results are both cen-tered around the same distance δ. On the other hand, the No-clustering strategy does not seem to be interesting since the re-sults obtained are always worse than that of the other strategies. Using the ILP clustering to process the complex sub-components of the graph still provides a better results, as long as the selected threshold δ is not set too low, compared to its optimal value. Note that several clustering approaches have al-ready been studied in detail, and compared, in order to process large-scale clustering on sparse speaker content graphs [22].
6. Conclusions
We have reformulated the ILP clustering to include an overall distance filtering process, in order to reduce the complexity of the problems to be solved. On the January 2013 REPERE test corpus, this optimization lead to a reduction of the number of
binary variables (from 1743 to 53) and constraints (from 3449 to 53). In addition, we proposed to consider the ILP cluster-ing problem as the search for Star-graph sub-components in a totally connected graph. The ILP clustering is only used to pro-cess complex graph sub-components, which are neither Star-graphs nor isolated nodes. The graph-content speaker cluster-ing approach can be considered as a promiscluster-ing alternative to the state of the art clustering methods: even if the complex sub-components are not processed with a clustering algorithm, it gives a better DER than that of the GMM-based HAC experi-ment (15.18% against 16.22% DER). However, it is still better to process the complex graph sub-components with a clustering algorithm, but further investigation has to be done regardless of the clustering method used.
This graph-content clustering, on which an ILP cluster-ing is performed to process the complex sub-components, has achieved impressive performance in terms of speed processing. We performed a test on the ESTER2 training data, which sists of 75.5 hours of annotated data. We considered the con-catenation of all the local segmentations to perform an over-all clustering (i.e., we concatenated the outputs of the shows processed separately with the speaker diarization system pre-sented in section 3). The concatenation represents a total of 4295 speaker clusters. The clustering based on the only refor-mulation of the ILP problem, as presented in eq. 2, was achieved in 8 minutes (RT×0.0018), whereas it last 2 hours and 9 min-utes (RT×0.0284) with the original ILP formulation. The graph approach using the ILP (eq. 2) clustering to process the com-plex connected sub-components was done in 5 minutes only (RT×0.0011).
7. Acknowledgments
This research was supported by both the French National Re-search Agency (ANR), under the DEFI-REPERE evaluation project (contract number ANR-2010-CORD-101-01, SODA project), and by the European Commission, as part of the Event Understanding through Multimodal Social Stream Interpreta-tion (EUMSSI) project (contract number FP7-ICT-2013-10).
8. References
[1] Olivier Galibert and Juliette Kahn, “The first official REPERE evaluation,” in Proceedings of Interspeech satel-lite workshop on Speech, Language and Audio in Multime-dia (SLAM), Marseille, France, 2013.
[2] Martin Zelen´ak, Henrik Schulz, and Javier Hernando, “Speaker diarization of broadcast news in albayzin 2010 evaluation campaign,” EURASIP Journal on Audio, Speech, and Music Processing, vol. 2012, no. 1, pp. 1–9, 2012.
[3] S. Galliano, G. Gravier, and L. Chaubard, “The ESTER 2 evaluation campaign for the rich transcription of French radio broadcasts,” in Proceedings of Interspeech, Septem-ber 2009.
[4] NIST, “Fall 2004 Rich Transcription (RT-04F) Evaluation Plan,” October 2004.
[5] Mickael Rouvier and Sylvain Meignier, “A Global Opti-mization Framework For Speaker Diarization,” in Odyssey Workshop, Singapore, 2012.
[6] Gr´egor Dupuy, Micka¨el Rouvier, Sylvain Meignier, and Yannick Est`eve, “I-vectors and ILP Clustering Adapted to Cross-Show Speaker Diarization,” in Proceedings of Interspeech, Portland, Oregon (USA), 2012.
[7] Herv´e Bredin and Johann Poignant, “Integer Linear Pro-gramming for Speaker Diarization and Cross-Modal Iden-tification in TV Broadcast,” in Proceedings of Inter-speech, Lyon, France, 2013.
[8] Herv´e Bredin, Antoine Laurent, Achintya Sarkar, Viet-Bac Le, Sophie Rosset, and Claude Barras, “Person In-stance Graphs for Named Speaker Identification in TV Broadcast,” in Proceedings of Odyssey 2014: The Speaker and Language Recognition Workshop, Joensuu, Finland, 2014.
[9] Juliette Kahn, Olivier Galibert, Matthieu Carr´e, Aude Gi-raudel, Philippe Joly, and Ludovic Quintard, “The repere challenge: Finding people in a multimodal context,” in Odyssey 2012 - The Speaker and Language Recognition Workshop, 2012.
[10] Micka¨el Rouvier, Gr´egor Dupuy, Paul Gay, Elie Khoury, Teva Merlin, and Sylvain Meignier, “An Open-source State-of-the-art Toolbox for Broadcast News Diarization,” in Proceedings of Interspeech, Lyon, France, 2013. [11] S. Galliano, E. Geoffrois, D. Mostefa, K. Choukri, J.-F.
Bonastre, and G. Gravier, “The ESTER phase II evalua-tion campaign for the rich transcripevalua-tion of French broad-cast news,” Lisbon, Portugal, September 2005, pp. 1149– 1152.
[12] Guillaume Gravier, Gilles Adda, Niklas Paulsson, Matthieu Carr´e, Aude Giraudel, and Olivier Galibert, “The ETAPE Corpus for the Evaluation of Speech-based TV Content Processing in the French Language,” in Pro-ceedings of LREC, Istanbul, Turkey, 2012.
[13] D.A. Reynolds, E. Singer, B.A. Carlson, G.C. O’Leary, J.J. MvLaughlin, and M.A. Zissman, “Blind Clustering of Speech Utterances Based on Speaker and Language Char-acteristics,” in Proceedings of ICSLP, Sydney, Australia, 1998.
[14] Sylvain Meignier and Teva Merlin, “LIUM SpkDiariza-tion: An Open-Source Toolkit for Diarization,” in CMU SPUD Workshop, Dallas, Texas (USA), 2010.
[15] C. Barras, X. Zhu, S. Meignier, and J.L. Gauvain, “Multi-stage speaker diarization of broadcast news,” IEEE Trans-actions on Audio, Speech and Language Processing, vol. 14, no. 5, pp. 1505–1512, 2006.
[16] Najim Dehak, Patrick Kenny, R´eda Dehak, Pierre Du-mouchel, and Pierre Ouellet, “Front-End Factor Analysis for Speaker Verification,” in Proceedings of IEEE TASLP, 2011, vol. 19, pp. 788–798.
[17] Stephen Shum, Najim Dehak, Ekapol Chuangsuwanich, Douglas Reynolds, and Jim Glass, “Exploiting Intra-Conversation Variability for Speaker Diarization,” in Pro-ceedings of Interspeech, Florence, Italy, 2011.
[18] Jean-Franc¸ois Bonastre, Nicolas Scheffer, Driss Matrouf, Corinne Fredouille, Anthony Larcher, Alexandre Preti, Gilles Pouchoulin, Nicholas Evans, Benoıt Fauve, and John Mason, “Alize/spkdet: a state-of-the-art open source software for speaker recognition,” ISCA-IEEE Speaker Odyssey, 2008.
[19] Daniel Garcia-Romero and Carol Y. Espy-Wilson, “Anal-ysis of I-vector Length Normalization in Speaker Recog-nition Systems,” in Proceedings of Interspeech, Florence, Italy, 2011.
[20] Pierre-Michel Bousquet, Driss Matrouf, and Jean-Franc¸ois Bonastre, “Intersession Compensation and Scor-ing Methods in the I-vectors Space for Speaker Recogni-tion,” in Proceedings of Interspeech, Florence, Italy, 2011. [21] Olivier Galibert, “Methodologies for the evaluation of Speaker Diarization and Automatic Speech Recognition in the presence of overlapping speech,” in Proceedings of Interspeech, Lyon, France, 2013.
[22] Stephen H. Shum, William M. Campbell, and Douglas A. Reynolds, “Large-scale Community Detection on Speaker Content Graphs,” in Proceedings of ICASSP, Vancouver, BC, Canada, 2013.