HAL Id: inserm-00720593
https://www.hal.inserm.fr/inserm-00720593
Submitted on 16 Oct 2012
HAL is a multi-disciplinary open access
archive for the deposit and dissemination of
sci-entific research documents, whether they are
pub-lished or not. The documents may come from
teaching and research institutions in France or
abroad, or from public or private research centers.
L’archive ouverte pluridisciplinaire HAL, est
destinée au dépôt et à la diffusion de documents
scientifiques de niveau recherche, publiés ou non,
émanant des établissements d’enseignement et de
recherche français ou étrangers, des laboratoires
publics ou privés.
A comprehensive framework for the detection of
individual brain perfusion abnormalities using Arterial
Spin Labeling
Camille Maumet, Pierre Maurel, Jean-Christophe Ferré, Christian Barillot
To cite this version:
Camille Maumet, Pierre Maurel, Jean-Christophe Ferré, Christian Barillot. A comprehensive
frame-work for the detection of individual brain perfusion abnormalities using Arterial Spin Labeling.
Inter-national Conference on Medical Image Computing and Computer Assisted Intervention (MICCAI),
Oct 2012, Nice, France. pp.542-549. �inserm-00720593�
A comprehensive framework for the detection of
individual brain perfusion abnormalities using
Arterial Spin Labeling
Camille Maumet1,2,3,4, Pierre Maurel1,2,3,4, Jean-Christophe Ferr´e1,2,3,4,5,
Christian Barillot1,2,3,4
1. University of Rennes 1, Faculty of medecine, F-35043 Rennes, France 2. INSERM, U746, F-35042 Rennes, France
3. CNRS, IRISA, UMR 6074, F-35042 Rennes, France 4. Inria, VISAGES project-team, F-35042 Rennes, France 5. CHU Rennes, Department of Neuroradiology, F-35033 Rennes, France
Abstract. Arterial Spin Labeling (ASL) enables measuring cerebral blood flow in MRI without injection of a contrast agent. Perfusion mea-sured by ASL carries relevant information for patients suffering from pathologies associated with singular perfusion patterns. However, to date, individual identification of abnormal perfusion patterns in ASL usually relies on visual inspection or manual delineation of regions of interest. In this paper, we introduce a new framework to automatically outline patterns of abnormal perfusion in individual patients by means of an ASL template. We compare two models of normal perfusion and assess the quality of detections comparing an a contrario approach to the Gen-eralized Linear Model (GLM).
1
Introduction
Perfusion is the process through which the blood provides nutrients and oxygen to the tissues by means of micro-circulation. ASL is a recent MRI technique [8] that allows perfusion measurement and quantification of Cerebral Blood Flow (CBF). Contrary to Dynamic Susceptibility weighted Contrast (DSC) imaging – the most validated technique to measure perfusion with MRI – ASL does not rely on the injection of an exogenous contrast agent. In a few words, blood water is labeled with a radio-frequency pulse in the neck and, after a delay called inversion time, a labeled image of the brain is acquired. The difference between the label image and a control image, acquired without labeling, leads to a perfusion weighted image. Due to the low signal to noise ratio (SNR) of the ASL sequence, a single pair of control and label image is not sufficient to measure perfusion, the acquisition is usually repeated several times leading to R pairs of images. Perfusion information is then extracted by averaging. A model is applied to this image to obtain a quantification of CBF. ASL is particularly well suited for longitudinal studies or studies of patients with difficult venous access such as children. Its non-invasiveness makes ASL the method of choice
for the study of perfusion of healthy subjects. However this comes at the cost of low SNR and lower spatial resolution than DSC.
Today, ASL studies are able to outline differential patterns of perfusion in pathological populations, including Alzheimer disease [2] or schizophrenic tients. At the same time, the interest of ASL in the study of individual pa-tients presenting singular perfusion abnormalities was also demonstrated. In these pathologies, the highly variable pathological patterns preclude group anal-ysis. Abnormal patterns of perfusion must then be identified at the subject level. It is for instance the case of tumors, strokes or multiple sclerosis lesions. For pa-tients diagnosed with tumors, the clinician is interested by hyperperfusions that would reveal the grade of the tumor [12]. In this context, perfusion abnormal-ity studies usually rely on comparing the level of perfusion in the lesion to the controlateral normal tissue. This method is based on manual regions of interest delineations, a time-consuming task prone to inter-expert variability.
The aim of this paper is to present an automatic framework to identify hy-poperfused and hyperperfused regions in individual patients by comparison to a model of normal perfusion. In [9], we investigated the ability to detect hy-poperfused and hyperperfused regions on patients using a template of normal perfusion. Here we propose a new model that takes into account the first level variance and we focus on quantitative evaluation of this framework.
Section 2 presents the method developed, that focuses on two aspects : the computation of an appropriate model for normal perfusion and the selection of an adequate test to detect perfusion abnormalities at the subject level. In Section 3 the framework is evaluated based on 12 subjects diagnosed with brain tumors using a perfusion template derived from 35 healthy subjects. False positive rates (FPR) are estimated and the quality of detections are assessed.
2
Material and Methods
2.1 ASL template: a model of normal perfusion Given perfv
i, i∈ 1..N, a set of perfusion maps in a group of N control subjects,
we want to compute a model of normal perfusion Perfv, referred as the perfusion template. This model is specific to each voxel v. For ease of notation, the v superscript is omitted in the following.
In [10] or [9] the perfusion signal Perf , is modeled by the normal distribution: Perf ∼ N(µpop, σ
2
pop). (1)
The population mean, µpop, and variance, σ 2
pop, are approximated by ˆµpop and
ˆ σ2
pop, the sample mean and variance of the perfusion maps in the control group.
However, the above specified model ignores the error made when estimating the perfusion maps perfias the average of R repeats (control minus label pairs).
This error is dependent on the first level variance that has shown to carry relevant information in group fMRI studies [3]. To simplify the model, we consider that
all subjects in the template group have the same first level variance σ2
sub,tpl. Perf
is then modeled by the normal distribution: Perf ∼ N(µpop, σ
2 pop+ σ
2
sub,tpl). (2)
The first level variance, σ2sub,i, can be approximated by ˆσ 2 sub,i= ˆ σ2 rep,i R , where ˆ σ2
rep,iis the sample variance over the R repeats for the i
thsubject. The first level
variance in the template group σ2
sub,tpl is estimated by ˆσsub,tpl2 = PN i=1σˆ 2 sub,i N . In this model, σ2
pop can no longer be estimated as the sample variance of the
perfu-sion maps in the control group since this estimate includes first level variance. To correct for this bias, σ2
pop can be approximated by the method of moments [5]
subtracting the control subjects first level variance, σ2
sub,tpl, from the sample
variance. Negative variance estimates are avoided by enforcing positivity of ˆσ2 pop.
2.2 Detection of hypoperfused and hyperperfused regions in a single subject
Given the model of normal perfusion Perf , we are interested in drawing conclu-sions about a new observation perfN+1, for instance a patient map.
Uncorrected probability maps: Assuming Gaussian errors, (3) presents the best linear unbiased estimator of the patient versus group effect β, ignoring the first level variance:
ˆ
β= perfN+1− ˆµpop, Var( ˆβ) = σ 2 pop× (
1
N + 1). (3) This model is at the basis of the well-known two-sample t-test group analysis. Since ˆσ2
pop is estimated by the sample variance, this model is also valid in case
of homoscedasticity (same first level variance for all subjects).
The best linear unbiased estimator of the patient versus group effect, β, with explicit first level variance, is expressed in (4).
ˆ
β= perfN+1− ˆµpop, Var( ˆβ) =
σ2pop+ σ2 sub,tpl N + σ 2 pop+ σ 2 sub,N+1 (4)
The first level variance, σ2
sub,N+1, can be approximated by ˆσsub,N+12 = ˆ σ2
rep,N +1
R .
Assuming that a unique patient map cannot be of better quality than the tem-plate maps, σ2
sub,N+1 is constrained to be greater or equal to σsub,tpl2 .
Ignoring the error on the variance estimates, under the null hypothesis that perfN+1 follows the template distribution,
ˆ β
√
V ar( ˆβ) follows a standard normal
distribution. To the aim of discriminating hypoperfusions from hyperperfusions, positive and negative effects are studied separately.
GLM-FDR Most of the GLM approach has been described in the previous section. However, given the large number of voxels found in a typical ASL image a correction for multiple comparisons is required to ensure an acceptable FPR. The False Discovery Rate (FDR) algorithm insures that no more than a ratio q (usually q = 0.05) of detections are false positives. In GLM experiments, the data is usually pre-smoothed with a Gaussian kernel.
A contrario : The a contrario approach, introduced in [7], is inspired from the Gestalt laws of perception. This theory has later been applied to medical image processing [1, 11]. In our context, the a contrario method uses the uncorrected p-value map and takes an original approach to account for multiple comparison. The inference is done by looking into a spherical neighborhood. In the first step, the uncorrected p-value map is thresholded using a predefined set of p-values, L= {p1. . . pT}, to generate a set of binary maps referred as rare event maps. For
instance with a p-value of 0.001, voxels verifying p < 0.001 are outlined as rare events. Then, for each rare event maps, the number kv of rare events found in
a neighborhood around each voxel v is computed. The probability πv
i of having
kv or more rare events is then estimated considering that the number of rare
events in the neighborhood comes from a binomial distribution: πv
i = P (X ≥
kv), where X ∼ B(n, pi),, pi ∈ L and n is the number of voxels in the studied
neighborhood. For the sake of multiple comparisons correction, a number of false alarm (NFA) map is then computed by NFAv = V T min(πiv) where V is the
total number of voxels. V T therefore corresponds to the total number of tests. Voxels verifying N F A < 1 are outlined as detection. Due to the neighborhood constraint, a voxel can be detected both as hyperperfused and hypoperfused. To avoid this confusing situation, a voxel cannot be outlined as hyperperfused (rep. hypoperfused) if its value is smaller (resp. greater) than the template mean. In this paper we worked with the following set of p-values P = {0.001, 0.005}.
3
Results
3.1 Data
Data : 36 healthy volunteers and 14 patients diagnosed with brain tumors were involved in this study. Data acquisition was performed on a 3T Siemens Ve-rio MR scanner with a 32-channel head-coil. The imaging protocol included a 3D T1-weighted anatomical sequence (T1) (TR: 1900 ms, TE: 2.27 ms, res-olution: 1×1×1 mm3), a PICORE Q2TIPS sequence with crusher gradients
(TR: 3000 ms, TE: 18 ms, resolution: 3×3 mm2, slice thickness: 7 mm, TI: 1700 ms, TIwd: 700 ms, R = 60). In addition to these sequences, the patients also
under-went a 3D T1 post gadolinium (T1-Gd) sequence (TR: 1900 ms, TE: 2.27 ms, resolution: 1×1×1 mm3) and a T2 FLAIR sequence (TR: 9000 ms, TE: 90 ms,
resolution: 0.69×0.69 mm2, slice thickness: 4 mm). Three subjects (1 control, 2
Pre-processing : Image pre-processing was performed using the Matlab tool-box SPM8 (Wellcome Department of Imaging Neuroscience, University College, London). The anatomical image of each subject was segmented using the unified segmentation. For each subject, an anatomical brain mask was created, exclud-ing voxels with less than 50% of brain tissue in subsequent statistical analyses. A six-parameter rigid-body registration of the ASL volumes was carried out in order to reduce undesired effects due to subject motion. Coregistration on grey matter map was then performed based on mutual information. The average of unlabeled volumes was used to estimate the geometrical transformation to apply to each volume. The 60 unlabeled and labeled ASL volumes were pair-wise sub-tracted and averaged in order to obtain a perfusion weighted map per subject. A standard kinetic model [4] was then applied in order to get ASL CBF.
In order to account for inter-subject variations in CBF, each map was nor-malised by the mean perfusion value computed from all voxels containing more than 70% of GM [10]. In patients, tumorous tissue was excluded from the cal-culation. Spatial normalisation parameters estimated during the segmentation step were then applied to the T1 and ASL CBF map in order to normalise the subjects into the ICBM template space [6].
3.2 Influence of first level variance in the model of normal perfusion Quantitative comparison: We compared the basic model of normal perfu-sion, presented in (1), to the model with explicit first level variance estimation, outlined in (2), by means of FPR estimation. FPR estimates were computed by leave-one-out cross-validation on the control group using the tests specified in (3) and (4). Given the absence of correction for multiple comparisons the theoretical FPR was therefore equal to the selected p-value: p=0.05.
With the basic model (1) the FPR was 6.5%, outlining the error made by ignoring first level variance. With the model including first level variance (2), the FPR was reduced to 4.3%. Though the difference was not strong, the FPR of the model including first level variance was closer to the theoretical FPR. Moreover, benefits could potentially be larger in the study of patients presenting more pronounced patterns of noise. As an example, the following subsection illustrates the benefits in a single subject presenting strong ghosting artefacts.
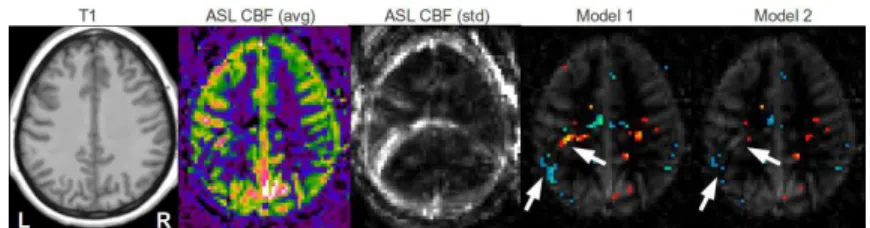
Qualitative comparison: Figure 1 illustrates the benefits of the explicit modeling of first level variance. The ghosting and motion artefacts, outlined by white arrows, indeed corresponds to regions of high standard deviation. Including the first level variance in the model reduces the artefactual detections and enables the comparison of individuals with different patterns of noise.
3.3 Validation of detections
Metrics definition : Quantitative evaluation of the detections and comparison between detection methods are challenging tasks. This is mainly because, like in
Fig. 1.False positive detections in a control subject perfusion map presenting ghosting artefacts. From left to right: T1, ASL CBF, standard deviation of ASL CBF, ASL CBF with hypo- (winter color-map) and hyper-perfusions (hot color-map) overlaid for the basic model (Model 1) and for the model including first level variance (Model 2).
many other medical imaging problems, the ground truth is not clearly stated. We chose to evaluate this framework on patients diagnosed with tumor pathology because perfusion abnormalities are better understood in this context. Based on clinical knowledge, we set the following rules to get an idea of the specificity and sensitivity of the methods. It is however important to keep in mind that in the absence of a known delineation of the actual hyperperfusion and hypoperfusion, true specificity and sensitivity cannot be calculated:
– pseudo-specificity: According to clinical knowledge, in the absence of metas-tasis, the perfusion abnormalities should be confined to the affected tissue (tumor and oedema) identifiable on T1-Gd and T2. The proportion of the non-affected tissue undetected was used as a measure of pseudo-specificity. – pseudo-sensitivity: Though hyperperfused regions can be extended out of
the T1-Gd hyper-signal, these hypersignals are nevertheless indicative of the presence of hyperperfusions [12]. The proportion of the hyper-signal in T1-Gd detected as hyperperfusion was used as a measure of pseudo-sensitivity. Tumor segmentation was done using a semi-automated method based of the T2 and T1-Gd images and visually inspected by an expert neuro-radiologist. One subject was excluded in the pseudo-specificity calculation because its T1-Gd hyper-signal was located in the cerebellum out of the coverage of the template.
Quantitative evaluation: Table 1 presents the specificity and pseudo-sensitivity obtained with different parameters. Based on these criteria we cannot identify a method as being definitely better than the other. This study however outlines the different behaviors of the two methods. The GLM with FDR cor-rection appears to be more conservative with a smaller FPR at the cost of false negatives. According to these measures, the choice of the method will therefore depend on the application as a trade-off between specificity and sensitivity.
Qualitative comparison: Though the quantitative analysis did not outline significant difference between the a contrario and the GLM methods, there are however strong differences when looking at the detections patient by patient. We
Table 1.Pseudo-sensitivity and pseudo-specificity of detections for GLM with different full width at half maximum w (in mm3
) smoothing kernels and a contrario methods with different sphere radii r (in voxels).
GLM a contrario w= 2 w = 4 w = 6 w = 8 w = 10 r= 1 r = 2 pseudo − sensitivity 0.29 0.31 0.32 0.33 0.34 0.37 0.53 pseudo − specif icity 0.98 0.97 0.96 0.95 0.94 0.96 0.89
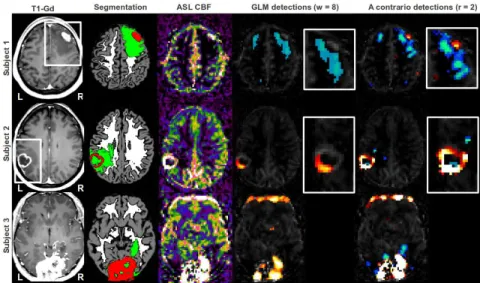
chose three subjects to illustrate this argument. Figure 2 presents the detections obtained by GLM with smoothing kernel of 8 and a contrario with sphere radius of 2 which are the parameters leading to the best visual results for each method. Subject 1 is affected by a tumor in the right frontal lobe. The hypoperfusion of the oedema is detected by both the GLM and the a contrario methods. However only the latter is able to outline the central hyperperfusion. Subject 2, presents a left temporal glioblastoma characterised by a ring shaped hypersignal. While the a contrario approach detects most of the hypersignal ring, the GLM detection is restricted to the area presenting the highest level of hyperperfusion. Subject 3 suffers from a meningioma of both occipital lobes, the hyperperfusion is correctly detected by both methods. The a contrario method detects additional hypoper-fusions in the oedema. Both methods detect an artefactual hyperperfusion, due
Fig. 2.Detection of perfusion abnormalities based on GLM and a contrario methods on 3 representative patients with brain tumors. From left to right: T1-Gd, Segmentation in GM (grey), WM (white), oedema and necrosis (green) and T1-Gd hypersignal (red), ASL CBF with hypoperfusions (winter color-map) and hyperperfusions (hot color-map) overlaid, close-ups in the regions outlined by a white frame in the T1-Gd.
to motion, in the frontal lobe. The a contrario approach also detects artefactual hypoperfusions due to motion in the occipital lobe.
4
Conclusion
We have presented a comprehensive framework for the detection of brain perfu-sion abnormalities in individual patients by comparison to a template of healthy subjects. We outlined the interest of modeling the first level variance in the perfusion models. In future work, this might ease the analysis of patient data characterised by a higher level of motion and related artefacts. It also opens the field to comparison between ASL sequences displaying different patterns of noise. We applied this model to 12 patients suffering from brain tumors and compared an original method, the a contrario approach, to the classical GLM with FDR correction. Quantitative analysis outlined the conservativeness of the GLM, leading to a low FPR at the cost of more false negatives. In radiological practice, the FPR is however less pregnant since false positives can easily be ruled out by a clinician. In a qualitative analysis we pointed out the benefits of the a contrario approach: a better conservation of the hypoperfusions and hyperperfusions boundaries and a greater sensitivity. This increase in sensitivity might be crucial in the study of pathologies presenting more subtle patterns of abnormal perfusion such as multiple sclerosis.
References
1. Aguerrebere, C., Sprechmann, P., et al.: A-contrario localization of epileptogenic zones in SPECT images. In: ISBI. pp. 570–573. IEEE (2009)
2. Alsop, D.C., Detre, J.A., Grossman, M.: Assessment of Cerebral Blood Flow in Alzheimers Disease by Spin-Labeled Magnetic Resonance Imaging. Annals of neu-rology 47(1), 93–100 (2000)
3. Beckmann, C.F., Jenkinson, M., Smith, S.M.: General multilevel linear modeling for group analysis in FMRI. NeuroImage 20(2), 1052–63 (2003)
4. Buxton, R.B., Frank, L.R., et al.: A general kinetic model for quantitative perfusion imaging with arterial spin labeling. MRM 40(3), 383–96 (1998)
5. Chen, G., Saad, Z.S., et al.: Fmri group analysis combining effect estimates and their variances. NeuroImage 60(1), 747–765 (2012)
6. Crinion, J., Ashburner, J., et al.: Spatial normalization of lesioned brains: perfor-mance evaluation and impact on fmri analyses. NeuroImage 37(3), 866–75 (2007) 7. Desolneux, A., Moisan, L., Morel, J.: A grouping principle and four applications.
TPAMI 25(4), 508–513 (2003)
8. Detre, J., Leigh, J., et al.: Perfusion imaging. MRM 23, 37–45 (1992)
9. Maumet, C., Maurel, P., et al.: A contrario detection of focal brain perfusion ab-normalities based on an ASL template. In: ISBI. pp. 1176–1179 (2012)
10. Petr, J., Ferre, J.C., et al.: Construction and evaluation of a quantitative arterial spin labeling brain perfusion template at 3t. In: ISBI. pp. 1035–1038. IEEE (2011) 11. Rousseau, F., Blanc, F., et al.: An a contrario approach for outliers segmentation:
Application to Multiple Sclerosis in MRI. ISBI pp. 9–12 (2008)
12. Weber, M.A., Zoubaa, S., et al.: Diagnostic performance of spectroscopic and per-fusion MRI for distinction of brain tumors. Neurology 66(12), 1899–906 (2006)