HAL Id: lirmm-01391953
https://hal-lirmm.ccsd.cnrs.fr/lirmm-01391953
Submitted on 4 Nov 2016
HAL is a multi-disciplinary open access
archive for the deposit and dissemination of
sci-entific research documents, whether they are
pub-lished or not. The documents may come from
teaching and research institutions in France or
abroad, or from public or private research centers.
L’archive ouverte pluridisciplinaire HAL, est
destinée au dépôt et à la diffusion de documents
scientifiques de niveau recherche, publiés ou non,
émanant des établissements d’enseignement et de
recherche français ou étrangers, des laboratoires
publics ou privés.
a differential recording mode of electrocorticographic
signals
François Bonnetblanc, Marion Vincent, Olivier Rossel, David Guiraud,
Hugues Duffau
To cite this version:
François Bonnetblanc, Marion Vincent, Olivier Rossel, David Guiraud, Hugues Duffau. A measure of
cortico-cortical potentials evoked by 10Hz direct electrical stimulation of the brain and by means of a
differential recording mode of electrocorticographic signals. EMBC: Engineering in Medicine and
Biol-ogy Conference, Aug 2016, Orlando, FL, United States. pp.4543-4546, �10.1109/EMBC.2016.7591738�.
�lirmm-01391953�
Abstract— Direct electrical stimulation (DES) at 60 Hz is used to perform real-time functional mapping of the brain during wide-awake neurosurgery. The electrophysiological effects of DES are largely unknown, locally and at a more remote distance. Here, by lowering the DES frequency to 10 Hz and by using a differential recording mode of electro-corticographic (ECoG) signals to improve the focality, we were able to record cortico-cortical evoked potentials easily with standard current amplitude of stimulation (2 mA). DES applied at 10 Hz and differential recording of ECoG could be used to map on-line the connectivity between different sub-cortical and cortical areas with a higher spatial accuracy.
I. INTRODUCTION
DES is used to perform real-time functional mapping of the brain while the patient is awake. This intraoperative use of DES has been widely recommended for the neurosurgery of slow-growing and infiltrative brain tumors, to guide the resection [1]. Generally DES is applied at 60 Hz in Europe (50 Hz in some countries) (biphasic stimuli, single pulse duration 1 ms, intensity from 2 to 6 mA under local anesthesia, and during 1 to 5 s) and generates transient perturbations, allowing the real-time identification of both cortical areas and subcortical white matter pathways that are essential for the function. Its use lowers the probability of resecting essential functional areas near or within the tumor. However, the electrophysiological effects of DES remain poorly understood, locally and at a more remote distance [2, 3]. The investigation of this topic requires in part the recording of evoked potential. DES can be used to probe the spatiotemporal connectivity and dynamics of short- or long-range networks in vivo and in real time when combined with electrophysiological recordings (e.g. electroencephalography (EEG) or ECoG). This approach has been used for pre-surgical planning of drug-resistant epileptic patients by using ECoG and a grid implanted at the surface of the grey matter. Matsumoto et al. [4, 5] sought to measure in vivo connectivity with DES (rather than study its propagation) but
*François Bonnetblanc and David Guiraud contributed equally to this work.
M. Vincent, O. Rossel, F. Bonnetblanc and D. Guiraud are with the National Institute for Research in Informatics and Automatics (INRIA), 34095 Montpellier, France (corresponding author e-mail
marion.vincent@inria.fr).
H. Duffau is with the Department of Neurosurgery, University of Montpellier, and the Institute of Neurosciences, INSERM U-1051, Hopital Saint-Eloi, 34095 Montpellier, France.
F. Bonnetblanc is also with the Team Cognition, Action and Sensorimotor Plasticity, UFR-STAPS, INSERM U-1093, University of Bourgogne Franche-Comté, 27877 Dijon, France and the French University Institute, 75005 Paris.
observed that the low-frequency cortical application of DES (1 Hz, constant current, and alternating rectangular wave pulses of 0.3 ms) induces ‘cortico-cortical’ evoked potentials (CCEPs) around 10 – 50 ms after stimulation.
Moreover, in only two studies the presence of axono-cortical evoked potentials (ACEPs) has been highlighted during the propagation of 1 Hz DES between white matter pathways and connected cortical sites [6, 7]. Despite technical differences between these two studies (monophasic pulses of alternating polarity and a monopolar electrode, and classical DES parameters used in awake surgery respectively), they reported a similar negative waveform for the ACEP with a negative peak that occurred between 10 and 20 ms and a quite large width around 40 ms. These properties are incompatible with the detection of EPs when DES is classically applied at 60 Hz due to stimulation artefacts.
However previous studies were performed at a very low frequency (1 Hz) and although single-pulse stimuli can produce CCEPs and ACEPs, it has not been yet demonstrated that DES at higher frequency affects the whole network in the same manner [2, 3]. In contrast, 100 ms seems to be a sufficient time-window that facilitates real-time averaging to detect these CCEPs and ACEPs for further on-line analysis of brain connectivity during the surgery. In addition, ECoG signals are generally recorded in a classical common mode configuration where the signal is measured between each channel of interest and a reference electrode. However, it is possible to increase the focality and the signal to noise ratio by using a differential mode in which the signal is measured between two adjacent electrodes.
In the present work, we compared 10 Hz and 60 Hz DES effects on ECoG recordings in a differential mode and investigate whether it is possible to detect both CCEPs and ACEPs at 10 Hz with a higher spatial accuracy, and to analyze some of their properties.
II. METHODS A. Patient
This paper reports the case of a right-handed 31-year old patient who underwent a surgery for a low-grade brain glioma of the left pre-central gyrus (rolandic area of the left hemisphere). The present study protocol was approved by the Ethic Committee of the University Hospital Center of Montpellier (protocol: UF 965, n° 2014-A00056-43). The patient gave its signed written informed consent to participate in the study.
A Measure of Cortico-Cortical Potentials Evoked by 10Hz Direct
Electrical Stimulation of the Brain and by Means of a Differential
Recording Mode of Electrocorticographic Signals
Marion Vincent, Member, EMBS IEEE, Olivier Rossel, Hugues Duffau, Francois Bonnetblanc* and
David Guiraud*, Member, EMBS IEEE
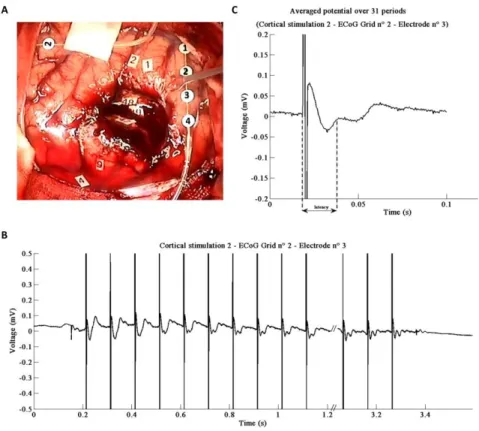
ECoG was recorded intra-operatively after the tumor resection, under general anesthesia. Two 4-contact strip of ECoG electrodes (2.5 mm exposed surface platinum contacts, 10 mm spaced, Integra LifeScience, France) were positioned on the surface of the brain (Fig. 1A and Fig. 2A).
ECoG signals were recorded using differential (contacts 1 to 3) and common mode (contact 4) configurations. For the classical common mode configuration the signal is measured between each channel of interest (anode) and a reference electrode (cathode). Here, a cupuled-electrode located on the left mastoid (ipsilateral to the surgery) served as reference. For the differential mode, both anode and cathode are two adjacent electrodes of one strip. Importantly, this method is not classically used but is less sensitive to noise by being independent from the positioning of the reference electrode. All channels were grounded to a patch-electrode located on the left acromion.
ECoG signals were sampled at 10 kHz (PowerLab, ADInstrument) and band-pass filtered from 0.5 Hz to 1 kHz. To avoid the saturation of the front–end amplifier (g.BSamp, G.tec, Austria), signals were recorded with a gain of 1,000. The 50 Hz Notch filter integrated in the amplifier was on. Unused amplifier’s channels were bypassed.
C. Direct electrical stimulation (DES) and anatomical sites of stimulation
Usual cortical and white matter mappings were completed on the awake patient (Nimbus, Captomed, France). DES was delivered thanks to a bipolar probe (1 mm diameter electrode tips, 6 mm apart). Constant-current biphasic square wave pulse of 1 ms duration was applied at a fixed frequency of 60 Hz. The current intensity was set to 2 mA. Cortical stimulations in 1 and 2 lead to complete anarthria that identifies the premotor ventral cortex in the lateral part of the precentral gyrus. The subcortical mapping highlighted the different language pathways (Fig. 1 and Fig. 2). Laterally, in 48, stimulations of the superior longitudinal fasciculus generate also a complete anarthria. Articulatory troubles but also facial movements representative of the pyramidal tracts are induced more mesially, in 47. At the bottom of the cavity, and more anteriorly than previously, in 49, the stimulations lead to semantic paraphasia suggesting the presence of the inferior fronto-occipital fasciculus.
To study more precisely the electrophysiological effects of DES and try to record EPs, stimulations were performed in five of the specific functional sites determined during the awake part of the surgery. Both 60 Hz and 10 Hz DES were applied under general anesthesia. Cortical DES occurred in two sites located near the contact 2 of each ECoG strip, namely in pars opercularis of the left inferior frontal gyrus – i.e. ‘Broca’s area’ and the posterior part of the superior temporal gyrus – i.e. ‘Wernicke’s area’ (Fig. 1A and Fig. 2A). Three DES were then delivered subcortically, with the electrodes oriented along the different language pathways: the inferior fronto occipital fasciculus (49), the superior longitudinal fasciculus (48) and the pyramidal tract (47).
Mean EP traces were obtained by averaging ECoG signals time-locked to the DES, upon a time window equal to the period of stimulation (100 ms at 10 Hz). The number of stimuli ranged from 31 to 57 for the 10 Hz DES depending on the duration of the contact provided by surgeon upon the tested area.
III. RESULTS
Initial (sub)-cortical mapping at 60 hertz (tags) and electrodes strips of ECoG are shown in Figure 1a and 2a. After the resection was completed, and under general anesthesia, DES was applied on two cortical sites and three white matter at 60Hz and 10Hz, for durations ranging from 3.1 to 5.8 s.
For cortical DES, CCEPs were observed only for the electrodes 2 and 3 of the right strip for the second stimulation. CCEPs were not detected on all the other electrodes of both strips. For subcortical DES of white matter pathways, no pattern of ACEPs was detected for both ECoG strips. Importantly, in the vein of the focality of our recordings (one electrode only allows recording CCEP), note that electrodes 1-3 were in a differential mode for both ECoG strips.
This second cortical stimulation site was identical in both cases (electrodes 2 and 3, right strip) presented here. However between the two stimulations, the right ECoG strip was further displaced upper and on the right. Thus, in the second case the electrode 3 was nearly at the previous location of electrode 2 (Fig. 1A and Fig. 2A).
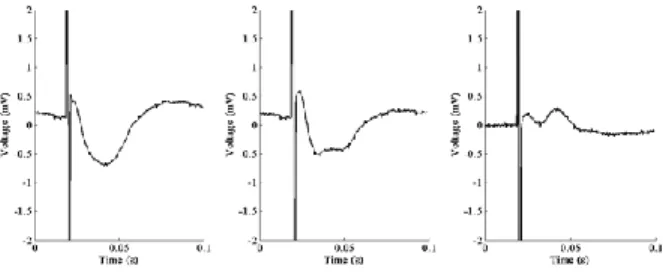
A subset of the raw signal and the averaged potential for each electrode are shown in Fig. 1 B-C and Fig. 2. B-C respectively. Mean CCEPs were obtained by averaging 37 potentials for electrode 2 and 31 for electrode 2. For both cases, the mean potential contains an initial negative deflection after DES artifact (with a latency of 23.7 ± 0.78 ms and 20.6 ± 3.6 ms respectively after the beginning of DES artifact) followed by a positive increase (with a latency of 59.4 ± 7.1 ms and 45.4 ± 6 ms respectively after the beginning of DES artifact). In addition, at the end of the first recording and for the second one, for the negative deflection, a double peak could be observed. This oscillation was identified as the superimposed impulse response of the amplifier Notch filter. This phenomenon is stronger when the amplifier saturates due to a higher artifact (Fig. 3).
IV. DISCUSSION
To the best of our knowledge, this is the first report about the recording of CCEPs with a differential ECoG recording mode and for bipolar and biphasic DES applied at 10 Hz. The differential mode improved the spatial accuracy of the ECoG measurements and allowed a better signal to noise ratio. Indeed, even without averaging, CCEPs can be detected and quantified accurately. It may also explain that CCEPs were measured on a single electrode despite the proximity to DES sites. Besides, the impulse response of the Notch filter has been characterized. Thus, it will be possible to withdraw it from the signal and thus used to avoid misidentified CCEP. This latter point is important since this analysis was never investigated nor even mentioned in previous works.
Figure 1. A: DES is applied cortically near the second electrode of the ECoG strip 2 during 3.7 s. B: Magnified view of the ECoG signal corresponding to the stimulation (with the 104 gain). CCEPs can be observed after each stimulation artefact. The last CCEPs are distorted due to the amplifier response. When
the amplified signal exceeds the [-5 ; +5 ] volts range, an oscillation appears. C: Mean CCEP over 37 stimuli, with a latency of 23.7 ± 0.78 ms.
Figure 2. A: DES is applied cortically near the second electrode of the ECoG strip 2 during 3.1 s. B : Magnified view of the ECoG signal corresponding to the stimulation (with the 104 gain). CCEPs can be observed after each stimulation artefact but are distorted after 4 stimuli. C: Mean CCEP over 31 stimuli,
Figure 3. A: Evoked potential when the amplifier does not saturate. B: EP with saturation of the amplifier. C: Oscillation due to both saturation
and Notch filter obtained by substracting A with B.
In addition, in the literature cited above, only averages of signals are presented, but no raw data sets.
When methodological precautions are taken, the recording of CCEPs is possible under 10 Hz DES. In contrast to the previous 1 Hz DES procedure, it allows averaging data on a 10 times smaller duration i.e. more stable regarding surgeon application of the electrode over the brain. Moreover, for on-line processing during the surgery, the method stabilizes 10 times quicker to get accurate data.
In previous studies [5], CCEPs recordings were performed for 1 Hz biphasic stimulation applied with in a bipolar fashion to two adjacent subdural electrodes. In addition, the presence of axono-cortical evoked potentials (ACEPs) has been highlighted during the propagation of 1 Hz DES between white matter pathways and connected cortical sites [5, 6]. Despite, some technical differences with these studies, we observed a similar waveform. The measured latencies of the first negative peak were around 20 ms in accordance with those measured in Matsumoto’s group both for CCEPs and ACEPs [4, 5]. In contrast, Mandonnet et al. [6] measured shorter latencies for ACEPs (~ 10 ms). There is no precise explanation for these differences since ACEPs first propagate in the white myelinated pathways before being distributed in a cortical network where axons are not myelinated, thus constituting a limiting factor for a faster propagation. This interpretation is reinforced by the fact that the duration of the negative deflection of the observed CCEPs and ACEPs is large (~ 40 ms) suggesting that during their propagation, EPs cross over non-myelinated fiber, which anatomically makes sense. Usually, it is considered that about 0.5 ms are necessary for the signal to cross one synapse and the conduction velocity in non-myelinated fibers is about [0.4, 2] m/s [7]. Mandonnet et al. [6] suggest that the latencies observed for the negative peak are twice that measured by Yamao et al. [5] and maybe due to a DES applied about 2 times further on the axon. This interpretation is correct if it is assumed that slow myelinated axons may propagate the evoked potentials (min conduction velocity ~ 10 m/s) and cannot stand for a propagation along fast myelinated axons (max conduction velocity ~ 100 m/s). In the same vein, despite DES was applied very close to the recording site in our case (< 5 mm), the latencies differences that we measured with respect to Mandonnet et al. study [6] may also be explained by an indirect cortico - local U fibers
be limiting for the conduction velocity. Despite a DES frequency 10 times higher, in our study, it seems that the network generates the same response measured by the evoked potentials.
V. CONCLUSION
Cortico-cortical potentials evoked by 10 hertz DES were measured with an improved spatial accuracy thanks to a differential mode of ECoG recordings. Ongoing experiments on new patients corroborate the reproducibility of this protocol. This unusual way of recording ECoG could improve the spatial resolution of the recordings in the three dimensions (in surface and in depth). Moreover, this method was used under general anesthesia but could also be performed on-line during the awake surgery. It would enable the investigation of the connectivity and to probe directly rapid plastic changes of cortical excitability.
REFERENCES
[1] H. Duffau, “Lessons from brain mapping in surgery for low-grade glioma: insights into associations between tumour and brain plasticity”, The Lancet
Neurology, vol. 4, no. 8, pp. 476-486, 2005.
[2] M. Vincent, O. Rossel, M. Hayashibe, G. Herbet, H. Duffau, D. Guiraud and F. Bonnetblanc, “The difference between electrical microstimulation and direct electrical stimulation – towards new opportunities for innovative functional brain mapping?”, Reviews in the Neurosciences, vol. 27, no. 3, pp. 231-258, 2015.
[3] M. Vincent, O. Rossel, B. Poulin-Charronnat, G. Herbet, M. Hayashibe, H. Duffau, D. Guiraud and F. Bonnetblanc, “Case report: Remote neuromodulation with direct electrical stimulation of the brain, as evidenced by intra-operative EEG recordings during wide-awake neurosurgery”, Clinical Neurophysiology, vol. 127, no. 2, pp. 1752-1754, 2016.
[4] R. Matsumoto, D. Nair, E. LaPresto, W. Bingaman, H. Shibasaki and H. Luders, “Functional connectivity in human cortical motor system: a cortico-cortical evoked potential study”, Brain, vol. 130, no. 1, pp. 181-197, 2006.
[5] Y. Yamao, R. Matsumoto, T. Kunieda, Y. Arakawa, K. Kobayashi, K. Usami, S. Shibata, T. Kikuchi, N. Sawamoto, N. Mikuni, A. Ikeda, H. Fukuyama and S. Miyamoto, “Intraoperative dorsal language network mapping by using single-pulse electrical
stimulation”, Human Brain Mapping, vol. 35, no. 9, pp. 4345-4361, 2014.
[6] E. Mandonnet, Y. Dadoun, I. Poisson, C. Madadaki, S. Froelich and P. Lozeron, “Axono-cortical evoked potentials: A proof-of-concept study”,
Neurochirurgie, vol. 62, no. 2, pp. 67-71, 2016.
[7] E. Kandel, Principles of neural science. New York: McGraw-Hill, pp. 444, 2013.