HAL Id: hal-02992205
https://hal.archives-ouvertes.fr/hal-02992205
Submitted on 22 Dec 2020
HAL is a multi-disciplinary open access
archive for the deposit and dissemination of
sci-entific research documents, whether they are
pub-lished or not. The documents may come from
teaching and research institutions in France or
abroad, or from public or private research centers.
L’archive ouverte pluridisciplinaire HAL, est
destinée au dépôt et à la diffusion de documents
scientifiques de niveau recherche, publiés ou non,
émanant des établissements d’enseignement et de
recherche français ou étrangers, des laboratoires
publics ou privés.
Magnetic force fields of isolated small nanoparticle
clusters
C. Iacovita, J. Hurst, G. Manfredi, P. A. Hervieux, B. Donnio, J. L. Gallani,
M. V. Rastei
To cite this version:
C. Iacovita, J. Hurst, G. Manfredi, P. A. Hervieux, B. Donnio, et al.. Magnetic force fields of
iso-lated small nanoparticle clusters. Nanoscale, Royal Society of Chemistry, 2020, 12 (3), pp.1842-1851.
�10.1039/C9NR08634J�. �hal-02992205�
Magnetic force fields of isolated small nanoparticles clusters
†
C. Iacovita,
a,bJ. Hurst,
cG. Manfredi,
aP. A. Hervieux,
aB. Donnio,
aJ. L. Gallani,
aand M. V. Rastei
∗aReceived
First published on
The usage of magnetic nanoparticles (NPs) in applications necessitates a precise mastering of their properties at single nanopar-ticle level. There has been a lot of progress in the understanding of the magnetic properties of NPs, but incomparably less when interparticle interactions govern the overall magnetic response. Here, we present a quantitative investigation of magnetic fields generated by small clusters of NPs assembled on a dielectric non-magnetic surface. Structures ranging from individual NPs to fifth-fold particulate clusters are investigated in their magnetization saturation state by magnetic force microscopy and numerical calculations. It is found that the magnetic stray field does not increase proportionally with the number of NPs in the cluster. Both measured and calculated magnetic force fields underline the great importance of the exact spatial arrangement of NPs, shedding light on the magnetic force field distribution of particulate clusters, which is relevant for the quantitative evaluation of their magnetization and perceptibly for many applications.
1
Introduction
Stable and well characterized magnetic nanoparticles (NPs) are much sought after in many research fields. In particular, bio-related applications making use of iron-oxide NPs (mag-netite - Fe3O4and maghemite - Fe2O3) are currently one of
the pharmaceutical markets with the fastest growth1,2. Such
nanoparticles are now intensively used in biomedical imag-ing, diagnostic and therapeutic applications3–7. Their rather easy synthesis8–10, along with their peculiar magnetic prop-erties11and relatively low toxicity12,13also make them ideal candidates as contrast agents for magnetic resonance imag-ing (MRI)14–17, heat generators for cancer treatment by mag-netic hyperthermia18–21, as well as carriers in drug delivery systems22,23. As always the case for any compound which is meant to be used in human health, there are stringent re-quirements on the properties of these materials. From the nanometer-scale interaction point of view, the magnetic prop-erties of NPs is of utmost importance for the entire spectrum of applications24. For example, the local magnetic field
sur-rounding the NPs is crucial for self-organization of NPs in solutions and on surfaces25,26. Or, the magnetic field of NPs
is key for the magnetic relaxation-based detection, which is not limited to MRI imaging27. Magnetic relaxation-based detection exploits the local magnetic field generated by NPs by altering the spin-spin relaxation time of nearby molecules.
aInstitut de Physique et Chimie des Mat´eriaux de Strasbourg, CNRS,
Univer-sit´e de Strasbourg, F-67034 Strasbourg, France. Tel: 33 38810 7158; E-mail: [email protected]
bDepartment of Pharmaceutical Physics-Biophysics, Faculty of Pharmacy,
”Iuliu Hatieganu” University of Medicine and Pharmacy, Pasteur 6, 400349 Cluj-Napoca, Romania
cDepartment of Physics and Astronomy, Uppsala University, P. O. Box 516,
SE-75120 Uppsala, Sweden
In MRI detection scheme the additional homogenous external magnetic field is high enough to enable a magnetization satu-ration state of NPs. In any case, the study of NPs in their mag-netic saturation state is consequently of critical importance.
The local magnetic field is nonetheless strongly modified by aggregation, an effect which has been recognized quite early to further enhance the rate of transverse spin relaxation of nearby water molecules for instance27–30. An efficient im-plementation of NPs in applications is consequently strongly related not only to their saturation magnetization - an active research field in synthetic inorganic chemistry - but also to the magnetic properties of NPs, which has been shown to be im-pacted by the degree of clustering22,31–35, or the formation of controlled multicore particulate architectures36–38. The char-acterization of the local magnetic field generated by either in-dividual or few interacting NPs (hereafter referred to as clus-ters) is, therefore, also of great interest.
Here, we present an experimental and theoretical study on a quantitative evaluation of the magnetic force fields created by clusters consisting of 1 to 5 NPs. A homogeneous external magnetic field able to saturate the magnetization of NPs has been used. It was found that the local magnetic force fields do not increase proportionally with the number of NPs in the clus-ters. Moreover, minute modifications of the spatial arrange-ment of NPs in the cluster were found to drastically modify the magnetic stray field, which in turn has a great impact on the quantitative determination of the magnetic moments of the clusters. In particular, it is shown that at distances smaller than the size of the clusters, the NPs do not equally participate to the measured signal, yielding to an overestimation of the magnetic moment of clusters when using a two-dipole model. This model is nevertheless shown to be suited for distances exceeding some critical values, which can be roughly approx-imated as twice the diameter of NPs forming the clusters. For
measurements performed at larger distances, the application of the two-dipole model leads to a good estimation of the mag-netic moments, improving further for clusters having a com-pact configuration.
Our numerical analyses were carried out by virtually split-ting both the tip and the clusters into a large number of mi-croscopic elements, permitting a full pairwise integration of magnetostatic potentials. This method allows taking into ac-count the exact geometry of both tip and sample, which is cru-cial in the present study. Using the numerical results given by our model in combination with the experimental findings, we bring unprecedented insights into the quantitative evalua-tion of the magnetic field generated by clusters of NPs. The importance of the tip-sample distance and of the spatial orga-nization of the particulate clusters is clearly emphasized. The results shed light on the magnetic force field distribution near clusters of NPs, which is relevant for a broad range of appli-cations.
2
Experimental and modeling considerations
The investigation of the local field distribution above magnetic nanostructures of dimensions down to a few nanometers can be experimentally achieved by means of either magnetic force microscopy (MFM)39or electron holography40. The former technique has been extensively used in the last two decades and is now a mature approach, providing unique information about nanoscale magnetism of on-surface41,42, immersed43or embedded nanostructures44. MFM uses the attractive and/or repulsive magnetostatic interactions established between the magnetic probe of the microscope and the near-field magnetic stray field emerging from the nanostructure, yielding a force gradient image. The signal is generally measured by con-verting the local magnetostatic interaction to an amplitude or phase change of the vibrating cantilevered MFM tip39,41. In a first approximation, the phase shift of the cantilever vibration can be written as a function of the gradient force along the z-direction:
∆ϕ=−Q k
∂Fz
∂z , (1)
where Q is the oscillation quality factor of the cantilever, and k is the cantilever spring constant. For quantitative informa-tion, the phase shift needs to be probed at various tip-sample distances. This is in order to allow a 3D imaging of the mag-netic field distribution generated by the magmag-netic nanostruc-ture39,45. Moreover, a quantitative interpretation of the phase shift is also complex, since it depends on the detailed mag-netic properties of the tip46,47. A few experimental studies have nevertheless proven feasible the extraction of quantitative information, such as magnetization or coercive fields, provid-ing that the exact spatial distribution of the tip magnetization is known48–51. Nonetheless, in many studies the two-dipole model52was used to interpret the experimental findings53–55.
The two-dipole model, also called point-probe model, re-places the magnetic nanostructure by a unique magnetic dipole moment, and idealizes the tip magnetization by a magnetic dipole moment which is virtually located in the tip at a certain distance from the apex52. Within this model, the phase shift of the cantilever is directly proportional to the nanostructure magnetic dipole moment and to the magnetic dipole moment of the tip52. This two-dipole model has been successfully applied for extracting quantitative magnetic information, par-ticularly on nanostructures able to generate field geometries similar to those used for the tip calibration56–58. Accordingly, spherical NPs with known magnetization have been employed to calibrate the magnetic tips, which were subsequently used to determine the magnetic moment of other spherical NPs or clusters58,59,63.
Our experiments have been performed in ambient con-ditions using an ICON-AFM apparatus controlled by a Nanoscope V electronics. The topographic images have been acquired in tapping mode, while the lift mode was used for the magnetic (MFM) imaging. The tip-sample distance has been determined by adding at the mean topographic scan height (30 nm) to the tip-lift values used in the MFM scan. The spring constant of the used cantilevers was between 2 and 3 N/m and their resonance quality factor ranged between 500 and 1000. The probes were silicon tips covered with a hard magnetic coating presenting a coercive field of about 250 Oe. A mag-netic field of 0.5 T was permanently applied in all experiments reported in this work. This field is high enough to saturate both the magnetic MFM probe and the NPs. Other details about the experiments are described in Sec. SI3. A characterization of the tip magnetic properties in the framework of two-dipole model is presented in Sec. SI4. The magnetic moments of the NPs evaluated with the two-dipole model are in Sec. SI5.
The numerical simulations were conducted by considering the real geometry of the tip and of the NPs number and or-ganization. The configuration used in simulations is sketched in Fig. SI9. The advantage of our simulation model is that it considers a tip and a sample composed of small magnetic ele-ments (meshes), which better account for the geometry of the systems. A magnetic moment corresponding to the respective volume is associated to each mesh element. Various meshes sizes have been checked, until a convergence was obtained. This typically corresponds to square meshes of a lateral sizes below 2 nm (see Sec. SI6). The experimental height of the tip H was also considered to get a convergence of the calculated force. The elementary force between two elementary mag-netic elements of magmag-netic moments ⃗M1and ⃗M2separated by ⃗r, reads: ∆ ⃗F (M⃗1, ⃗M2,⃗r)= 3µ0 4π r5 [ ⃗ M2 ( ⃗ M1·⃗r ) + ⃗M1 ( ⃗ M2·⃗r ) + + ⃗r ( ⃗ M1· ⃗M2 ) −5(M⃗1·⃗r)(r2M⃗2·⃗r)⃗r ] . (2)
For a saturated magnetization along z-direction, the total
0 100 200 300 400 0.0 0.2 0.4 0.6 0.8 1.0 Phase shift (de gre e) Lateral displacement (nm) 0 100 200 300 400 0.0 0.2 0.4 0.6 0.8 1.0 Phase shift (de gre e) Lateral displacement (nm) 0 100 200300 400 0.0 0.2 0.4 0.6 0.8 1.0 Phase shift (de gre e) Lateral displacement (nm) 0 100 200 300 400 0.0 0.2 0.4 0.6 0.8 1.0 Phase shift (de gre e) Lateral displacement (nm) 0 100 200 300 400 0.0 0.2 0.4 0.6 0.8 1.0 Phase shift (de gre e) Lateral displacement (nm) 0 100 200 300 400 0.0 0.2 0.4 0.6 0.8 1.0 Phase shift (de gre e) Lateral displacement (nm) 0 100 200 300 400 0.0 0.2 0.4 0.6 0.8 1.0 Phase shift (de gre e) Lateral displacement (nm) 0 100 200 300400 0.0 0.2 0.4 0.6 0.8 1.0 Phase shift (de gre e) Lateral displacement (nm) 0 100 200 300 400 0.0 0.2 0.4 0.6 0.8 1.0 Phase shift (de gre e) Lateral displacement (nm) 0 100 200300 400 0.0 0.2 0.4 0.6 0.8 1.0 Phase shift (de gre e) Lateral displacement (nm) 0.0 0.2 0.4 0.6 0.8 1.0 0 200 400 0.0 0.2 0.4 0.6 0.8 1.0 0 200 400 0.0 0.2 0.4 0.6 0.8 1.0 0 200 400 0.0 0.2 0.4 0.6 0.8 1.0 0 200 400 0.0 0.2 0.4 0.6 0.8 1.0 0 200 400 0.0 0.2 0.4 0.6 0.8 1.0 0 200 400 0.0 0.2 0.4 0.6 0.8 1.0 0 200 400 0.0 0.2 0.4 0.6 0.8 1.0 0 200 400 0.0 0.2 0.4 0.6 0.8 1.0 0 200 400 0.0 0.2 0.4 0.6 0.8 1.0 0 200 400 Ph ase sh ift (° ) Ph ase sh ift (° ) Lateral displacement (nm)
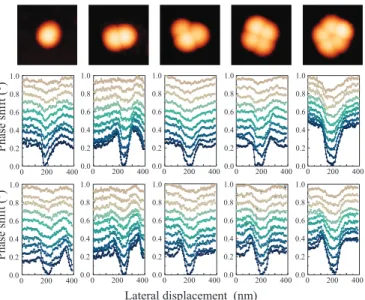
Fig. 1Top row: AFM topographic images (200× 200 nm2) of a single NP and of various clusters made from two to five iron-oxide nanoparticles. The vertical scale bar is 34 nm. Middle row: MFM phase shift profiles (horizontal direction) as a function of tip-sample distance [tip lifts from 20 nm (dark blue) to 65 nm (light brown), val-ues measured with respect to the topographic scan which is at about 30 nm from the sample surface]. Lower row: Phase shift profiles (vertical direction). Profiles are vertically offset for clarity.
magnetic force is then obtained by integrating over the whole system: ⃗ F = ∫ d⃗r′d⃗r′′d⃗F(−−→MNPs(⃗r′),−−→MTip(⃗r′′),⃗r′′−⃗r′ ) , (3)
where m represents the magnetization density. This expression can be numerically evaluated as a function of tip-sample dis-tance z, yielding as well to the first derivative of force versus distance, which can then be compared with the experimental phase shift. Section SI6 is a complete compilation of all pa-rameters used in simulations.
3
Results and discussions
The high-temperature decomposition of magnetic precursors in organic solvents enables the formation of highly crystalline NPs of various sizes, shapes, compositions and magnetic prop-erties10,64. Spherical Fe3O4NPs with diameters of 30 nm± 5
nm with high saturation magnetization values have been used (Sec. SI1 and SI2). Prior to the deposition, the NPs were dispersed in chloroform. The residual traces of water in chlo-roform solvent lead to the assembly of NPs into ring structures of various diameters, as reported elsewhere for gold nanopar-ticles65. In between the ring structures, clusters comprising a different number of NPs can be found (Fig. 1, also Sec.SI1).
3.1 Magnetic phase-signal and two-dipole model
Phase shift profiles as a function of tip-sample distance are shown in Fig. 1. The total magnetic moment of the clusters is expected to proportionally increase with the number of NPs composing the cluster, inducing a proportional increase of the phase shift as well. As seen in Fig. 1, this is not the case, since the variation of the phase shift signal does not scale with the number of NPs in the cluster. It is important to notice that for large distances (80 - 95 nm: light-brownish curves), the phase signal tends, however, to vary proportionally with the number of NPs. We will see below that the phase shift also depend on the spatial arrangement of NPs in the cluster. In any case, the experimental results presented in Fig. 1 already justify a deeper analysis of how the magnetic field generated by different clusters evolves with the number and organiza-tion of NPs. Moreover, experimental observaorganiza-tions also reveal the need to develop an accurate numerical model which can be subsequently used for quantitative characterizations of the magnetic fields generated by clusters of NPs.
3.2 Stray fields of single NPs
We have pursued our analysis by extracting quantitative in-formation on the magnetic moments of various NPs clusters. This was first realized by characterizing the MFM tip on ref-erence samples consisting in six different isolated NPs hav-ing diameters ranghav-ing from 26 nm to 34 nm (Fig. 2 and Fig. SI5). This analysis is a necessary step towards obtaining a quantitative information about the magnetic moment of clus-ters58,59. It is worth noting that the diameters of the NPs have been estimated from height profiles and not from lateral sizes, as lateral dimensions are usually overestimated by tip convo-lution effects59. The convolution effects not being present at the top of a nanoparticle, the extracted diameters of NPs are then in agreement with size histograms obtained from electron microscopy images (Sec. SI2).
Another important issue in non-contact phase imaging is the electrostatic contributions which can interfere with ”mag-netic” phase shifts60. However, since all the measurements presented here are done in the saturation state of the magneti-zation, the electrostatic contribution is negligible as compared to the magnetic signal61. A negligible contribution of the
elec-trostatic field is also indicated by the asymptotic variations of the phase signal with the tip-sample distance, which can only be explained by an insignificant gradient of the electrostatic field in the respective tip-distance interval62. The magnetic field produced by homogenously magnetized spherical NPs (especially at saturation) is hence well approximated to the field of a point dipole positioned at the center of the spherical NP. This is the core of the two-dipole model as used in MFM, and is quite accurate for individual NPs62. The strength of the magnetic field is expected to be proportional to the magnetic moment of the nanoparticle, which in turn increases with its diameter (Sec. SI4).
55 60 65 70 75 1.0 1.5 2.0 2.5 3.0 3.5
dipole magnetic moment of the tip linear fit Dipole ma gn etic m om en t o f th e t ip ( x 10 -17 Am 2) Imaginary location (nm) mtip = d * 0.07221 - 2.75816 R2 = 94,231% S1=26 nm + fit S2=26.5 nm + fit S3=28.5 nm + fit S4=29 nm + fit S5=30 nm + fit S6=34 nm + fit 20 30 40 50 60 70 -0.20 -0.16 -0.12 -0.08 -0.04 0.00 Phase shift (d eg re e) Lift (nm) S1 = 26.0 S2 = 26.5 S3 = 28.5 S4 = 29.0 S5 = 30.0 S6 = 34.0 S1 S2 S3 S4 S5 S6 (a) S1 S2 S3 S4 S5 S6 Virtual -0.08 -0.04 0.00 50 60 70 Phase shift (° ) -0.20 -0.16 -0.12 80 90 100 nm Distance (nm) m t ( x 10 -17 A m 2 ) 2.5 3.0 1.0 1.5 2.0 3.5 (b) 55 60 65 70 75 d tip (nm)
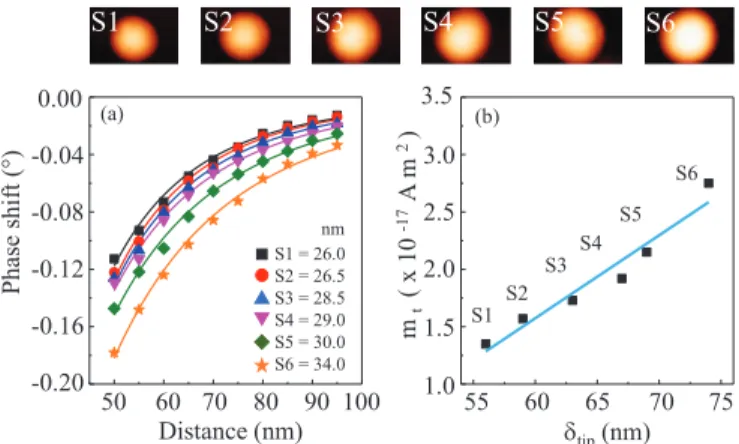
Fig. 2(a) Phase shift of six single NPs of various diameters. Solid lines are fits obtained with the two-dipole model. Insets are topo-graphic images of the investigated NPs (150× 80 nm2). (b) Plot
of the magnetic dipole moment of the tip as a function of its virtual location in the tip volume. Blue line is a linear fit.
Within this description, a slight deviation of the magnetic moment induces a significant modification of the field above the nanoparticles. Consequently, different volumes of the magnetic tip are involved in collecting the magnetic signal. Evolution of the MFM phase shift with the tip-sample dis-tance is perfectly fitted with the two-dipole model, as seen in Fig. 2(a), provided that the magnetic dipole moment of the tip (mtip) as well as its virtual location (δtip) within the tip volume are free fitting parameters. Note the significant variations with the NP diameter. Since the magnetic moment of each NP is well known, the two fitting parameters can be determined as a function of NP diameter. The resulting values are summa-rized in Sec. SI4. Those values are helpful for the subsequent analyses of clusters.
Each pair of parameters (mtip, δtip) reflects the magnetic force field generated by an isolated NP. Both, mtipandδtip, are found to increase as the diameter of the particle increases. The values of mtipare of the order of 10−17Am2, which is in good agreement with known values of magnetic moment of the tips. Plotting the mtipas a function ofδtipresults in a linear depen-dence (Fig. 2). In our case, this dependepen-dence might be trig-gered by the reduced variation in the NPs size, since for fields generated by nanoscale current-carrying parallel lithographed wires, a power-law behavior has been found57.
3.3 Dimers and role of planarity
The calibration of the magnetic tip enables the extraction of magnetic properties of clusters presenting different spatial or-ganizations. For instance, clusters D1 and D2 in Fig. 3 were formed by assembling two NPs (D1: 30 nm and 28.5 nm; D2: 31 nm and 27.5 nm, respectively, also see Fig. SI6). From those sizes, we can consider that both dimers have an identical volume of magnetic material even if their spatial arrangement is different. The main difference between the two dimers is
20 30 40 50 60 70 -0.20 -0.16 -0.12 -0.08 -0.04 0.00 D1 + fit D2 + fit Phase shift (d eg re e) Lift (nm) 20 30 40 50 60 70 1.2 1.4 1.6 1.8 2.0 D1/S4 D2/S4 Dimer/ Single p ha se sh ift Lift (nm) (a) -0.08 -0.04 0.00 50 60 70 Phase shift (° ) -0.20 -0.16 -0.12 80 90 100 Distance (nm) D1 D2 D1 D2 50 60 70 80 90 100 Distance (nm) 1.6 1.8 2.0 Phase shift ra ti o 1.2 1.4 (a) (b)
Fig. 3(a) Phase shift of two dimers (D1 and D2) of different organi-zation. Solid lines are fits obtained with the two-dipole model. The insets are topographic images of D1 and D2 (150× 100 nm2). (b) Distance dependence of the phase shift for the two dimers divided by the phase shift of a single NP.
that, the NPs in D2 do not lie in the same surface plane. They partially overlap (Sec. SI3), appearing in the image in a more compact form than for D1 where both NPs are in the surface plane (Fig. 3).
It is now interesting to realize that the field generated by D2 emerges from a smaller area displaying a larger decay length. This is a simple and clear example of how the NPs in the dimer can impact the MFM signal along a particular direc-tion. Moreover, the phase signal as a function of tip-sample distance (proportionally to the tip lift in MFM) of D2 exhibits a more sloped profile, which means that D2 generates a mag-netic force field with a greater gradient magnitude in the nor-mal direction.
In order to quantify the stray field generated by the clusters and to observe at which distances from the cluster surface the two-dipole model increases its accuracy we calculate the ra-tio between the phase signals of the clusters and of a single NP. As an example, the ratio between the experimental MFM phase shifts recorded for the two dimers (D1 and D2) and a single NP (S4) are displayed in Fig. 3. The NP has been cho-sen in order to approach as close as possible the mean diam-eter of the NPs composing the cluster. As seen, for distances above 80 nm, the D2/S4 ratio is indeed almost 2, in agreement with the two-dipole model (which stipulates that if the mag-netic moment of the investigated cluster is doubled, the phase shift should also double). However, at lower distances, the ra-tio decreases down to about 1.5. The D1/S4 rara-tio starts at 1.7 at the largest distance and smoothly decreases towards 1.2 for the smallest distances [Fig. 3(b)], remaining therefore signifi-cantly lower than the ideal value of 2. These findings suggest in both cases that the tip does not perceive the entire cluster magnetic moment, which is a significant deviation from the-ory.
From the fits,δtip is 79 and 82 nm for D1 and D2, respec-tively. The δtip values are larger in comparison to the ones
20 30 40 50 60 70 1.2 1.6 2.0 2.4 2.8 3.2 Tr1/S5 Tr2/S3 Tr3/S2 Tr4/S2 Tr5/S5 Tr imer /Single ph ase shift Lift (nm) 20 30 40 50 60 70 -0.32 -0.28 -0.24 -0.20 -0.16 -0.12 -0.08 -0.04 0.00 Tr1 + fit Tr2 + fit Tr3 + fit Tr4 + fit Tr5 + fit Phase shift (d eg re e) Lift (nm) Tr 1 Tr 2 Tr 3 Tr 4 Tr 5 (a) (a) -0.08 -0.04 0.00 50 60 70 Phase shift (° ) -0.20 -0.16 -0.12 80 90 Distance (nm) (a) 100 -0.32 -0.28 -0.24 Tr 4 Tr 3 Tr 5 Tr 2 Tr 1 50 60 70 80 90 Distance (nm) 100 2.0 2.4 2.8 1.2 1.6 3.2 (b) Phase shift ra ti o
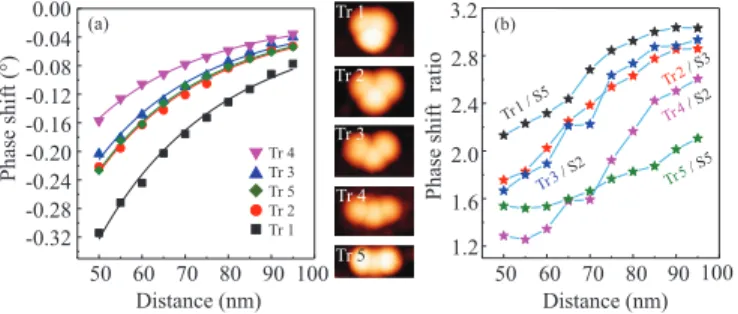
Fig. 4(a) Phase shift of five 3-fold clusters (trimers) of various com-pactness. Solid lines are fits using the two-dipole model. The insets are topographic images of the trimers Tr1 (scale bar: the large side of images is 170 nm). (b) Phase shifts for the five trimers divided by the phase shift of a single NP, reported as a function of tip-sample distance.
obtained for isolated NPs. By applying the linear dependence from Fig. 2(b), the values of magnetic moment of the tip are 2.95× 10⁻¹⁷ Am2and 3.23× 10⁻¹⁷ Am2, when using D1
and D2, respectively. The higher value of the moment ob-served for D2 is due to the compact geometry, as the stray field interacts with a larger tip volume than in the case of D1. Finally, the extracted values of the magnetic dipole moment of D1 and D2 are 6.91× 10⁻¹⁸Am2and 7.69× 10⁻¹⁸Am2, re-spectively. These values represent a percentage of 68.5% and 75.5% of the sum of magnetic moments of the two NPs form-ing the D1 and D2. Consequently, when individuals NPs are getting closer to each other and start clustering, only a frac-tion of the entire magnetic moment is detected by the MFM tip, undermining the two-dipole model. Interestingly, in com-pact geometries, where NPs partially overlaid, the tip starts to perceive the entire magnetic moment for tip-sample distances exceeding roughly twice the diameter of a single NP.
3.4 Trimers, tetramers, pentamers and compactness
It is pertinent to verify this trend and to further investigate the effect of the arrangement of NPs in clusters of higher or-der. The association of a third NP to a dimer leads to a va-riety of geometrical ”trimer” configurations. We analyzed 5 different 3-fold clusters (trimers) (Fig. 4). In Tr1, a NP par-tially superimposes over the other two, giving rise to a slightly out-of-plane and compact triangular configuration when look-ing from above; Tr2 has an almost perfect isosceles in-plane triangular configuration, while Tr3 presents a slightly more open triangular shape. Tr4 is less bent, resembling a linear chain, whereas Tr5 has the two outer NPs in part overlaying the central one, forming a more compact geometry from atop perspective. This has consequences for the field gradient gen-erated in the out-of-plane direction, as discussed below in re-lation with the phase ratio comparison of the trimers.
As highlighted in Fig. 4 (b), the phase shift for 3-fold clus-ters is even more drastically influenced by the NPs arrange-ment. The evolution of the phase shift as a function of distance
is very abrupt in the case of compact Tr1, i.e. the generated magnetic force field has the steepest gradient. The slope of the signal gradually decreases for Tr2 and Tr3, becoming the lowest for Tr4. In others words, as the trimers evolve from a compact triangular configuration to a linear-like chain, the magnitude of the generated magnetic force field decreases. In turn, the force field for Tr5 becomes again comparable with the one of Tr2 and Tr3, effect which is due to the partial over-lapping of outer NPs. Hence, we can conclude that the assem-blage of NPs in linear-like chains generates reduced magnetic force fields above the center of the chain, whereas compact or overlapping NPs geometries yield gradient fields of greater magnitudes.
The phase shift signals on the trimers have also been nor-malized by the phase signal of a single NP. Again, the latter were estimated by averaging the diameters of the NPs consti-tuting the respective trimers (Fig. SI7). The magnetic mo-ments of the trimers were evaluated by applying the same pro-cedure as previously used for the dimers. Assuming for in-stance that the compact Tr1 trimer has a magnetic moment three times larger than the one of a single NP, it is expected that the phase shifts ratio reaches a value of 3 over the entire range of distance. As shown in Fig. 4(b), the ratio is largely below 3 and only tends to this value for distances above 85 nm. For Tr1, the extracted magnetic moment almost equals the sum of the magnetic moments of the individual monomers - 90% recovery (Sec. SI5). In the case of Tr2 and Tr3 - where the apparent surface area increases as a result of the larger spac-ing of the NPs - the recovery percentages are 85.5% and 80%, respectively. The phase shift ratios for Tr2/S3 and Tr3/S2 are close to 3 only for large distances (85 - 95 nm), and steeply fall to 1.7 when the distance decreases to 50 nm [Fig. 4(b)]. The recovering percentage reduces significantly to 66% and 70% for Tr4 and Tr5 clusters, respectively. Accordingly, the
20 30 40 50 60 70 1.5 2.0 2.5 3.0 3.5 4.0 4.5 5.0 Oligom ers/ Single p ha se sh ift Lift (nm) Di/S Tr/S Te/S Pe/S 2.5 3.0 3.5 1.5 2.0 4.0 Oligomer phase shift ra ti o 4.5 5.0 50 60 70 80 90 100 Distance (nm) Di / S
Fig. 5Phase shift of several clusters divided by the phase shift of a single NP. The NP has been chosen with a diameter close to the mean diameter of those composing the cluster. Insets are topographic images of the analyzed clusters.
Tr4/S2 ratio varies very rapidly from 1.3 to 2.6, while Tr5/S5 ratio has a smooth linear trend between 1.5 and 2.
The magnitude of the detected magnetic moment of a clus-ter therefore significantly depends on the degree of compact-ness and on the tip-sample distance. For compact triangular clusters the tip detects a full magnetic moment only at dis-tances exceeding 80 nm. As the separation between NPs in-creases, the recorded magnetic force field dein-creases, affecting the overall magnitude of the magnetic moment of clusters.
We have expanded our study to larger clusters formed by the assembly of four and five NPs. In the case of the ”tetramers” (Te), the NPs are spatially arranged in such way that they are located in the corner of a slightly distorted square, while NPs in ”pentamers” (Pe) form a almost regular pentagon (Fig. 5 & Fig. SI7). The phase shift of the pentamer has a slightly larger magnitude than that given by the tetramer (Fig. SI8). In general, we find that the less compact geometries have a great impact on the magnitude of the extracted magnetic moment. The recovery percentage is 64% and 67% for tetramer and pentamer, respectively (Table SI2). This indicates that a larger 2D spatial extension of NPs results in a magnetic force field of a smaller magnitude and a shorter decay length. As can be seen in Fig. 5, where phase shift ratios are plotted for clusters with increasing connectivity, the Te/S4 and Pe/S4 phase shift ratios only approach values of 3.5 and 4.6, respectively, at the largest distances. Only the smaller compact clusters have the tendency to reach a phase shift ratio identical to the number of NPs. These findings again cannot be understood in the frame-work of the two-dipole model where the clusters are described by point-like magnetic dipole moments.
4
Numerical simulations
Calculations of the magnetostatic interactions between the mi-croscope tip and the NPs were modeled by using the config-urations found experimentally. A detailed description of the method can be found in Sec. SI6. The interaction between the magnetic tip and the sample has been simulated by plac-ing the tip apex above the center of mass of the studied clus-ters. In Fig. 6 (a), we show the computed magnetic forces as a function of distance for three isolated NPs of different diameters: D = 26 nm, 30 nm and 34 nm. As expected, the magnetic force increases with the size of the NPs while the to-tal magnetic moment scales with the volume. In Fig. 6 (b) are plotted the theoretical force gradient values (which are pro-portional to the experimental phase shift) with respect to the tip-sample distance. Comparison with the experimental re-sults presented in Fig. 2 reveals that the simulated force gradi-ents exhibit the same trend as in experimgradi-ents. Indeed, in both simulated and experimental cases, the force gradient increases for larger NPs. The difference between the force gradients however shrinks as the distance between the tip and the NP increases.
Due to the finite element modeling used here, the
numeri-50 100 150 200 Distance (nm) 0 5 10 15 20 25 30 Force ( p N ) D = 26 nm D = 30 nm D = 34 nm 20 40 60 80 Distance (nm) -0.4 -0.3 -0.2 -0.1 0 dF/dz ( p N / nm) 50 100 150 z (nm) 1 1.5 2 2.5 3 dF/dz (x) / dF/dz (26 nm) x = 30 nm x = 34 nm (a) (b)
Fig. 6(a) Variation of the magnetic force between the tip and three single NPs of different diameters (D = 26 nm, 30 nm and 34 nm) as a function of tip-NP distance. (b) Variation of the force gradient as a function of distance for the three different single NPs. Inset exhibits the variation of the gradient force ratio between the larger singles NPs (D = 30 and 34 nm) and the smallest single NP (D = 26 nm) as a function of distance by using our simulation method (full curve) and an equivalent two-dipole model (dashed curve).
cal analyses do not need to take into account a change in the tip magnetization or any modification in the localization of tip moment, as required in the two-dipole model. Deviations from the two-dipole model can be quantified by comparing the simulated force gradient ratio between two different NPs with respect to the two-dipole model. In the latter case, the force gradient ratio between two different NPs is constant as a function of distance, as shown for instance in the inset of Fig. 6 (b). The simulations indicate that the ratios depend on the tip-sample distance, progressively converging to the value given by the two-dipole model. The simulations are therefore expected to give details about why the fitting of experimental phase shifts with the two-dipole model required a change of both the tip magnetic moment and its location within the tip volume.
4.1 Influence of compactness
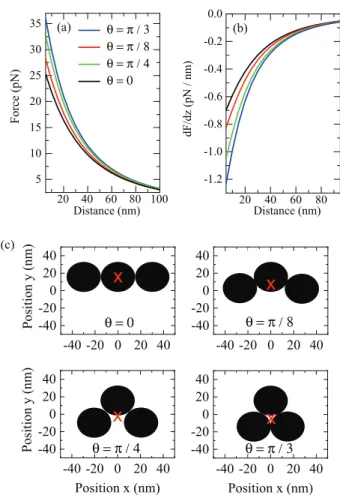
To study the influence of the in-plane compactness of the clus-ters on the generated magnetic field, we calculated the force gradients for four configurations where the in-plane arrange-ment of the NPs has been changed. Since the most relevant experimental results concerning the modification of the mag-netic force field have been obtained on 3-fold clusters, we chose to work with clusters formed by NPs of the same di-ameter (D = 30 nm). Their configurations are shown in Fig. 7. The 3-fold clusters can be differentiated by the parameterθ which represents the angle between the central NP and the two outer NPs [Fig. 7 (c)]. The first trimer has a linear-like chain configuration, which corresponds to an angle θ = 0. In the next two configurations, the outer NPs are symmetrically dis-placed with respect to the central NP, while keeping the NPs in the same plane, i.e. the one perpendicular to the tip axis. This
gives rise to triangular clusters labeled:θ=π/8 andθ=π/4, respectively. The latter cluster has a more compact structure with the three NPs forming an equilateral triangleθ =π/3.
From Fig. 7 (a), it can be seen that the magnetic force ex-erted on the tip gradually increases as the cluster changes from a linear to a triangular configuration. The differences between the four configurations are as expected more visible at small distances. The more compact the trimer, the stronger the mag-netic force. The magnitude of the magmag-netic force field there-fore depends on the geometrical configuration of the trimer. The slope of the force gradient vs. distance is also signifi-cantly reduced for low compactness [Fig. 7(b)]. The com-puted force gradients are consequently in very good agreement with the experimental phase shifts plotted in Fig. 4. Moreover, at large distances (≫ D), the force gradients converge to the same value because all four computed configurations have the same total magnetic moment. In the case of the most com-pact trimer (θ =π /3), the force gradient shows the greatest variation, as also found experimentally (Tr1 in Fig. 4).
The force gradients shown in Fig. 7 (b) are divided by the force gradient obtained for a single NP. The resulting curves are shown with solid lines in Fig. 8 (a). It is seen that the ratios display a smoother variation as the trimers adopt a less compact geometry. It is worth recalling that these ratios indi-cate how the magnetic fields generated by a cluster deviates from the fields generated by a single NP. As a matter of fact, the ratio cannot be larger than three for a trimer.
When the Tr/S ratio reaches the maximal value of three, it means that the magnetic force field is not any more dependent on the spatial arrangement in the trimer. In our numerical anal-yses, we found a maximum value of 2.8 at 95 nm in the case of the most compact trimer (θ=π /3). This maximum value decreases considerably at the same distance for less compact trimers. It means that, even at distances larger than 2-3 times the NPs diameter, the tip is still sensitive to the 2D spatial ar-rangement of the NPs in the trimer.
For the sake of comparison, we also calculated the force gradient ratios forθ = 0 andθ =π /3 trimers using the two-dipole model. The results are shown with dashed lines in Fig. 8(a). A full analysis performed with the two-dipole model is presented in Sec. SI7. At large distances > 2 D, the ratio for the compact trimer is greater than the ratio of linear trimer, which is qualitatively in agreement with both previous simula-tions and experiments. For small distances (< 2D), the ratios show a completely different variation as compared with the respective curves obtained with our finite element model and with the experiments. For instane, at distances of the order of D, the two dipole model predicts a ratio for the linear-like chain cluster higher than the one for the compact trimer, as-pect which is not observed in our finite-element modeling nor in the experiments. The ratio even becomes negative at very short distances (< D), meaning that the force between tip and clusters is attractive. This happens because the tip dipole mo-ment is so close to the dipole momo-ment of NPs that there is an
20 40 60 80 100 5 10 15 20 25 30 35 θ = π / 3 θ = π / 8 θ = π / 4 θ = 0 F o rc e (p N ) Distance (nm) 20 40 60 80 -1.2 -1.0 -0.8 -0.6 -0.4 -0.2 0.0 dF /dz (pN / nm ) Distance (nm) -40 -20 0 20 40 -40 -20 0 20 40 Position x (nm)
x
-40 -20 0 20 40 -40 -20 0 20 40x
-40 -20 0 20 40 -40 -20 0 20 40 P o si ti o n y (n m )x
-40 -20 0 20 40 -40 -20 0 20 40 P o si ti o n y (n m ) Position x (nm)x
θ = 0 θ = π / 8 θ = π / 4 θ = π / 3 (a) (b) (c)Fig. 7(a) Force and (b) force gradient between the tip and the four clusters depicted in (c). (c) Top view of four trimers of different compactness. The red crosses represent the lateral position of the tip.
angle where the sign of the magnetic force changes. This is not the case in our finite element modeling neither in the ex-periments, because of the finite size of the NPs and of the tip. Altogether, these results already show that two-dipole model cannot capture a reliable magnetostatic interaction at separa-tion distances < 2D.
The force gradients of several clusters ranging from two to five NPs divided by the force gradient of a single NP are shown in Fig. 8(b). These theoretical ratios can be compared with the experimental curves presented in Fig. 5. As seen, the numerical results support the experimental findings. Depend-ing on the number of NPs composDepend-ing the clusters, the ratios progressively increase as the distance increases, approaching a saturation value. Above approximately 70 nm, the ratios are almost 2 and 3 for dimers and trimers, respectively. Instead, at the same 70 nm separation distance, the ratios for tetramer and pentamer are only 3.6 and 4.5, saturating at 3.9 and 4.8 only for very large distances. This is due to the fact that the tip senses differently the magnetic force fields depending on the 2D organization of the NPs in the cluster, as also observed experimentally.
0 20 40 60 80 100 Distance (nm) 0 0.5 1 1.5 2 2.5 3
dF/dz (Trimer / Single ratio)
θ = 0 θ = π/8 θ = π/4 θ = π/3 θ = 0 θ = π/3 50 100 150 Distance (nm) 1 2 3 4 5
dF/dz / dF/dz (D = 30 nm) Dimer / SingleTrimer / Single
Tetramer / Single Pentamer / Single
(a) (b)
Fig. 8(a) Force gradients for the four trimers divided by the force gradient of a single NP (30 nm in diameter). For comparison, the re-sults forθ = 0 and θ = π /3 as computed with the two-dipole model are shown with dashed lines. (b) Force gradients for clusters com-posed from two to five NPs divided by the force gradient of a NP.
5
Summary and conclusions
We presented a combined experimental and theoretical study on a quantitative evaluation of the magnetic force fields gen-erated by clusters of NPs formed by associations of single magnetic NPs on a solid non-magnetic substrate. The exper-imental results obtained under a saturation magnetic field of 0.5 T have shown that the magnetic force fields do not in-crease proportionally with the number of NPs in the clusters. Furthermore, for dimeric and trimeric clusters, minute modi-fications of the 2D spatial arrangement of NPs in the clusters drastically modify the surrounding magnetic field. For these clusters, the magnitude of the generated force field follows the prediction of the two-dipole model, but only at distances exceeding some critical values (about twice the diameter of a NP). For tetramers and pentamers the two-dipole model is found to overestimate the value of the magnetic moments in the whole range of the experimental distances. The largest the in-plane lateral expansion of the cluster the less accurate is the two-dipole model in extracting quantitative information. This is because the principal condition for the use of a two-dipole model is related to the lateral extension the clusters which should be smaller than the distance at which the mag-netic force field is evaluated.
A good agreement with the experimental results, in the en-tire range of tip-sample distance, was obtained by considering the real geometry of the system, namely by splitting both tip and sample in a finite number of microscopic elements and performing a full pairwise integration of magnetostatic poten-tials. The numerical calculations conducted with this finite-element model brought unprecedented insights into the quanti-tative evaluation of the magnetic field generated by assemblies of NPs, and put forward the importance of the spatial organi-zation. The magnetic force field in the proximity of clusters has a complex distance-dependent structure, being driven sig-nificantly by the exact number of NPs. Compact clusters have
a general tendency to generate an enhanced force field able to extend at larger distances, which is the result of interparticle magnetic interactions and cooperative effects. Our results may have an impact on the chemical design of NPs-based clusters for various applications, including biomedical and therapeutic strategies or magnetic information technologies.
6
Acknowledgments
We thank N. Beyer for technical assistance, O. Ersen for TEM measurements, S. Colis for magnetic hysteresis mea-surements, and R. Dudric for XRD data. This work is sup-ported by ANR METABIP (12 BS10 003 01), ANR OH-RISQUE SMARAGD (14 OHRI 0008 01), EOARD (FA8655-13-1-3001) and partially by ANR-11-LABX-0058-NIE within the Investissement d’Avenir program ANR-10-IDEX-0002-02. C. Iacovita acknowledges financial support from Ro-manian National Authority for Scientific Research, CNCSIS-UEFISCDI, through researcher mobility project No. PN-III-P1-1.1-MC-2017-0981 and research project to stimulate young independent teams No. PN-III-P1-1.1-TE-2016-0967. We thank CNRS & University of Strasbourg for support.
References
1 S. Laurent, D. Forge, M. Port, A. Roch, C. Robic, L. Vander Elst and R. N. Muller, Chemical Reviews, 2008, 108, 2064-2110.
2 J. Gao, H. Gu and B. Xu, Accounts of Chemical Re-search, 2009, 42, 1097-1107.
3 N. Lee, H. R. Cho, M. H. Oh, S. H. Lee, K. Kim, B. H. Kim, K. Shin, T.-Y. Ahn, J. W. Choi, Y.-W. Kim, S. H. Choi and T. Hyeon, Journal of the American Chemical Society, 2012, 134, 10309-10312.
4 M. Colombo, S. Carregal-Romero, M. F. Casula, L. Guti´errez, M. P. Morales, I. B. B¨ohm, J. T. Heverha-gen, D. Prosperi and W. J. Parak, Chemical Society Reviews, 2012, 41, 4306.
5 A.-H. Lu, E. L. Salabas and F. Sch¨uth, Angewandte Chemie International Edition, 2007, 46, 1222-1244. 6 J. H. Kang, E. Um, A. Diaz, H. Driscoll, M. J. Rodas,
K. Domansky, A. L. Watters, M. Super, H. A. Stone and D. E. Ingber, Small, 2015, 11, 5657-5666. 7 M. Mahmoudi, S. Sant, B. Wang, S. Laurent and T.
Sen, Advanced Drug Delivery Reviews, 2011, 63, 24-46.
8 W. Wu, Z. Wu, T. Yu, C. Jiang and W.-S. Kim, Sci-ence and Technology of Advanced Materials, 2015, 16, 023501.
9 D. Ling and T. Hyeon, Small, 2013, 9, 1450-1466. 10 A. Demortire, P. Panissod, B. P. Pichon, G.
Pour-roy, D. Guillon, B. Donnio and S. B´egin-Colin, Nanoscale, 2011, 3, 225-232.
11 S. Noh, W. Na, J. Jang, J.-H. Lee, E. J. Lee, S. H. Moon, Y. Lim, J.-S. Shin and J. Cheon, Nano Letters, 2012, 12, 3716-3721.
12 U. O. H¨afeli, J. S. Riffle, L. Harris-Shekhawat, A. Carmichael-Baranauskas, F. Mark, J. P. Dailey and D. Bardenstein, Molecular Pharmaceutics, 2009, 6, 1417-1428.
13 G. Liu, J. Gao, H. Ai and X. Chen, Small, 2013, 9, 1533-1545.
14 H. Bin Na, I. C. Song and T. Hyeon, Advanced Mate-rials, 2009, 21, 2133-2148.
15 Z. R. Stephen, F. M. Kievit and M. Zhang, Materials Today, 2011, 14, 330-338.
16 N. Lee and T. Hyeon, Chem. Soc. Rev., 2012, 41, 2575-2589.
17 Y. Jun, J. Lee and J. Cheon, Angewandte Chemie In-ternational Edition, 2008, 47, 5122-5135.
18 L. Lartigue, C. Innocenti, T. Kalaivani, A. Awwad, M. del M. Sanchez Duque, Y. Guari, J. Larionova, C. Guerin, J.-L. G. Montero, V. Barragan-Montero, P. Arosio, A. Lascialfari, D. Gatteschi and C. Sangrego-rio, Journal of the American Chemical Society, 2011, 133, 10459-10472.
19 L. C. Branquinho, M. S. Carriao, A. S. Costa, N. Zufelato, M. H. Sousa, R. Miotto, R. Ivkov, and A. F. Bakuzis, Sci. Rep., 2013, 3, 2887.
20 C. Martinez-Boubeta, K. Simeonidis, A. Makridis, M. Angelakeris, O. Iglesias, P. Guardia, A. Cabot, L. Yedra, S. Estrad´e, F. Peiro, Z. Saghi, P. A. Midgley, I. Conde-Lebor´an, D. Serantes and D. Baldomir, Sci. Rep., 2013, 3, 1652.
21 C. Blanco-Andujar, A. Walter, G. Cotin, C. Bor-deianu, D. Mertz, D. Felder-Flesch and S. Begin-Colin, Nanomedicine, 2016, 11, 1889-1910.
22 O. Veiseh, J. W. Gunn and M. Zhang, Advanced Drug Delivery Reviews, 2010, 62, 284-304.
23 M. Das, D. Mishra, P. Dhak, S. Gupta, T. K. Maiti, A. Basak and P. Pramanik, Small, 2009, 5, 2883-2893. 24 E. Bellido, N. Domingo, I. Ojea-Jim´enez and D.
Ruiz-Molina, Small, 2012, 8, 1465-1491.
25 A. Shavel, B. Rodriguez-Gonz´alez, M. Spasova, M. Farle and L. Liz-Marz´an, Advanced Functional Ma-terials, 2007, 17, 3870-3876.
26 L. Balcells, I. Stankovic, Z. Konstantinovic, A. Alagh, V. Fuentes, L. L´opez-Mir, J. Or´o, N. Mestres, C. Garcia, A. Pomar, and B. Martinez, Nanoscale, 2019, 11, 1419414202.
27 J. M. Perez, L. Josephson, T. O’Loughlin, D. H¨ogemann and R. Weissleder, Nature Biotechnology, 2002, 20, 816-820.
28 C. Min, H. Shao, M. Liong, T.-J. Yoon, R. Weissleder and H. Lee, ACS Nano, 2012, 6, 6821-6828.
29 J. Conde, J. T. Dias, V. Graz˜ao, M. Moros, P. V.
Bap-tista and J. M. de la Fuente, Frontiers in Chemistry, 2014, 2, 48.
30 L. Guti´errez, L. de la Cueva, M. Moros, E. Mazaro, S. de Bernardo, J. M. de la Fuente, M. P. Morales and G. Salas, Nanotechnology, 2019, 30, 112001. 31 K. Wu, K. Schliep, X. Zhang, J. Liu, B. Ma and J.-P.
Wang, Small, 2017, 13, 1604135.
32 P. Gillis and S. H. Koenig, Magnetic resonance in medicine, 1987, 5, 323-45.
33 L. Josephson, J. M. Perez and R. Weissleder, Ange-wandte Chemie International Edition, 2001, 40, 3204-3206.
34 R. A. Brooks, Magnetic Resonance in Medicine, 2002, 47, 388-391.
35 H. Shao, T.-J. Yoon, M. Liong, R. Weissleder and H. Lee, Beilstein Journal of Nanotechnology, 2010, 1, 142-154.
36 H. Gavil´an, A. Kowalski, D. Heinke, A. Sugunan, J. Sommertune, M. Var´on, L. K. Bogart, O. Posth, L. Zeng, D. Gonz´alez-Alonso, C. Balceris, J. Fock, E. Wetterskog, C. Frandsen, N. Gehrke, C. Gr¨uttner, A. Fornara, F. Ludwig, S. Veintemillas-Verdaguer, C. Jo-hansson, and M. P. Morales, Part. Part. Syst. Charact., 2017, 34, 1700094.
37 P. Bender, J. Fock, C. Frandsen, M. F. Hansen, C. Balceris, F. Ludwig, O. Posth, E. Wetterskog, L. K. Bogart, P. Southern, W. Szczerba, L. Zeng, K. Witte, C. Gr¨uttner, F. Westphal, D. Honecker, D. Gonz´alez-Alonso, L. F. Barquin, and C. Johansson, J. Phys. Chem. C, 2018 122, 3068.
38 S. Ota, Y. Matsugi, T. Nakamura, R. Takeda, Y. Take-mura, I. Kato, S. Nohara, T. Sasayama, T. Yoshida, and K. Enpuku, J. Magn. Magn. Mater., 2019, 474, 311.
39 P. Gr¨utter, H. J. Mamin and D. Rugar, Springer, Berlin, Heidelberg, 1992, pp. 151-207.
40 R. E. Dunin-Borkowski, T. Kasama, A. Wei, S. L. Tripp, M. J. Htch, E. Snoeck, R. J. Harrison and A. Putnis, Microscopy Research and Technique, 2004, 64, 390-402.
41 I. Passeri, D.; Angeloni, L.; Reggente, M.; Rossi, M., Magnetic Force Microscopy, Magnetic Characteriza-tion Techniques for Nanomaterials, Springer Berlin Heidelberg, Berlin, Heidelberg, 2017.
42 P. Ares, M. Jaafar, A. Gil, J. G´omez-Herrero and A. Asenjo, Small, 2015, 11, 4731-4736.
43 C. Dietz, E. T. Herruzo, J. R. Lozano and R. Garcia, Nanotechnology, 2011, 22, 125708.
44 A. Krivcov, J. Schneider, T. Junkers and H. M¨obius, physica status solidi (a), 2018, 216, 1800753. 45 M. V. Rastei, R. Meckenstock, J. P. Bucher, E.
De-vaux and T. Ebbesen, Applied Physics Letters, 2004, 85, 2050-2052.
46 M. V. Rastei, R. Meckenstock and J. P. Bucher, Ap-plied Physics Letters, 2005, 87, 222505.
47 M. V. Rastei, M. Abes, J. P. Bucher, A. Dinia and V. Pierron-Bohnes, Journal of Applied Physics, 2006, 99, 084316.
48 H. J. Hug, B. Stiefel, P. J. A. van Schendel, A. Moser, R. Hofer, S. Martin, H.-J. G¨untherodt, S. Porthun, L. Abelmann, J. C. Lodder, G. Bochi and R. C. O’Handley, Journal of Applied Physics, 1998, 83, 5609-5620.
49 P. J. A. van Schendel, H. J. Hug, B. Stiefel, S. Mar-tin and H.-J. G¨untherodt, Journal of Applied Physics, 2000, 88, 435-445.
50 T. H¨aberle, F. Haering, H. Pfeifer, L. Han, B. Kuer-banjiang, U. Wiedwald, U. Herr and B. Koslowski, New Journal of Physics, 2012, 14, 043044.
51 S. Schreiber, M. Savla, D. V. Pelekhov, D. F. Iscru, C. Selcu, P. C. Hammel and G. Agarwal, Small, 2008, 4, 270-278.
52 U. Hartmann, Physics Letters A, 1989, 137, 475-478. 53 R. B. Proksch, T. E. Sch¨affer, B. M. Moskowitz, E. D. Dahlberg, D. A. Bazylinski and R. B. Frankel, Ap-plied Physics Letters, 1995, 66, 2582-2584.
54 M. Abes, M. V. Rastei, J. Venuat, A. Carvalho, S. Boukari, E. Beaurepaire, P. Panissod, A. Dinia, J. P. Bucher and V. Pierron-Bohnes, Journal of Applied Physics, 2009, 105, 113916.
55 D. Passeri, C. Dong, M. Reggente, L. Angeloni, M. Barteri, F. A. Scaramuzzo, F. De Angelis, F. Marinelli, F. Antonelli, F. Rinaldi, C. Marianecci, M. Carafa, A. Sorbo, D. Sordi, I. W. Arends and M. Rossi, Biomatter, 2014, 4, e29507.
56 J. Lohau, S. Kirsch, A. Carl, G. Dumpich and E. F. Wassermann, Journal of Applied Physics, 1999, 86, 3410-3417.
57 T. Kebe and A. Carl, Journal of Applied Physics, 2004, 95, 775-792.
58 S. Sievers, K.-F. Braun, D. Eberbeck, S. Gustafsson, E. Olsson, H. W. Schumacher and U. Siegner, Small (Weinheim an der Bergstrasse, Germany), 2012, 8, 2675-9.
59 L. Angeloni, D. Passeri, S. Corsetti, D. Peddis, D. Mantovani and M. Rossi, Nanoscale, 2017, 9, 18000-18011.
60 M. Jaafar, O. Iglesias-Freire, L. Serrano-Ramon, M. Ricardo Ibarra, J. Maria de Teresa, and A. Asenjo, Beilstein J. Nanotechnol. 2011, 2, 552560.
61 L. Angeloni, D. Passeri, F. A. Scaramuzzo, D. Di Iorio, M. Barteri, D. Mantovani, and M. Rossi, AIP Conf. Proc. 2016, 1749, 020006.
62 L. Angeloni, D. Passeri, M. Reggente, D. Mantovani, and M. Rossi, Sci. Rep. 2016, 6, 26293.
63 C. Moya, ´O. Iglesias-Freire, X. Batlle, A. Labarta and
A. Asenjo, Nanoscale, 2015, 7, 17764-17770. 64 L. Wu, A. Mendoza-Garcia, Q. Li and S. Sun,
Chem-ical Reviews, 2016, 116, 10473-10512.
65 L. Malassis, D. Jishkariani, C. B. Murray and B. Don-nio, Nanoscale, 2016, 8, 13192-13198.