HAL Id: hal-02511532
https://hal.inria.fr/hal-02511532
Submitted on 18 Mar 2020HAL is a multi-disciplinary open access archive for the deposit and dissemination of sci-entific research documents, whether they are pub-lished or not. The documents may come from teaching and research institutions in France or abroad, or from public or private research centers.
L’archive ouverte pluridisciplinaire HAL, est destinée au dépôt et à la diffusion de documents scientifiques de niveau recherche, publiés ou non, émanant des établissements d’enseignement et de recherche français ou étrangers, des laboratoires publics ou privés.
Accuracy of MRI Classification Algorithms in a Tertiary
Memory Center Clinical Routine Cohort
Alexandre Morin, Jorge Samper-González, Anne Bertrand, Sebastian Ströer,
Didier Dormont, Aline Mendes, Pierrick Coupé, Jamila Ahdidan, Marcel
Lévy, Dalila Samri, et al.
To cite this version:
Alexandre Morin, Jorge Samper-González, Anne Bertrand, Sebastian Ströer, Didier Dormont, et al.. Accuracy of MRI Classification Algorithms in a Tertiary Memory Center Clinical Routine Cohort. Journal of Alzheimer’s Disease, IOS Press, 2020, pp.1-10. �10.3233/JAD-190594�. �hal-02511532�
ACCURACY OF MRI CLASSIFICATION ALGORITHMS IN A TERTIARY
MEMORY CENTER CLINICAL ROUTINE COHORT
Alexandre Morin, MD 1, 2, 3,*, Jorge Samper-Gonzalez 2, 3, Anne Bertrand, MD, PhD 2, 3, 4, §, Sébastian Ströer, MD 2, 4,, Didier
Dormont, MD, PhD 2, 3, 4, Aline Mendes, MD 5, Pierrick Coupé, PhD 6, Jamila Ahdidan, PhD 7, Marcel Lévy, MD 5, Dalila Samri
5, Harald Hampel, MD, PhD 5, 8, 9, Bruno Dubois, MD 5, 9, Marc Teichmann, MD, PhD 5, 9, Stéphane Epelbaum, MD, PhD 2, 3, 5 and
Olivier Colliot, PhD 2, 3, 4, 5 *
1 AP-HP, Hôpital de la Pitié-Salpêtrière, Department of Neurology, Unité de Neuro-Psychiatrie Comportementale (UNPC),
F-75013, Paris, France.
2 Sorbonne Universités, UPMC Univ Paris 06, Inserm, CNRS, ICM, F-75013 Paris, France
3 Inria, Aramis-project team, Paris, France
4 AP-HP, Hôpital de la Pitié-Salpêtrière, Department of Neuroradiology, F-75013, Paris, France
5 AP-HP, Hôpital de la Pitié-Salpêtrière, Department of Neurology, Institut de la Mémoire et de la Maladie d’Alzheimer (IM2A),
F-75013, Paris, France
6 Laboratoire Bordelais de Recherche en Informatique, Unit Mixte de Recherche CNRS (UMR 5800), PICTURA Research
Group, Bordeaux, France
7 Brainreader, Horsens, Denmark
8 AXA Research Fund & UPMC Chair, Paris, France; Sorbonne Universities, Pierre et Marie Curie University, Paris 06,
9 ICM, ICM-INSERM 1127, FrontLab.
§ Deceased, March 2nd, 2018
*Correspondence to:
Olivier Colliot - [email protected] ICM – Brain and Spinal Cord Institute ARAMIS team
Pitié-Salpêtrière Hospital
47-83, boulevard de l’Hôpital, 75651 Paris Cedex 13, France Phone : 01 57 27 43 65
Statistical Analysis conducted by Dr. Alexandre Morin, MD, UPMC, AramisLab and Jorge Samper, AramisLab
Keywords: Assessment of cognitive disorders/Dementia; Alzheimer's disease; All Cognitive Disorders/Dementia; MRI; Volumetric MRI;
Abstract
Background: Automated volumetry software (AVS) has recently become widely available to
neuroradiologists. MRI volumetry with AVS may support the diagnosis of dementias by identifying regional atrophy. Moreover, automatic classifiers using machine learning techniques have recently emerged as promising approaches to assist diagnosis. However, the performance of both AVS and automatic classifiers has been evaluated mostly in the artificial setting of research datasets.
Objective: Our aim was to evaluate the performance of 2 AVS and an automatic classifier in the clinical
routine condition of a memory clinic.
Methods: We studied 239 patients with cognitive troubles from a single memory center cohort. Using
clinical routine T1-weighted MRI, we evaluated the classification performance of: i) univariate volumetry using two AVS (volBrain and Neuroreader™); ii) Support Vector Machine (SVM) automatic classifier, using either the AVS volumes (SVM-AVS), or whole gray matter (SVM-WGM); iii) reading by two neuroradiologists. The performance measure was the balanced diagnostic accuracy. The reference standard was consensus diagnosis by three neurologists using clinical, biological (cerebrospinal fluid) and imaging data and following international criteria.
Results: Univariate AVS volumetry provided only moderate accuracies (46% to 71% with hippocampal
volume). The accuracy improved when using SVM-AVS classifier (52% to 85%), becoming close to that of WGM (52 to 90%). Visual classification by neuroradiologists ranged between AVS and SVM-WGM.
Conclusion: In the routine practice of a memory clinic, the use of volumetric measures provided by AVS
yields only moderate accuracy. Automatic classifiers can improve accuracy and could be a useful tool to assist diagnosis.
Acknowledgements
O.C. is supported by a “Contrat d’Interface Local” from Assistance Publique-Hôpitaux de Paris (AP-HP). HH is supported by the AXA Research Fund, the Fondation Université Pierre et Marie Curie and the Fondation pour la Recherche sur Alzheimer, Paris, France.
Source of funding
The research leading to these results has received funding from the French government under management of Agence Nationale de la Recherche as part of the "Investissements d'avenir" program, reference ANR-19-P3IA-0001 (PRAIRIE 3IA Institute), reference ANR-10-IAIHU-06 (Agence Nationale de la Recherche-10-IA Institut Hospitalo-Universitaire-6), and reference ANR-11-IDEX-004 (Agence Nationale de la Recherche-11- Initiative d’Excellence-004, project LearnPETMR number SU-16-R-EMR-16),
from the European Union H2020 program (project EuroPOND, grant number 666992), from the joint NSF/NIH/ANR program “Collaborative Research in Computational Neuroscience” (project HIPLAY7, grant number ANR-16-NEUC-0001-01), from Agence Nationale de la Recherche (project PREVDEMALS, grant number ANR-14-CE15-0016-07), from the ICM Big Brain Theory Program (project DYNAMO), from the Abeona Foundation (project Brain@Scale) and from the “Contrat d’Interface Local” program (to Dr Colliot) from Assistance Publique-Hôpitaux de Paris (AP-HP).
Role of the funding source
The sponsors of the study had no role in study design, data analysis or interpretation, writing or decision to submit the report for publication.
Introduction
Background:
The diagnostic criteria of Alzheimer’s disease (AD) and other dementias have evolved in the past decades from a clinical descriptive perspective to biomarker-supported definitions, mainly due to innovation in brain imaging, and biological fluid markers [1]. Among neuroimaging biomarkers, MRI is the less invasive, most widely available, cost-effective, is systematically recommended in dementia and can provide supportive criteria for many neurodegenerative conditions [2–4]. MRI can identify areas of atrophy that can suggest particular types of dementia, such as atrophy of the medial temporal structures in late-onset AD [5,6] or anterior atrophy in frontotemporal dementia [7]. Assessment of regional atrophy using MRI in dementia has been extensively studied using visual, semi-quantitative ratings [5–7], manual volumetry, and more recently Automated Volumetry Software (AVS)[8–11].
AVS such as Neuroreader™ [10], and volBrain [12] provide volumetric measures of anatomical structures. Unlike subjective visual analysis of atrophy, AVS provide objective, quantitative measurement of various regions of interest (ROI) volumes. These tools, which are progressively being implemented in clinical MRI software have only been evaluated in research settings [10,11,13,14]. Besides, due to their univariate nature, they cannot detect complex multivariate combinations of regional atrophies, essential to discriminate between different dementias.
Automatic classifiers, based on machine learning techniques, are able to automatically learn complex multivariate discriminative patterns without priors on specific anatomical structures. Automatic classifiers have also mainly been evaluated in research settings, with standardized MRI acquisition and focusing on a single type of dementia (most often Alzheimer’s disease) and age-matched healthy controls [15–19].
Objective: In this study, we evaluated the diagnostic classification performance of AVS volumetry
(volBrain and Neuroreader™), automatic classifiers (based on whole gray matter or on AVS volumes), in a clinical routine cohort of patients presenting with various neurodegenerative dementia disorders, depression or subjective cognitive decline.
Material and Methods
Participants
All subjects were recruited retrospectively in a tertiary academic expert memory center (Institute for Memory and Alzheimer’s disease – Department of Neurology, Pitié-Salpêtrière University Hospital) from the ClinAD cohort [20]. The ClinAD cohort consists of 992 consecutive patients who consulted from 2005 to 2014 for cognitive impairment and who underwent lumbar puncture. Data collection was planned before the index test and reference standard were performed. All patients had neurological, biological and neuropsychological evaluations. Cerebrospinal fluid (CSF) Ab1-42, tau and phosphorylated tau was available
for all participants. All clinical and biological data were generated during a routine clinical workup and were retrospectively extracted for the purpose of this study. Therefore, according to French legislation, explicit consent was waived. However, regulations concerning electronic filing were followed, and patients and their relatives were informed that anonymised data might be used in research investigations.
For each patient, the diagnosis was assessed by a group of 3 neurologists based on clinical, biological and imaging data, following international consensus criteria for AD (IWG-2) [21], fronto-temporal dementia (FTD) [2], primary progressive aphasia (PPA) of the logopenic (lv-PPA), semantic (SD) or non-fluent/agrammatic (nf-PPA) [22] variant, cortico-basal syndrome (CBD) [4], progressive supranuclear palsy (PSP) [23], posterior cortical atrophy (PCA) [24], Lewy body dementia (LBD) [25], and depression [26]. This consensus diagnosis formed the reference standard. The classifier and volumetry (index tests) results were not available to assessors of the reference standard. As clinical presentations and atrophy patterns depend mostly on the age of onset of AD [27], the AD group was separated into Early-onset AD (EOAD) and Late-Onset-AD (LOAD), with age of onset respectively before and after 65 years. In addition, 342 out of 992 patients were excluded because they presented with mixed pathology, vascular disease (Fazekas score > 2 or significant stroke) or unclear diagnosis. From the 650 patients of the ClinAD cohort, 380 patients were excluded because the MRI was performed outside our center and was not available for our study, resulting in 270 patients. We added 12 subjective cognitive decline (SCD) patients, defined as patients with cognitive complaint but with normal neuropsychological examination.
Among the 282 patients, 7 were excluded due to poor image quality or failure of image processing pipelines. Specifically, 6 had a very low MRI quality on visual analysis (missing slices or strong motion artifacts) and the image processing pipelines failed in one participant. The quality of the remaining MRI data was variable, reflecting the reality of clinical routine, but proved sufficient for reliable image processing. The quality of image segmentation results was visually assessed. Moreover, we excluded diagnostic groups with less than 15 patients (nf-PPA, PSP, PCA) as automatic classifiers cannot be trained robustly on very small groups of subjects. As a result, the analyses were performed on 239 patients belonging to the following eight diagnostic groups: cortico-basal syndrome, early-onset AD, late-onset AD, fronto-temporal dementia of the behavioral type, Lewy body dementia, logopenic variant of primary progressive aphasia, semantic variant of primary progressive aphasia, and depression. The flow chart is described on Supplementary table 1. In this cohort, the only group without degenerative condition was that of patients with depression. We aim to compare the results obtained for depression to that obtained for subjective cognitive decline (SCD). To that purpose, we added 12 patients with SCD, defined as patients with cognitive complaint but with normal neuropsychological examination. For this group, classifiers were trained using the depression group and applied to the SCD group, because the training of the classifier on 12 participants would not be robust enough.
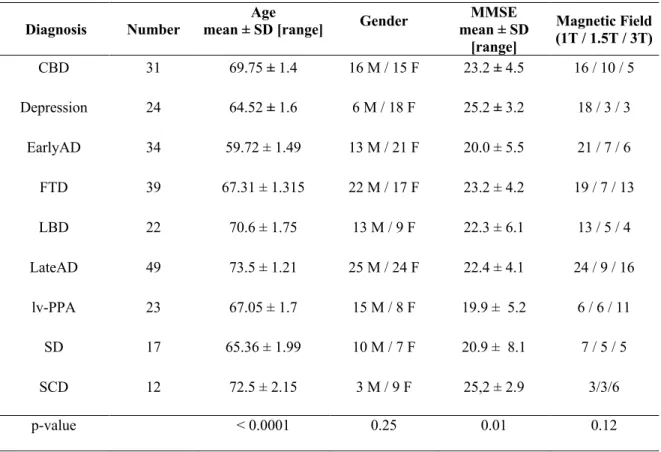
Demographic data are summarized in Table 1. Difference between groups on demographic and clinical data was evaluated with ANOVA for continuous data and Χ2 test for binary data using XLStat
Software (Addinsoft, www.xlstat.com). As expected, since we separated the AD group in LOAD and EOAD, age at diagnosis was significantly different between groups (in ANOVA and Post-Hoc Test). The MMSE score was also different since the neurodegenerative conditions do not have the same cognitive profile. For example, language impairment in PPA usually leads to lower MMSE scores than frontal dysfunction in FTD. There was no difference between groups regarding gender and MRI magnetic field.
MRI Acquisition
All 239 patients had an available brain MRI performed in the Department of Neuroradiology at Pitié-Salpêtrière Hospital: 63 on a 3T MRI GE Sigma HD, 9 on a 1.5 T MRI GE Optima 450, 44 on a 1.5T MRI
GE Signa Excite and 123 on a 1T MRI Philips Panorama. All MRI included a 3D T1-weighted sequence with a spatial resolution ranging from 0.5x0.5x1.2mm3 to 1x1x1.2mm3. Since imaging was performed as part of clinical routine, MRI acquisition parameters were not homogenized. Sequence parameters are available in Supplementary Table 2. The 12 SMC patients had an MRI performed in our center: 8 on a 3T MRI GE Signa HD, 1 on a 1.5 T MRI GE Optima 450, and 3 on a 1T MRI Philips Panorama.
Fully Automated Volumetry Software
The Neuroreader™ software (http://www.brainreader.net) is a commercial clinical brain image analysis tool [10]. The system provides the volumes of the following structures: intracranial cavity, tissue categories (WM, GM, and CSF), subcortical GM structures (putamen, caudate, pallidum, thalamus, hippocampus, amygdala and accumbens) and lobes (occipital, parietal, frontal and temporal). Processing times range from 3 to 7 minutes as a function of image size, irrespective of magnetic field strength.
The volBrain software (http://volBrain.upv.es) is an online freely-available academic brain image analysis tool [12]. The volBrain system takes around 15 minutes to perform the full analysis and provides the same volumes as Neuroreader™ except for the lobar volumes, only provided by Neuroreader™. However, the volBrain system provides hemisphere, brainstem and cerebellum segmentations which were not used in this study.
Automatic classification using SVM
Pre-Processing: extraction of Whole Grey Matter maps
All T1-weighted MRI images were segmented into Gray Matter (GM), White Matter (WM) and CSF tissues maps using the Statistical Parametric Mapping unified segmentation routine with the default parameters (SPM12, London, UK http://www.fil.ion.ucl.ac.uk/spm/) [28]. A population template was calculated from GM and WM tissue maps using the DARTEL diffeomorphic registration algorithm with the default parameters [29]. The obtained transformations and a spatial normalization were applied to the GM tissue maps. All maps were modulated to ensure that the overall tissue amount remains constant and normalized to
MNI space. 12mm smoothing was applied as the classification performed better with this parameter than with none or less smoothed images.
SVM classification
Whole Gray Matter (WGM) maps were then used as input of a high-dimensional classifier, based on a linear support vector machine (SVM) classifier. In brief, the linear SVM looks for a hyperplane which best separates two given groups of patients, in a very high dimensional space composed of all voxel values. In such approach, the machine learning algorithm automatically learns the spatial pattern (set of voxels and their weights) allowing to discriminate between diagnostic group. Importantly, the classifier does not use prior information such as anatomical boundaries between structures or that a specific anatomical structure (e.g. hippocampus) would be affected in a given condition. Please refer to Cuingnet et al. [15] for more details.
SVM classification was performed for each possible pair of diagnostic groups (e.g. EOAD vs. FTD, LOAD vs. FTD…). The performance measure was the balanced diagnostic accuracy defined as: (sensitivity – specificity)/2. Unlike standard accuracy, balanced accuracy allows to objectively compare the performance of different classification tasks even in the presence of unbalanced groups [15].
In order to compute unbiased estimates of classification performances, we used a 10-fold cross validation, meaning that each 10% of the set is used for testing and the other 90% for training, changing the groups in each out of the ten trials. This ensures that the patient that is currently being classified has not been used to train the classifier, a problem known as “double-dipping”. Finally, the SVM classifier has one hyper-parameter to optimize. The optimization was done using a grid-search. Again, in order to have a fully unbiased evaluation, the hyper-parameter tuning was done using a second, nested, 10-fold cross-validation procedure.
Finally, in order to have a fair comparison between WGM maps and AVS volumes, we also performed SVM classification using volumes of each AVS as input, all regional volumes (for a given AVS) being simultaneously used in a multivariate manner.
Radiological classification
Two neuroradiologists (AB, with 8 years of experience, and SS, with 4 years of experience), specialized in the evaluation of dementia, performed a visual classification of three diagnosis pairs on the same dataset: FTD vs EOAD, depression vs LOAD and LBD vs LOAD. We chose FTD vs EOAD and depression vs LOAD for their relevance in clinical practice. We chose LBD vs LOAD because the SVM classifier yielded only moderate accuracies, and because the diagnosis of LBD based on MRI is difficult. The neuroradiologists were blind to all patient data except MRI.
Results
Automated Volumetry Software: volBrain and Neuroreader™
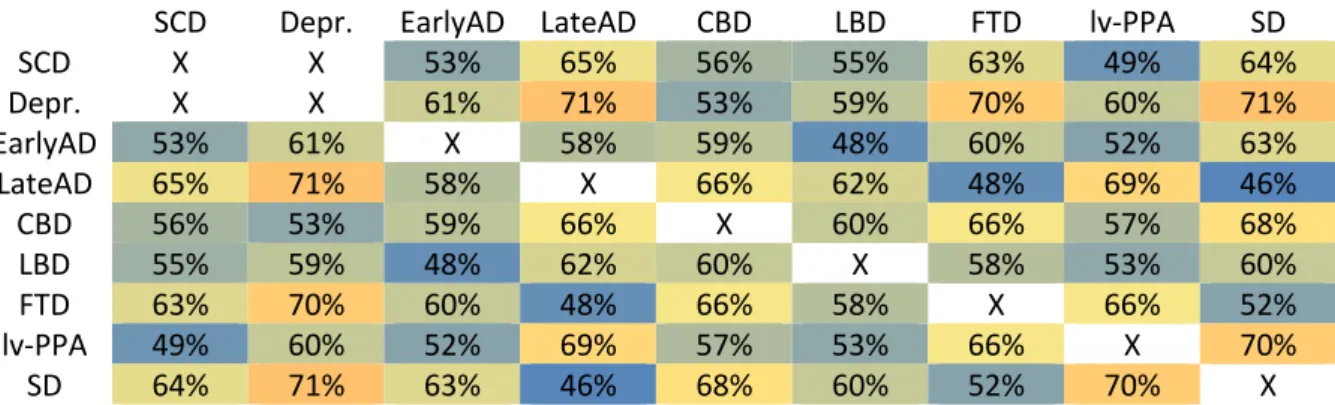
We performed a univariate classification based on each AVS volume separately. Volumes were normalized to the measured Total Intracranial volume (mTIV) (using the formula: Volume/mTIV), as discrimination was slightly better than with absolute values. VolBrain and Neuroreader™ performed similarly on univariate classification with balanced accuracy rates ranging from 46% to 71% based on hippocampal volumes. We show various volumes obtained in Neuroreader™ in Supplementary Table 3. We show results of classification based on hippocampal volume computed with Neuroreader™ in Table 2. In Supplementary Table 4 to 9, we provide classification balanced accuracy based on volumes of other anatomical structures, known to be of particular interest in various neurodegenerative conditions.
Automatic SVM classifier from Whole Gray Matter maps
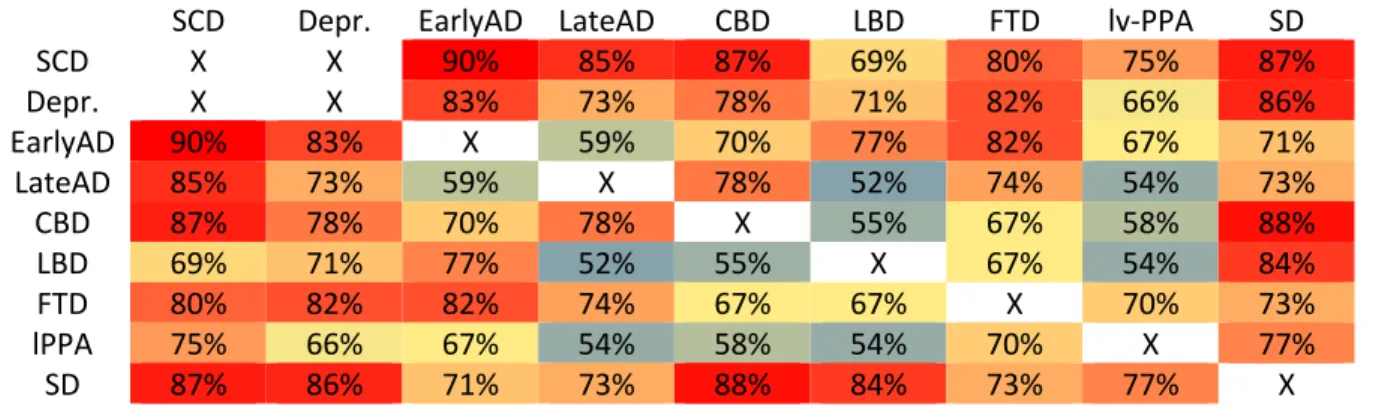
Table 3 provides the results of automatic SVM classification from WGM segmentation maps. Balanced accuracies ranged from 52% (LBD vs LOAD) to 90% (EarlyAD vs SCD). We present in Supplementary Figure 1 two examples of weight maps, which are graphic representations of the most relevant voxels for classification.
Automatic SVM classification from AVS volumes
To fully compare AVS with our SVM-WGM classification, we provide, in Supplementary Table 10, results of SVM classification from all volumes obtained with volBrain and Neuroreader™ in addition to SVM based on WGM. In general, results were slightly lower than with SVM classification from WGM. Overall, volBrain and Neuroreader™ performed similarly, even though one or the other tool achieved slightly higher performances in some specific cases.
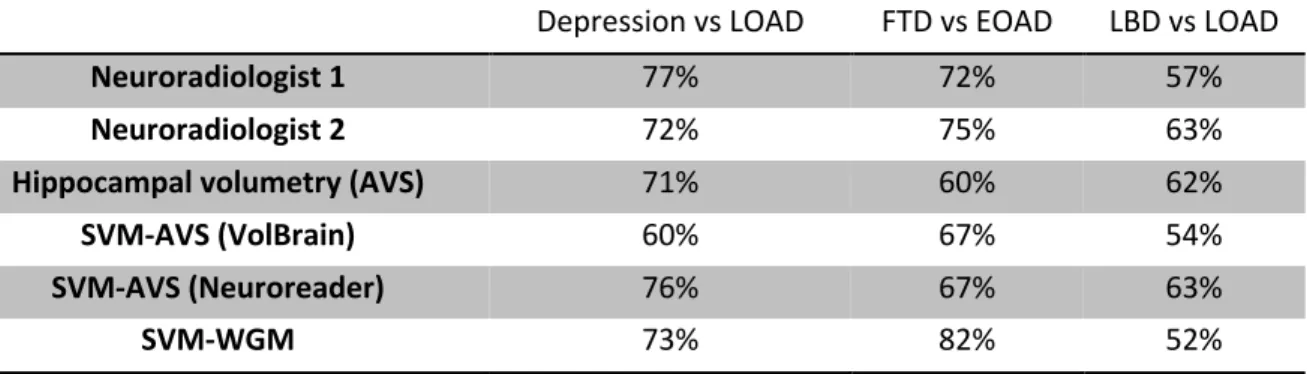
Classification by experienced neuroradiologists resulted in the following balanced accuracies : 77% (neuroradiologist 1) and 72% (neuroradiologist 2) for LOAD vs depression, 72% and 75% for FTD vs EOAD, 57% and 63% for LBD vs LOAD (Table 4). Neuroradiological classification performed better than both SVM-AVS and univariate AVS except for LBD vs LOAD classification in which they performed equally. The performance of the SVM-WGM was in general comparable to that of neuroradiologists. However, it was superior to both radiologists for FTD vs EOAD classification.
Discussion
In this study, we assessed the diagnostic performance of AVS and SVM classifiers for various neurodegenerative conditions. SVM classifier based on whole gray matter provided accurate diagnostic classification for the majority of diagnoses and was far more accurate than univariate classification based on regional volumes such as hippocampal volume obtained through AVS. The performance of the SVM classifier was similar or slightly higher to that of trained neuroradiologists on selected classification tasks.
The best accuracies were obtained with SVM classification from whole gray matter maps. Balanced accuracy was superior to 70% in 64% of the available combinations and superior to 80% in 25% of them. Two studies evaluated SVM classification between AD and FTD in a research setting [16,30]. In this setting, they obtained slightly higher diagnostic classification, with AD vs. FTD classification ranging from 84% to 90% (in our study: FTD vs. EOAD: 83% and FTD vs. LOAD: 73%). This slightly superior accuracy might be explained by the more controlled setting of research studies, in particular less heterogeneous MRI acquisitions, and by the fact that our patients were at a slightly less advanced disease stage. Moreover, in Klöppel et al. [30], the use of anatomopathology as the diagnosis criteria, might have provided more homogeneous groups of patients, helping to better distinguish different diagnoses. To the best of our knowledge, only one study has previously evaluated SVM classifiers in clinical routine with various types of dementia [31]. The accuracies that we report are consistent with those reported in Koikkalainen et al, [31] in which diagnostic accuracy for FTD vs. AD was 80% (in our study, FTD vs. LOAD: 73% and FTD vs. EOAD: 83%), for LBD vs. AD 68% (in our study, LBD vs. EOAD: 77% and LBD vs. LOAD: 52%) and for LBD vs. FTD 77.5 (in our study, LBD vs. FTD: 67%). In this previous study, as compared to ours, there wasn't any patient with PPA or CBD. Furthermore, contrarily to our study, diagnoses were not assessed with the latest diagnosis criteria, especially regarding Alzheimer’s CSF biomarkers. Finally, this study did not compare the performance of SVM to that of AVS tools which are quickly becoming standard in radiological routine. Therefore, to the best of our knowledge, we present the first study of whole-brain classifiers on clinical routine data based on the latest diagnostic criteria, and with comparison to AVS tools, the current standard of quantitative clinical radiology.
When focusing on some particularly difficult clinical situations, automatic classification results are particularly promising. For instance, SVM classification distinguished depression, EOAD and FTD with an accuracy superior to 80%. In particular, SVM classification was more accurate than that of trained neuroradiologists for EOAD vs FTD. These situations often imply facing young patients, with an atypical symptomatic presentation. In these cases, there is often a dramatic impact on the professional and familial life. Finally, the diagnosis implies different types of care including choosing between cholinesterase inhibitors in AD versus antidepressant drugs in depression for instance or making a genetic diagnosis for FTD. Another challenging situation can be the disentanglement of PPA variants which all include predominant language impairment but are associated to variable neuropathological lesions [32]. SD could be distinguished from lv-PPA with an accuracy of 77%. As expected, the classifier, as well as the neuroradiologists, performed better on dementia known to have a strongly specific atrophy pattern (such as SD or FTD) [7] and worse on dementia with less specific atrophy patterns (LBD, CBD) [33,34]. Interestingly, the classifier allowed to distinguish SCD from the vast majority of neurodegenerative diseases with high accuracy. One can note that it performed better for SCD than for depression. One explanation could be the atrophy usually described in depression [35].
Compared to our SVM classifier, univariate classification based on AVS performed poorly. When analyzing the accuracy for diagnosis based on each of the volumes obtained with AVS, they ranged between 53% and 84%. With hippocampus alone, classifying rates rarely exceeded 70%, which is relatively low. In previous studies, the role of the hippocampus has been mainly evaluated for the diagnosis of AD versus controls or in mild cognitive impairment (MCI) populations to identify patients who will later progress to AD [8,9,11,36,37]. In our study, we evaluated MRI measurements in AD versus other dementia (FTD for instance), where hippocampal volumetry alone is known to perform poorly [38,39].
Poor performance of univariate classification and improvement when using SVM classification of both AVS volumes (balanced accuracy ranging from 60 to 80%) emphasize the fact that atrophy in dementia involves complex distributed spatial pattern. The only study comparing univariate (hippocampus) and multivariate analysis in two AVS (NeuroQuant™ and Neuroreader™) found different conclusions [13]. They didn’t find any additional prognostic performance with multivariate analysis compared to univariate.
Nevertheless, this study focused on prediction of progression to AD among MCI patients, an objective that differs from ours. Finally, the SVM classifier using whole gray matter generally performed better than the multivariate analyses of both AVS. This is likely because the pattern of atrophy may not coincide with the boundaries of the anatomical regions delineated by AVS. This demonstrates the interest of letting the algorithm learn a discriminative pattern from the whole gray matter, without prior, rather using anatomical boundaries provided by AVS.
Neuroradiological classification was generally more accurate than hippocampal volumetry using AVS. The only exception was for LBD vs LOAD, a differential diagnosis for which anatomical MRI does not bring much relevant information and for which all approaches performed relatively poorly. Neuroradiological classification and SVM-WGM generally achieved similar performance. Nevertheless, the performance of SVM-WGM was superior for EOAD vs FTD. This indicates that an automatic classifier can be a useful tool to assist trained neuroradiologists for difficult situations.
Our study also demonstrates the feasibility of those techniques in the context of routine MRI data of varying image quality and acquired at different magnetic field strength. AVS segmentation and SVM classification were successful on almost every MRI.
One limitation of our study is the use of a binary classifier which does not totally correspond to the clinical practice where patients can have multiple diagnostic hypotheses. Further investigations could include multi-group classification instead of paired groups, in order to obtain a probability related to each potential diagnosis. Another limitation that we did not include healthy controls but rather used two control groups composed of patients with depression and SCD respectively. However, this situation is representative of the clinical routine: patients seen in a memory clinic are usually diagnosed with a neurological or a psychiatric condition, or present with subjective cognitive impairment, and are thus not “pure” control subjects.
As AVS start to be implemented in clinical routine, a final step in the analysis of raw AVS volumes could be a classification with an SVM based on all the AVS data. By analogy with AVS, our SVM-WGM classifier could be implemented in the post-processing of MRI in clinical routine. Thus, neuroradiologists could use the indication provided by the automatic classifier to refine their diagnosis. Also, in our study,
neuroradiologists were operating in highly specialized centers and had considerable experience with different types of dementia (including rare diseases). It is thus conceivable that an automatic classifier would be of even greater help in less specialized centers.
Conclusion
Our study supports the applicability of computer-assisted diagnostic tools such as AVS and SVM classifiers to clinical routine data. When facing various dementia disorders, the accuracy of univariate volumetric analysis is too low to assist clinical decision making. In a clinical routine setting, automatic classifiers provide high diagnostic accuracy for distinguishing between several types of dementia. The implementation of advanced MRI-based computer-assisted diagnostic tools in clinical routine, such as SVM classification, could help to improve diagnostic accuracy.
References
[1] Jack CR, Knopman DS, Jagust WJ, Petersen RC, Weiner MW, Aisen PS, Shaw LM, Vemuri P, Wiste HJ, Weigand SD, Lesnick TG, Pankratz VS, Donohue MC, Trojanowski JQ (2013) Tracking pathophysiological processes in Alzheimer’s disease: an updated hypothetical model of dynamic biomarkers. Lancet Neurol. 12, 207–216.
[2] Rascovsky K, Hodges JR, Knopman D, Mendez MF, Kramer JH, Neuhaus J, Swieten JC van, Seelaar H, Dopper EGP, Onyike CU, Hillis AE, Josephs KA, Boeve BF, Kertesz A, Seeley WW, Rankin KP, Johnson JK, Gorno-Tempini M-L, Rosen H, Prioleau-Latham CE, Lee A, Kipps CM, Lillo P, Piguet O, Rohrer JD, Rossor MN, Warren JD, Fox NC, Galasko D, Salmon DP, Black SE, Mesulam M, Weintraub S, Dickerson BC, Diehl-Schmid J, Pasquier F, Deramecourt V, Lebert F, Pijnenburg Y, Chow TW, Manes F, Grafman J, Cappa SF, Freedman M, Grossman M, Miller BL (2011) Sensitivity of revised diagnostic criteria for the behavioural variant of frontotemporal dementia. Brain 134, 2456–2477.
[3] Dubois B, Feldman HH, Jacova C, Dekosky ST, Barberger-Gateau P, Cummings J, Delacourte A, Galasko D, Gauthier S, Jicha G, Meguro K, O’brien J, Pasquier F, Robert P, Rossor M, Salloway S, Stern Y, Visser PJ, Scheltens P (2007) Research criteria for the diagnosis of Alzheimer’s disease: revising the NINCDS-ADRDA criteria. Lancet Neurol. 6, 734–746.
[4] Armstrong MJ, Litvan I, Lang AE, Bak TH, Bhatia KP, Borroni B, Boxer AL, Dickson DW, Grossman M, Hallett M (2013) Criteria for the diagnosis of corticobasal degeneration. Neurology 80, 496–503.
[5] Scheltens P, Leys D, Barkhof F, Huglo D, Weinstein HC, Vermersch P, Kuiper M, Steinling M, Wolters EC, Valk J (1992) Atrophy of medial temporal lobes on MRI in “probable” Alzheimer’s disease and normal ageing: diagnostic value and neuropsychological correlates. J. Neurol. Neurosurg. Psychiatry 55, 967–972.
[6] Fox NC, Warrington EK, Freeborough PA, Hartikainen P, Kennedy AM, Stevens JM, Rossor MN (1996) Presymptomatic hippocampal atrophy in Alzheimer’s disease. Brain 119, 2001–2007.
[7] Rosen HJ, Gorno–Tempini ML, Goldman WP, Perry RJ, Schuff N, Weiner M, Feiwell R, Kramer JH, Miller BL (2002) Patterns of brain atrophy in frontotemporal dementia and semantic dementia. Neurology 58, 198– 208.
[8] Suppa P, Hampel H, Spies L, Fiebach JB, Dubois B, Buchert R, Alzheimer’s Disease Neuroimaging Initiative (2015) Fully Automated Atlas-Based Hippocampus Volumetry for Clinical Routine: Validation in Subjects with Mild Cognitive Impairment from the ADNI Cohort. J. Alzheimers Dis. JAD 46, 199–209.
[9] Chupin M, Gérardin E, Cuingnet R, Boutet C, Lemieux L, Lehéricy S, Benali H, Garnero L, Colliot O (2009) Fully Automatic Hippocampus Segmentation and Classification in Alzheimer’s Disease and Mild Cognitive Impairment Applied on Data from ADNI. Hippocampus 19, 579–587.
[10] Ahdidan J, Raji CA, DeYoe EA, Mathis J, Noe KØ, Rimestad J, Kjeldsen TK, Mosegaard J, Becker JT, Lopez O (2015) Quantitative Neuroimaging Software for Clinical Assessment of Hippocampal Volumes on MR Imaging. J. Alzheimers Dis. 49, 723–732.
[11] Coupé P, Fonov VS, Bernard C, Zandifar A, Eskildsen SF, Helmer C, Manjón JV, Amieva H, Dartigues J-F, Allard M, Catheline G, Collins DL, The Alzheimer’s Disease Neuroimaging Initiative (2015) Detection of Alzheimer’s disease signature in MR images seven years before conversion to dementia: Toward an early individual prognosis. Hum. Brain Mapp. 36, 4758–4770.
[12] Manjon JV, Coupé P (2015) volBrain: An online MRI brain volumetry system. In Organization for Human Brain Mapping’15 , Honolulu, United States.
[13] Azab M, Carone M, Ying SH, Yousem DM (2015) Mesial Temporal Sclerosis: Accuracy of NeuroQuant versus Neuroradiologist. Am. J. Neuroradiol. 36, 1400–1406.
[14] Tanpitukpongse TP, Mazurowski MA, Ikhena J, Petrella JR, Alzheimer’s Disease Neuroimaging Initiative (2017) Predictive Utility of Marketed Volumetric Software Tools in Subjects at Risk for Alzheimer Disease: Do Regions Outside the Hippocampus Matter? AJNR Am. J. Neuroradiol. 38, 546–552.
[15] Cuingnet R, Gerardin E, Tessieras J, Auzias G, Lehéricy S, Habert M-O, Chupin M, Benali H, Colliot O, Alzheimer’s Disease Neuroimaging Initiative (2011) Automatic classification of patients with Alzheimer’s disease from structural MRI: a comparison of ten methods using the ADNI database. NeuroImage 56, 766–781. [16] Davatzikos C, Resnick SM, Wu X, Parmpi P, Clark CM (2008) Individual patient diagnosis of AD and FTD
via high-dimensional pattern classification of MRI. NeuroImage 41, 1220–1227.
[17] Klöppel S, Stonnington CM, Chu C, Draganski B, Scahill RI, Rohrer JD, Fox NC, Jack CR, Ashburner J, Frackowiak RSJ (2008) Automatic classification of MR scans in Alzheimer’s disease. Brain 131, 681–689. [18] Magnin B, Mesrob L, Kinkingnéhun S, Pélégrini-Issac M, Colliot O, Sarazin M, Dubois B, Lehéricy S, Benali
H (2009) Support vector machine-based classification of Alzheimer’s disease from whole-brain anatomical MRI. Neuroradiology 51, 73–83.
[19] Vemuri P, Gunter JL, Senjem ML, Whitwell JL, Kantarci K, Knopman DS, Boeve BF, Petersen RC, Jack Jr. CR (2008) Alzheimer’s disease diagnosis in individual subjects using structural MR images: Validation studies. NeuroImage 39, 1186–1197.
[20] Teichmann M, Epelbaum S, Samri D, Levy Nogueira M, Michon A, Hampel H, Lamari F, Dubois B (2017) Free and Cued Selective Reminding Test – accuracy for the differential diagnosis of Alzheimer’s and neurodegenerative diseases: a large-scale biomarker-characterized monocenter cohort study (ClinAD). Alzheimers Dement.
[21] Dubois B, Feldman HH, Jacova C, Hampel H, Molinuevo JL, Blennow K, DeKosky ST, Gauthier S, Selkoe D, Bateman R, Cappa S, Crutch S, Engelborghs S, Frisoni GB, Fox NC, Galasko D, Habert M-O, Jicha GA, Nordberg A, Pasquier F, Rabinovici G, Robert P, Rowe C, Salloway S, Sarazin M, Epelbaum S, de Souza LC, Vellas B, Visser PJ, Schneider L, Stern Y, Scheltens P, Cummings JL (2014) Advancing research diagnostic criteria for Alzheimer’s disease: the IWG-2 criteria. Lancet Neurol. 13, 614–629.
[22] Gorno-Tempini ML, Hillis AE, Weintraub S, Kertesz A, Mendez M, Cappa SF, Ogar JM, Rohrer JD, Black S, Boeve BF, Manes F, Dronkers NF, Vandenberghe R, Rascovsky K, Patterson K, Miller BL, Knopman DS, Hodges JR, Mesulam MM, Grossman M (2011) Classification of primary progressive aphasia and its variants. Neurology 76, 1006–1014.
[23] Litvan I, Agid Y, Calne D, Campbell G, Dubois B, Duvoisin RC, Goetz CG, Golbe LI, Grafman J, Growdon JH, Hallett M, Jankovic J, Quinn NP, Tolosa E, Zee DS (1996) Clinical research criteria for the diagnosis of progressive supranuclear palsy (Steele-Richardson-Olszewski syndrome): report of the NINDS-SPSP international workshop. Neurology 47, 1–9.
[24] Tang-Wai DF, Graff-Radford NR, Boeve BF, Dickson DW, Parisi JE, Crook R, Caselli RJ, Knopman DS, Petersen RC (2004) Clinical, genetic, and neuropathologic characteristics of posterior cortical atrophy. Neurology 63, 1168–1174.
[25] McKeith IG, Dickson DW, Lowe J, Emre M, O’Brien JT, Feldman H, Cummings J, Duda JE, Lippa C, Perry EK, Aarsland D, Arai H, Ballard CG, Boeve B, Burn DJ, Costa D, Del Ser T, Dubois B, Galasko D, Gauthier S, Goetz CG, Gomez-Tortosa E, Halliday G, Hansen LA, Hardy J, Iwatsubo T, Kalaria RN, Kaufer D, Kenny RA, Korczyn A, Kosaka K, Lee VMY, Lees A, Litvan I, Londos E, Lopez OL, Minoshima S, Mizuno Y, Molina JA, Mukaetova-Ladinska EB, Pasquier F, Perry RH, Schulz JB, Trojanowski JQ, Yamada M,
Consortium on DLB (2005) Diagnosis and management of dementia with Lewy bodies: third report of the DLB Consortium. Neurology 65, 1863–1872.
[26] American Psychiatric Association (2013) Diagnostic and Statistical Manual of Mental Disorders, American Psychiatric Association.
[27] Koedam EL, Lauffer V, van der Vlies AE, van der Flier WM, Scheltens P, Pijnenburg YA (2010) Early-versus late-onset Alzheimer’s disease: more than age alone. J. Alzheimers Dis. 19, 1401–1408.
[28] Ashburner J, Friston KJ (2000) Voxel-Based Morphometry—The Methods. NeuroImage 11, 805–821. [29] Ashburner J (2007) A fast diffeomorphic image registration algorithm. NeuroImage 38, 95–113.
[30] Klöppel S, Stonnington CM, Barnes J, Chen F, Chu C, Good CD, Mader I, Mitchell LA, Patel AC, Roberts CC, Fox NC, Jack CR, Ashburner J, Frackowiak RSJ (2008) Accuracy of dementia diagnosis—a direct comparison between radiologists and a computerized method. Brain 131, 2969–2974.
[31] Koikkalainen J, Rhodius-Meester H, Tolonen A, Barkhof F, Tijms B, Lemstra AW, Tong T, Guerrero R, Schuh A, Ledig C, Rueckert D, Soininen H, Remes AM, Waldemar G, Hasselbalch S, Mecocci P, van der Flier W, Lötjönen J (2016) Differential diagnosis of neurodegenerative diseases using structural MRI data. NeuroImage Clin.
[32] Mesulam M-M, Weintraub S, Rogalski EJ, Wieneke C, Geula C, Bigio EH (2014) Asymmetry and
heterogeneity of Alzheimer’s and frontotemporal pathology in primary progressive aphasia. Brain 137, 1176– 1192.
[33] Burton EJ, Karas G, Paling SM, Barber R, Williams ED, Ballard CG, McKeith IG, Scheltens P, Barkhof F, O’Brien JT (2002) Patterns of Cerebral Atrophy in Dementia with Lewy Bodies Using Voxel-Based Morphometry. NeuroImage 17, 618–630.
[34] Whitwell JL, Jack CR, Boeve BF, Parisi JE, Ahlskog JE, Drubach DA, Senjem ML, Knopman DS, Petersen RC, Dickson DW, Josephs KA (2010) Imaging correlates of pathology in corticobasal syndrome. Neurology 75, 1879–1887.
[35] Bremner JD, Narayan M, Anderson ER, Staib LH, Miller HL, Charney DS (2000) Hippocampal volume reduction in major depression. Am. J. Psychiatry 157, 115–118.
[36] Ahdidan J, Raji CA, DeYoe EA, Mathis J, Noe KØ, Rimestad J, Kjeldsen TK, Mosegaard J, Becker JT, Lopez O Quantitative Neuroimaging Software for Clinical Assessment of Hippocampal Volumes on MR Imaging. J. Alzheimers Dis. 49, 723–732.
[37] Cui Y, Liu B, Luo S, Zhen X, Fan M, Liu T, Zhu W, Park M, Jiang T, Jin JS (2011) Identification of Conversion from Mild Cognitive Impairment to Alzheimer’s Disease Using Multivariate Predictors. PLoS ONE 6,.
[38] De Souza LC, Chupin M, Bertoux M, Lehéricy S, Dubois B, Lamari F, Le Ber I, Bottlaender M, Colliot O, Sarazin M (2013) Is hippocampal volume a good marker to differentiate Alzheimer’s disease from
frontotemporal dementia? J. Alzheimers Dis. 36, 57–66.
[39] van de Pol LA (2006) Hippocampal atrophy on MRI in frontotemporal lobar degeneration and Alzheimer’s disease. J. Neurol. Neurosurg. Psychiatry 77, 439–442.
Table 1. Demographic and clinical characteristics of the population.
Group differences were assessed with ANOVA for continuous variables and Χ2 test for discrete variables.
Data are expressed as mean +/- SD.
CBD = Cortico-basal syndrome, Depr. = Depression, EarlyAD = Early-onset AD, FTD = Fronto-temporal dementia of the
behavioral type, LBD= Lewy body dementia, LateAD = Late-Onset-AD, lv-PPA = logopenic variant of Primary progressive
aphasia, SCD= Subjective Cognitive Decline, SD = Semantic variant of primary progressive aphasia
Diagnosis Number mean ± SD [range] Age Gender mean ± SD MMSE [range] Magnetic Field (1T / 1.5T / 3T) CBD 31 69.75 ± 1.4 16 M / 15 F 23.2 ± 4.5 16 / 10 / 5 Depression 24 64.52 ± 1.6 6 M / 18 F 25.2 ± 3.2 18 / 3 / 3 EarlyAD 34 59.72 ± 1.49 13 M / 21 F 20.0 ± 5.5 21 / 7 / 6 FTD 39 67.31 ± 1.315 22 M / 17 F 23.2 ± 4.2 19 / 7 / 13 LBD 22 70.6 ± 1.75 13 M / 9 F 22.3 ± 6.1 13 / 5 / 4 LateAD 49 73.5 ± 1.21 25 M / 24 F 22.4 ± 4.1 24 / 9 / 16 lv-PPA 23 67.05 ± 1.7 15 M / 8 F 19.9 ± 5.2 6 / 6 / 11 SD 17 65.36 ± 1.99 10 M / 7 F 20.9 ± 8.1 7 / 5 / 5 SCD 12 72.5 ± 2.15 3 M / 9 F 25,2 ± 2.9 3/3/6 p-value < 0.0001 0.25 0.01 0.12
Table 2. Classification results for univariate classification from hippocampal volumes obtained with Neuroreader™ ASS. For each pair of possible diagnoses, we report the balanced accuracy. Chance level
classification is at 50%. Colder colors (green/blue) correspond to less accurate classifications while warmer colors (red/orange) correspond to more accurate classifications.
CBD = Cortico-basal syndrome, Depr. = Depression, EarlyAD = Early-onset AD, FTD = Fronto-temporal dementia of the behavioral type, LBD= Lewy body dementia, LateAD = Late-Onset-AD, lv-PPA = logopenic variant of Primary progressive aphasia, SCD= Subjective Cognitive Decline, SD = Semantic variant of primary progressive aphasia
SCD Depr. EarlyAD LateAD CBD LBD FTD lv-PPA SD
SCD X X 53% 65% 56% 55% 63% 49% 64% Depr. X X 61% 71% 53% 59% 70% 60% 71% EarlyAD 53% 61% X 58% 59% 48% 60% 52% 63% LateAD 65% 71% 58% X 66% 62% 48% 69% 46% CBD 56% 53% 59% 66% X 60% 66% 57% 68% LBD 55% 59% 48% 62% 60% X 58% 53% 60% FTD 63% 70% 60% 48% 66% 58% X 66% 52% lv-PPA 49% 60% 52% 69% 57% 53% 66% X 70% SD 64% 71% 63% 46% 68% 60% 52% 70% X
Table 3. Classification results for SVM classification from Whole Gray Matter maps. For each pair of
possible diagnoses, we report the balanced accuracy. Chance level is at 50%. Colder colors (green/blue) correspond to less accurate classifications while warmer colors (red/orange) correspond to more accurate classifications.
CBD = Cortico-basal syndrome, Depr. = Depression, EarlyAD = Early-onset AD, FTD = Fronto-temporal dementia of the behavioral type, LBD= Lewy body dementia, LateAD = Late-Onset-AD, lv-PPA = logopenic variant of Primary progressive aphasia, SCD= Subjective Cognitive Decline, SD = Semantic variant of primary progressive aphasia
SCD Depr. EarlyAD LateAD CBD LBD FTD lv-PPA SD
SCD X X 90% 85% 87% 69% 80% 75% 87% Depr. X X 83% 73% 78% 71% 82% 66% 86% EarlyAD 90% 83% X 59% 70% 77% 82% 67% 71% LateAD 85% 73% 59% X 78% 52% 74% 54% 73% CBD 87% 78% 70% 78% X 55% 67% 58% 88% LBD 69% 71% 77% 52% 55% X 67% 54% 84% FTD 80% 82% 82% 74% 67% 67% X 70% 73% lPPA 75% 66% 67% 54% 58% 54% 70% X 77% SD 87% 86% 71% 73% 88% 84% 73% 77% X
Table 4. Comparative performances of Neuroradiologists, univariate AVS, and automatic classifiers.
The three diagnostic classification tasks are Depression vs LOAD, FTD vs EOAD and LBD vs LOAD.
AVS = Automated Volumetry Software
SVM-AVS = Support Vector Machine Automated Volumetry Software
Depression vs LOAD FTD vs EOAD LBD vs LOAD
Neuroradiologist 1 77% 72% 57%
Neuroradiologist 2 72% 75% 63%
Hippocampal volumetry (AVS) 71% 60% 62%
SVM-AVS (VolBrain) 60% 67% 54%
SVM-AVS (Neuroreader) 76% 67% 63%
Appendix
Supplementary Figure 1. Spatial pattern learned by the classification algorithm. The maps represent
contribution of each voxel to classification towards a given class (blue/green) or the other (yellow/red). Left panel: FTD (in yellow/red) vs. EarlyAD (in blue/green) displaying an anteroposterior gradient of atrophy.
Right: LateAD (in blue/green) vs. depression (in yellow red) with medial temporal lobe voxels mostly blue/green.
Supplementary Table 1. Patients Flow Chart
Supplementary Table 2. Patients MRI Sequence parameters.
Magnetic Field Strength = MF, T = Tesla, TE = Echo time, TR = Repetition time, TI = Inversion Time, ST = Slice Thickness, FA = Flip Angle, NA = Number of averages, PS = Pixel spacing, MT = Matrix Type
3D IR -FSP G R 3D T1 GE SI GN A EXCI TE FSP G R 3 D GE SI GN A OP TIM A 3D T1 BRA VO N/A GE SI GN A HD eT1W 3D TFE Philip s Pan or am a HF O MRI ma ch in e/ Seq uenc e typ e 16 28 44 9 9 62 1 63 123 123 1. 5 1.5 1.5 3 3 1 (T) MF 1. 87 1.88 1.97 2.52 NA 3.90 (ms) Min TE 2. 56 8 2.58 3.57 NA 4.35 Ma TE x (m s) 6. 58 8.89 6.19 6.24 NA 8.33 (ms) Min TR 9. 80 23 8.04 9.08 NA 9.08 (ms) Max TR 600 600 300 380 NA NA (m Min TI s) 1000 600 450 450 NA NA M TI ax (m s) 1. 40 1.40 1 1 NA 1.20 (mm Min ST ) 1. 50 1.50 1.20 1.40 NA 1.20 (mm Max ST ) 8 10 12 11 NA 8 (°) Min FA 10 35 15 15 NA 8 (° Max FA ) 1 0.75 0.90 0.50 NA 1 Min NA 1 1 1 1 NA 1 Max NA 0. 94 0.86 0.47 0.49 NA 0.99 (mm Min PS ) 1. 02 0.94 0.94 1 NA 1 (mm Max PS ) 13 NA 192 256X MT 28 NA 192 192X MT 3 38 NA 123 256 256X MT 9 1 NA 224 224X MT 14 NA 288 288X MT 9 NA 224 288X MT
Supplementary Table 3. Mean volumes obtained through automatical segmentation using Neuroreader™.
Volumes are expressed in cm3 or as a percentage of Total Intracranial Volume. P-value were calculated
using an ANOVA.
CBD = Cortico-basal degeneration, EOAD = Early-onset AD, FTD = Fronto-temporal dementia of the behavioral type, LBD= Lewy body dementia, LOAD = Late-Onset-AD, lv-PPA = logopenic variant of Primary progressive aphasia, SD = Semantic dementia, GM = Grey Matter, WM = White Matter, CSF = Cerebrospinal Fluid
WM (m l) SD GM (ml ) SD CSF (m l) SD Hi ppoc . (Vo l/TIV) SD Amyg d. (v ol /T IV) SD Ca ud . N . (Vo l/TIV) SD Ven tr ic . (Vo l/TIV) SD Pu tam en (Vo l/TIV) SD Th alam us (Vo l/TIV) SD Fr on t. L. (m l) SD Par iet. L. (m l) SD Oc cip. L. (Vol /T IV) SD Tem p. L. (vo l/TIV) SD Pallid um (Vo l/TIV) SD 587, 40 20, 17 433, 49 0,62 538, 57 15, 32 0,36 0,01 0,09 0,00 0,34 010, 2,79 0,21 0,35 0,01 0,87 0,02 348, 97 7,97 176, 31 3,81 91, 35 2,10 200, 20 4,55 0,13 0,01 CBD 524, 22 22, 92 495, 61 0,70 473, 77 17, 42 0,38 0,01 0,11 0,01 0,37 010, 1,58 0,24 0,43 0,01 0,94 0,02 357, 97 9,06 181, 82 4,33 89, 01 2,39 195, 91 5,17 0,14 0,01 De pr . 572, 60 19, 55 414, 47 0, 68 496,25 14,85 0,34 0,01 0,09 0,00 0,34 0,01 2,14 0,21 0,40 010, 0,91 0,02 349,06 7,73 171,61 693, 87,09 2,03 186,18 4,41 0,16 0,01 Ear lyAD 559, 97 17, 98 398, 66 0, 61 527, 49 13, 66 0,33 0,01 0,09 0,00 0,30 010, 2,75 0,19 0,35 0,01 0,85 0,02 310, 57 7, 11 175,42 3,39 89,47 1,87 187, 04 4, 05 0,12 0,00 FTD 567, 26 23, 94 487, 03 0, 65 494, 12 18, 19 0,35 0,01 0,09 0,01 0,37 010, 2,71 0,25 0,41 0,02 0,90 0,02 369, 23 9, 46 187, 84 4, 52 94,32 2,49 197, 12 5, 40 0,15 0,01 LBD 565, 41 16, 04 441, 10 0, 64 490, 73 12, 19 0,33 0,01 0,09 0,00 0,36 010, 2,31 0,17 0,41 0,01 0,88 0,01 351, 99 6, 34 178, 10 3, 03 89,07 1,67 189, 07 3, 62 0,14 0,00 LateA D 573, 40 23, 41 438, 98 0, 67 502, 12 17, 79 0,36 0,01 0,10 0,01 0,35 010, 2,39 0,25 0,41 0,02 0,92 0,02 352, 31 9, 26 172, 76 4, 42 90,11 2,44 190, 69 5, 28 0,14 0,01 lv -PPA 580, 83 27, 23 438, 06 0, 63 495, 23 20, 69 0,33 0,01 0,08 0,01 0,36 020, 2,55 0,29 0,39 0,02 0,91 0,03 359, 63 10, 77 188, 09 5, 14 92,43 2,83 168, 77 6, 14 0,14 0,01 SD 506, 32 32, 41 468, 69 0, 68 431,50 24,63 0,36 0,02 0,12 010, 0,40 0,02 2,15 0,34 0,46 0,02 0,91 0,03 338,87 12,82 175,50 6,12 1887, 3,37 188,06 7,31 0,17 0,01 SCD 0, 41 0,03 0,03 0,00 < 0, 0001 0,00 0,01 < 0, 0001 0,03 < 0, 0001 0,07 0,49 0,01 < 0, 0001 p
Supplementary Table 4. Classification results for univariate classification from gray matter volumes
obtained using Neuroreader™. For each pair of possible diagnoses, we report the balanced accuracy. Chance level is at 50%. Colder colors (green/blue) correspond to less accurate classifications while warmer colors (red/orange) correspond to more accurate classifications.
SCD Depr. EarlyAD LateAD CBD LBD FTD lv-PPA SD
SCD X X 62% 61% 61% 59% 66% 58% 54% Depr. X X 66% 66% 65% 63% 74% 62% 62% EarlyAD 62% 66% X 50% 52% 56% 60% 55% 46% LateAD 61% 66% 50% X 47% 55% 64% 47% 50% CBD 61% 65% 52% 47% X 55% 63% 56% 46% LBD 59% 63% 56% 55% 55% X 67% 55% 52% FTD 66% 74% 60% 64% 63% 67% X 70% 64% lv-PPA 58% 62% 55% 47% 56% 55% 70% X 55% SD 54% 62% 46% 50% 46% 52% 64% 55% X
Supplementary Table 5. Classification results for univariate classification from caudate nucleus volumes
obtained using Neuroreader™. For each pair of possible diagnoses, we report the balanced accuracy. Chance level is at 50%. Colder colors (green/blue) correspond to less accurate classifications while warmer colors (red/orange) correspond to more accurate classifications.
SCD Depr. EarlyAD LateAD CBD LBD FTD lv-PPA SD
SCD X X 78% 68% 79% 65% 87% 70% 69% Depr. X X 67% 54% 66% 55% 72% 58% 57% EarlyAD 78% 67% X 61% 51% 56% 57% 67% 55% LateAD 68% 54% 61% X 60% 50% 67% 51% 53% CBD 79% 66% 51% 60% X 58% 62% 64% 55% LBD 65% 55% 56% 50% 58% X 66% 51% 51% FTD 87% 72% 57% 67% 62% 66% X 69% 61% lv-PPA 70% 58% 67% 51% 64% 51% 69% X 48% SD 69% 57% 55% 53% 55% 51% 61% 48% X
Supplementary Table 6. Classification results for univariate classification from amygdala volumes
obtained using Neuroreader™. For each pair of possible diagnoses, we report the balanced accuracy. Chance level is at 50%. Colder colors (green/blue) correspond to less accurate classifications while warmer colors (red/orange) correspond to more accurate classifications.
SCD Depr. EarlyAD LateAD CBD LBD FTD lv-PPA SD
SCD X X 60% 69% 70% 65% 67% 62% 66% Depr. X X 62% 67% 67% 62% 72% 55% 76% EarlyAD 60% 62% X 52% 56% 52% 53% 59% 59% LateAD 69% 67% 52% X 58% 56% 50% 62% 58% CBD 70% 67% 56% 58% X 46% 59% 63% 65% LBD 65% 62% 52% 56% 46% X 57% 62% 64% FTD 67% 72% 53% 50% 59% 57% X 65% 58% lv-PPA 62% 55% 59% 62% 63% 62% 65% X 71% SD 66% 76% 59% 58% 65% 64% 58% 71% X
Supplementary Table 7. Classification results for univariate classification from temporal lobe volumes
obtained using Neuroreader™. For each pair of possible diagnoses, we report the balanced accuracy. Chance level is at 50%. Colder colors (green/blue) correspond to less accurate classifications while warmer colors (red/orange) correspond to more accurate classifications.
SCD Depr. EarlyAD LateAD CBD LBD FTD lv-PPA SD
SCD X X 59% 64% 52% 59% 67% 59% 74% Depr. X X 63% 64% 62% 63% 69% 59% 82% EarlyAD 59% 63% X 51% 54% 48% 55% 53% 64% LateAD 64% 64% 51% X 60% 49% 57% 52% 61% CBD 52% 62% 54% 60% X 55% 67% 57% 73% LBD 59% 63% 48% 49% 55% X 62% 49% 75% FTD 67% 69% 55% 57% 67% 62% X 52% 61% lv-PPA 59% 59% 53% 52% 57% 49% 52% X 61% SD 74% 82% 64% 61% 73% 75% 61% 61% X
Supplementary Table 8. Classification results for univariate classification from frontal lobe volumes
obtained using Neuroreader™. For each pair of possible diagnoses, we report the balanced accuracy. Chance level is at 50%. Colder colors (green/blue) correspond to less accurate classifications while warmer colors (red/orange) correspond to more accurate classifications.
SCD Depr. EarlyAD LateAD CBD LBD FTD lv-PPA SD
SCD X X 47% 57% 62% 50% 76% 55% 59% Depr. X X 58% 61% 69% 63% 82% 62% 61% EarlyAD 47% 58% X 56% 62% 48% 71% 59% 58% LateAD 57% 61% 56% X 59% 53% 74% 52% 55% CBD 62% 69% 62% 59% X 68% 72% 55% 54% LBD 50% 63% 48% 53% 68% X 80% 58% 54% FTD 76% 82% 71% 74% 72% 80% X 75% 73% lv-PPA 55% 62% 59% 52% 55% 58% 75% X 45% SD 59% 61% 58% 55% 54% 54% 73% 45% X
Supplementary Table 9. Classification results for univariate classification from parietal lobe volumes
obtained using Neuroreader™. For each pair of possible diagnoses, we report the balanced accuracy. Chance level is at 50%. Colder colors (green/blue) correspond to less accurate classifications while warmer colors (red/orange) correspond to more accurate classifications.
SCD Depr. EarlyAD LateAD CBD LBD FTD lv-PPA SD
SCD X X 73% 62% 72% 58% 74% 74% 59% Depr. X X 71% 70% 75% 59% 74% 72% 61% EarlyAD 73% 71% X 58% 52% 61% 54% 50% 58% LateAD 62% 70% 58% X 60% 57% 62% 61% 56% CBD 72% 75% 52% 60% X 62% 54% 52% 57% LBD 58% 59% 61% 57% 62% X 66% 67% 46% FTD 74% 74% 54% 62% 54% 66% X 48% 59% lv-PPA 74% 72% 50% 61% 52% 67% 48% X 59% SD 59% 61% 58% 56% 57% 46% 59% 59% X
Supplementary Table 10. Classification results for SVM classification from fall volumes obtained using
volBrain (on top) and Neuroreader™ (at the bottom). For each pair of possible diagnoses, we report the balanced accuracy. Chance level is at 50%. Colder colors (green/blue) correspond to less accurate classifications while warmer colors (red/orange) correspond to more accurate classifications.
VolBrain
SCD Depr. EarlyAD LateAD CBD LBD FTD lv-PPA SD
SCD X X 82% 57% 81% 64% 80% 60% 72% Depr. X X 71% 68% 68% 70% 79% 72% 85% EarlyAD 82% 71% X 72% 65% 68% 73% 52% 58% LateAD 57% 68% 72% X 78% 68% 77% 68% 62% CBD 81% 68% 65% 78% X 60% 56% 59% 67% LBD 64% 70% 68% 68% 60% X 69% 56% 77% FTD 80% 79% 73% 77% 56% 69% X 60% 54% lv-PPA 60% 72% 52% 68% 59% 56% 60% X 71% SD 72% 85% 58% 62% 67% 77% 54% 71% X Neuro Reader
SCD Depr. EarlyAD LateAD CBD LBD FTD lv-PPA SD
SCD X X 62% 54% 78% 63% 74% 62% 79% Depr. X X 65% 60% 75% 56% 77% 70% 79% EarlyAD 62% 65% X 61% 80% 70% 67% 62% 73% LateAD 54% 60% 61% X 69% 54% 66% 64% 70% CBD 78% 75% 80% 69% X 63% 60% 60% 83% LBD 63% 56% 70% 54% 63% X 69% 54% 84% FTD 74% 77% 67% 66% 60% 69% X 65% 82% lv-PPA 62% 70% 62% 64% 60% 54% 65% X 65% SD 79% 79% 73% 70% 83% 84% 82% 65% X
![[PDF] Formation d’introduction à Common Lisp pour débutant | Formation informatique](data:image/gif;base64,R0lGODlhAQABAIAAAP///wAAACH5BAEAAAAALAAAAAABAAEAAAICRAEAOw==)