HAL Id: hal-01998086
https://hal-enac.archives-ouvertes.fr/hal-01998086
Submitted on 29 Jan 2019
HAL is a multi-disciplinary open access
archive for the deposit and dissemination of
sci-entific research documents, whether they are
pub-lished or not. The documents may come from
teaching and research institutions in France or
abroad, or from public or private research centers.
L’archive ouverte pluridisciplinaire HAL, est
destinée au dépôt et à la diffusion de documents
scientifiques de niveau recherche, publiés ou non,
émanant des établissements d’enseignement et de
recherche français ou étrangers, des laboratoires
publics ou privés.
A combined MRI biomarker approach using a
non-standard Multiple Factor Analysis
Sana Rebbah, Daniel Delahaye, Stéphane Puechmorel, Florence Nicol, Pierre
Maréchal, Isabelle Berry
To cite this version:
Sana Rebbah, Daniel Delahaye, Stéphane Puechmorel, Florence Nicol, Pierre Maréchal, et al.. A
combined MRI biomarker approach using a non-standard Multiple Factor Analysis. CISP-BMEI 2018,
11th International Congress on Image and Signal Processing, BioMedical Engineering and Informatics,
Oct 2018, Beijing, China. pp.art. no. 8633261., �10.1109/CISP-BMEI.2018.8633261�. �hal-01998086�
A combined MRI biomarker approach using a
non-standard Multiple Factor Analysis
Sana Rebbah
∗†, Daniel Delahaye
†, Stephane Puechmorel
†, Florence Nicol
†, Pierre Marechal
§and Isabelle Berry
∗‡∗ INSERM ToNIC, Toulouse Neuroimaging Center UMR1214, University Toulouse III Paul Sabatier, Toulouse, France §Institut de Math´ematiques de Toulouse, IMT, University Toulouse III Paul Sabatier, Toulouse, France
†Ecole Nationale de l’Aviation Civile, ENAC, Toulouse, France´ ‡University Hospital Center Toulouse, France
Abstract—In medical applications, various MRI biomarkers, which are extracted from different MRI modalities, are used to detect physiologic abnormalities but different biomarkers are usually sensitive to different aspects of the disease. Thus, it would be interesting to use the information carried by multiple biomarkers, especially in the context of clinical trials where the efficiency of a treatment should be judged as precisely as possible.
This paper proposes an approach that combined various MRI biomarkers in the context of a Multiple Sclerosis (MS) clinical trial. The method mainly includes four steps: After extracting the biomarkers from different MRI modalities, a histogram analysis is performed followed by a Multiple Factor Analysis (MFA) to produce linear combinations of the MRI biomarkers and finally, a Hierarchical Clustering based on the MFA results is executed.
The aim of this approach is to conclude more effectively on the effect of a treatment in a clinical trial.
Keywords–MRI; Biomarker; Dimensionality reduction; His-togram analysis
I. INTRODUCTION
Magnetic Resonance Imaging (MRI) of the brain plays an important role in diagnosing Multiple Sclerosis (MS), monitoring treatment response and predicting disease progres-sion. Multiple sclerosis is an inflammatory, demyelinating and neurodegenerative disease [1], characterized by the presence of multiple lesions in the central nervous system and clinically by relapses and accumulation of neurological disability. MS presents with different phenotypes, around 85% MS patients have a relapsing-remitting (RRMS) form of the disease. After 10-20 years, more than 50% of RRMS patients convert to the secondary progressive stage of the disease (SPMS), charac-terized by a gradual neurological decline without relapses. In about 15% of the cases, MS has a progressive course from the beginning called primary progressive MS (PPMS).
Over the past two decades, significant progress has been made in the treatment of MS with the introduction of effective therapies for the RRMS form of the disease [2] but to date, the results of clinical trials focusing on the progressive form of the disease (SPMS and PPMS) have been generally disappointing. Indeed, the new treatments seem to be more effective in preventing new relapses or MRI lesions and in decreasing the disability progression in the short term than in the long
term. An overview of recent therapeutics in progressive MS is presented in [3].
The understanding of the complex and diffuse mechanisms underlying multiple sclerosis is still limited and it’s believed that multimodal approach is needed to generate combined measures reflecting the respective weight of the mechanisms and thereby clarify the complex pathophysiology of the dis-ease. Today, thanks to scientific advances in medical research, we have access to a wide range of biomarkers and it has been accepted that a unique biomarker can not, by itself, reflect all the disease mechanisms. Consequently, many studies were interested in combining biomarkers to improve the accuracy of diagnosis tests, or for other applications such as genotype classification or treatment selection. To do so, linear methods [4]–[8] or more recently nonlinear methods [9]–[11] has been popularly employed to combine multiple biomarkers in various neurological diseases.
Conventional MRI (e.g. T1-weighted MRI) provides crucial pieces of information of the MS mechanisms such as quan-tification of brain atrophy by measuring brain tissue volumes and cortical thickness (CTh) [12]. However conventional MRI sequences are unable to detect or quantify heterogeneous features of the disease (i.e. demyelination, remyelination and axonal loss). Non-conventional MRI sequences provides biomarkers that have the potential to overcome, at least partially, such limitations. Indeed, many studies suggest that Magnetization Transfer Ratio (MTR) is primarily a demyeli-nation biomarker [13], and Fractional Anisotropy (FA) and Apparent Diffusion Coefficient (ADC) from the Diffusion weighted imaging are more representative of tissue destruction and axonal loss [14] [15].
One of the most important goal of a clinical trial is to be as precise as possible to deduce the effect of a drug and that’s the reason why we proposed to go further than traditional studies that propose individual biomarkers analysis based on statistical analysis between a treated group and a placebo group. The idea was firstly to perform a histogram analysis and extract 11 quantiles for each one of the MRI biomarker histogram, instead of relying our study on some single average measures such as the mean or the median. Indeed, some studies have investigated the benefit of histogram analysis in neurological diseases, according to [16], it provides
useful insight into underlying disease mechanisms and allows the quantification of diffuse pathological change. The use of this approach is particularly interesting in the case of MS due to the presence of simultaneously lesions in central nervous system and diffuse abnormality in brain tissue. MR measures as MTR [17] [18] and diffusion biomarkers (i.e. ADC and FA) are sensitive to this subtle abnormality and thus we used histogram analysis of these biomarkers to take into account the diffuse changes in MS. After the histogram analysis, we used a factorial analysis called Multiple Factor Analysis (MFA) to extract linear combinations of the biomarkers (i.e. principal components). Finally, we proposed a Hierarchical Clustering algorithm based on principal components (HCPC).
II. MATERIALS
A. Database
The data were obtained from an MRI substudy of a Multiple Sclerosis clinical trial called MS-SPI. MS-SPI is a phaseIII randomized placebo-controlled multicenter trial with the aim to study the effect of high dose-biotin (MD1003) in Pro-gressive Multiple Sclerosis. MD1003 is an experimental drug that could promote the activity of several enzymes, including acetylCoA carboxylase, which are involved in the production of energy and the synthesis of myelin [19]. Its mode of action may affect targets related to progressive multiple sclerosis.The pilot study [20] [21] indicates clinical improvement (i.e. EDSS and T25FW) in 91% of participants within two to eight months of starting MD1003 treatment.
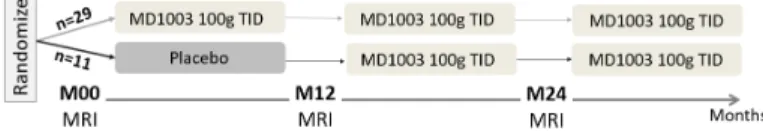
During a 12-month placebo-controlled phase, patients were randomized to receive MD1003 (biotin 100mg) or placebo orally three times a day (TID). This was followed by MD1003 for all patients for a further 12 months and 24 months. The design of the clinical trial is presented in Fig. 1.
B. Participant
40 patients with progressive Multiple Sclerosis from the MS-SPI clinical trial were included to our study. Among these patients, 29 patients received the MD1003 drug and 11 patients received a placebo (see the demographic details in Table I) C. MRI biomarkers
The 3 Tesla MRI from the clinical trial ancillary study provides conventional sequences (e.g. 3D T1-weighted MRI) and non-conventional sequences such as Diffusion tensor imaging (DTI) and Magnetization Transfer Imaging (MTI). We extracted 4 biomarkers from these MRI sequences: – Cortical Thickness (CTh) was measured from T1-weighted
Fig. 1: Design of the clinical trial (the MRI substudy)
(a) CTh (b) FA (c) ADC (d) MTR
Fig. 2: Biomarkers maps and the corresponding histogram Abbreviations: CTh, Cortical Thickness; ADC, Apparent Dif-fusion Coefficient; FA, Fractional Anisotropy; MTR, Magne-tization Transfer Ratio.
MRI using the Matlab Toolbox CorThiZon [22]. The cortical thickness was computed on the whole cortical ribbon using a Laplace’s-equation-based algorithm as described in [23]. – Fractional Anisotropy (FA) and Apparent Diffusion Coefficient (ADC) were calculated in the whole brain from DTI using MedINRIA software (http://med.inria.fr/) on a voxel-by-voxel basis [24].
– Magnetization Transfer Ratio (MTR) was calculated in the whole brain from the Magnetization Transfer Imaging MTI following (1) on a voxel-by-voxel basis.
M T R = (SIof f− SIon) SIof f
× 100 (1) where SIof f and SIon represent the signal intensity with the
Magnetization Transfer pulse (MT pulse) turned off and on, respectively.
III. METHOD
In order to combine the MRI biomarkers, Multiple Factor Analysis (MFA) was used. Since our aim is to conclude more effectively on the contribution of a treatment in a clinical trial, it was important to combine the biomarkers in the most accurate and efficient way.
TABLE I: Demographic and clinical characteristics of the study population at the baseline
MD1003 Placebo p-value (n=29) (n=11)
Age (years) 51.4 ± 9.0 50.5 ± 7.5 0.9 Sex (M/F) 16 / 13 4 / 7 0.3 MS form (PPMS / SPMS) 14 / 15 6 / 5 0.8 Disease duration (years) 15 ± 6.7 19.6 ± 7.7 0.2 EDSS 5.8 ± 1.0 6.3 ± 0.5 0.06
Plus-minus values are means ± standard deviation. All p-values are based on Mann-Whitney U-tests, apart from Sex and MS form comparisons, which were based on Chi-square tests. MD1003 is the treatment that is evaluated in the clinical trial. Abbreviations: PPMS, Primary Progressive Multiple Sclerosis; SPMS, Secondary Progressive Multiple Sclerosis; EDSS, Ex-panded Disability Status Scale.
In our study, we started by using the classical approach that consists on evaluating the treatment based on individual and independent analysis of the biomarkers. Then, we applied our approach that first combined the biomarkers using MFA and then performed a hierarchical clustering on the principal components obtained from the MFA to cluster the patients receiving the treatment and patients receiving the placebo. A. Individual analysis
The individual analysis of the biomarkers approach consists on performing a statistical analysis on each biomarker mean, separately. A comparison between the MD1003 group and the Placebo group based on the biomarkers means is performed using the Mann-Whitney U-test, a non-parametric alternative to the unpaired two-samples t-test. It’s used when the data are not normally distributed.
B. Combination of MRI biomarkers 1) Histogram analysis:
By computing the MRI biomarkers in the whole brain or in the entire cortex in the case of the cortical thickness, 3D biomarkers maps were obtained and shown in Fig. 2 where every voxel represent a value of the corresponding biomarker. From these maps, histograms were extracted and analyzed. In our case, histogram analysis consist on extracting 11 Quantiles from every biomarker histogram: Q0% (min), Q10%, Q20%, Q30%, Q40%, Q50%(median), Q60%, Q70%, Q80%, Q90% and Q100% (max). These quantiles were introduce as active variables in the Multiple Factor Analysis.
2) Multiple Factor Analysis based on quantiles:
Multiple factor analysis (MFA) is a weighted extension of Principal Component Analysis (PCA) for multiple data tables that measure sets of variables collected on the same observations . MFA makes it possible to analyze those tables of variables simultaneously, and to obtain results, in partic-ular charts, that allow studying the relationship between the observations, the variables and tables [25].
In our case, subjects were scanned every year for a 3 years period, at the baseline (M00) and two times after that, at the 12th month (M12) and the 24th month (M24). 44 variables (11quantiles × 4biomarkers) are measured on 40 subjects (i.e. MS patients). These measures are made on 3 dates (i.e. M00, M12 and M24). There are many ways to analyze such set of data. One of them, suggested by the MFA, is to consider each date as a group of variables in the analysis of tables (i.e. data of each group). The analyzed table therefore has 40 rows and 3 × 44 columns.
C. Hierarchical Clustering on Principal component
The Hierarchical Clustering on Principal Components (HCPC) approach allows us to combine standard methods used in multivariate data analysis: Principal component methods such as MFA and Hierarchical Clustering [26].
The MFA reduced the dimensionality of the data into new variables (i.e. principal components) containing the most im-portant information of the data. MFA can be considered as a
TABLE II: Biomarkers differences between the MD1003 group and the Placebo group
A: Statistical analysis at the Baseline M00
MD1003 Placebo p-value CTh (mm) 2.6 ± 0.3 2.7 ± 0.2 n.s FA 0.26 ± 0.02 0.25 ± 0.02 n.s ADC (×10−3mm2/s) 1.2 ± 0.1 1.2 ± 0.2 n.s MTR 0.39 ± 0.01 0.39 ± 0.02 n.s B: Statistical analysis at M12 MD1003 Placebo p-value CTh (mm) 2.6 ± 0.3 2.7 ± 0.2 n.s FA 0.26 ± 0.02 0.26 ± 0.02 n.s ADC (×10−3mm2/s) 1.2 ± 0.1 1.2 ± 0.1 n.s MTR 0.39 ± 0.02 0.39 ± 0.0 n.s C: Statistical analysis at M24 MD1003 Placebo p-value CTh (mm) 2.6 ± 0.3 2.7 ± 0.2 n.s FA 0.23 ± 0.3 0.23 ± 0.02 n.s ADC (×10−3mm2/s) 1.1 ± 0.1 1.1 ± 0.1 n.s MTR 0.39 ± 0.02 0.39 ± 0.01 n.s
Plus-minus values are means ± standard deviation. All p-values are based on Mann-Whitney U-tests. FA and MTR are fractions, their values vary between 0 and 1.
Abbreviations: n.s, not significant; CTh, Cortical Thick-ness; ADC, Apparent Diffusion Coefficient; FA, Fractional Anisotropy; MTR, Magnetization Transfer Ratio.
preprocessing and denoising step which can lead to a more stable clustering. Indeed, MFA allows to take into account the groups structure in the clustering and make the clustering more robust by deleting the last dimensions.
To evaluate the clustering quality we used Rand Index (RI), a widely used external criterion, It is a measure of agreement between two sets of objects: first is the set produced by clustering process (i.e. HCPC clusters) and the other defined by external criteria (i.e. the actual labels). Rand index is related to the accuracy.
IV. RESULTS
A. Statistical analysis
Based on the Mann-Whitney U-test, no significant differ-ences were found between treated and placebo patients at the baseline M00, at M12 or at M24. The result are presented in TABLE II.
B. Multiple Factor Analysis on the biomarkers
As mentioned in Method section, the MFA groups are represented by the 3 dates (M00, M12 and M24) and the MFA variables by the quantiles of each biomarkers. We added a supplementary group called ’Drug’ which describes whether a patient is from the MD1003 group or from the Placebo group. A supplementary group has no influence on the creation of the principal components but still has an importance for the interpretation.
By following the Kaiser rule that suggests to retain only the axes associated with eigenvalues higher than 1, we focused on the first 3 principal components (PCs) that explain 71% of the total variability carried by the data.
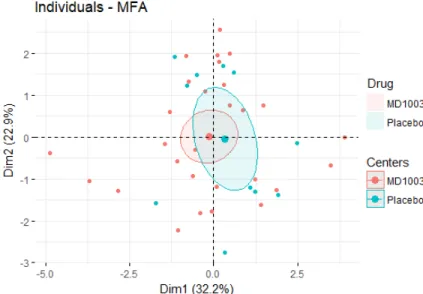
The individuals representation shown in, Fig. 4, does not seem to show two distinct groups. Indeed, the confidence ellipses associated to the two groups MD1003 and Placebo overlap, meaning that the two groups are relatively similar.
In Fig 3, we observe that the coordinates of the 3 active groups (M00, M12 and M24) on the 1st, 2nd and 3rd dimen-sion are almost identical, they contribute similarly to the PCs. Unlike ’Drug’ , the supplementary group doesn’t contribute to the building of MFA PCs because its coordinates are very close to the origin of axes indicating little or no contribution to the MFA.
The RV coefficient allows to perform a correlation between matrix or tables. It can be interpreted as a generalization of the squared correlation from two single variables to two sets of variables [28].
The table III shows that the active groups (M00, M12 and M24) are strongly correlated to each other (RV > 0.75) and to the MFA (RV > 0.9). On the contrary, the supplementary group ’Drug’ is poorly correlated to the active groups and to the MFA (RV < 0.05), which in one hand means that the information contained in the tables (i.e. active groups) are very similar and in another hand, it’s re-emphasizes the low contribution of the ’Drug’ group.
C. Evaluation of the Hierarchical Clustering on Principal component
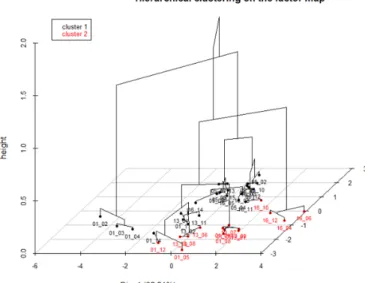
Hierarchical Clustering was performed using Wards crite-rion on the 3 first principal components of the MFA. A number of 2 clusters was fixed to match the number of patients groups (MD1003 or Placebo). The euclidean distance is the metric chosen. The HCPC result is represented in the 3D dendrogram in Fig. 5.
The clustering evaluation consist on measuring clustering quality. Rand Index is the criterion used to evaluate HCPC
Fig. 3: MFA groups representation. M00, M12 and M24 are the MFA groups. ’Drug’ is a supplementary group.
Fig. 4: MFA individuals plot. Individuals (patients) are pre-sented as points on the scatter plot created with the first two main dimensions of MFA. Each individual is colored following their ’Drug’ group (Placebo or MD1003). The ellipses are 95% confidence ellipses around ’Drug’ group mean points.
outcomes. In our case, RI = 0.50. The two groups, MD1003 and Placebo are not successfully separated. The HCPC pro-vided a validation of an observation made during the study of the MFA: The MD1003 group is similar to the Placebo group.
V. DISCUSSION
The Multiple Factor Analysis results, based on the combina-tion of MRI biomarkers quantiles, allows in one hand to study the relation between the patients receiving the tested drug and the ones that received the placebo and in another hand to evaluate the evolution over time. Indeed, as presented in the result, the MFA individuals chart shows that the confidence ellipses of the MD1003 and placebo groups overlap which attests that these groups are similar, this conclusion joins the conclusion establish in the individual analysis of the biomark-ers. Furthermore, the Hierarchical clustering on PCs failed to separate MD1003 patients and Placebo patients. Thus, we can conclude that based on those MRI biomarkers (i.e. CTh, FA, ADC and MTR), the tested drug doesn’t seem to have an effect on progressive MS. Regarding the progression over time, the TABLE III: RV coefficients between the groups (active and supplementary) and the MFA
Drug M00 M12 M24 MFA Drug 1.0 0.03 0.04 0.04 0.04 M00 0.03 1.0 0.79 0.84 0.94 M12 0.04 0.79 1.0 0.82 0.92 M24 0.04 0.84 0.82 1.0 0.94 MFA 0.04 0.94 0.92 0.94 1.0
Fig. 5: 3D dendrogram of the HCPC induces by the 3 first PCs. 2 Clusters are represented
MFA groups (M00, M12 and M24) representation and the RV coefficients showed that the active groups are highly correlated to each others(RV > 0.75), which means that there are no changes and evolution over time whether it’s in MD1003 group or in Placebo group, indeed the supplementary group ’Drug’ is not correlated to the active groups and its coordinates in the MFA groups representation are close to the origin of axes.
A previous study [29] was also interested in the contribution of MD1003 treatment in progressive MS based on MRI biomarkers. This study shows that MD1003 was associated with a decrease in whole brain volume and gray matter volume. The effects of MD1003 on volumetric measures may be due to a pseudo-atrophy phenomenon. In our study, no significant differences between MD1003 patients and Placebo patients has been observed when it comes to their cortical thickness, that could be explained by the fact that the patients included in this clinical trial have the progressive form of MS and are already in an advanced stage of the disease and thus it would have been unexpected to observe cerebral atrophy in two years of follow-up. Surprisingly, we didn’t observe significant changes between the two groups in their MTR measures (i.e. Myelin biomarker). Indeed, we expected a significant increasing in MTR measures in the MD1003 group since MD1003 is supposed to trigger energy production in demyelinated axons, enhance myelin synthesis and therefore lead to remyelination. In addition, we didn’t observe a decrease of the ADC and an increase of the FA in the MD1003 group, which could have also indicate a possible remyelination. The fact that there is no significant differences between placebo and MD1003 patients and no changes over time, doesn’t necessarily mean that the drug has no effect on the progressive MS in general. Indeed, our study is limited to MRI biomarkers, and to have a more complete study and to take into account the clinical aspect of the disease, it
would be interesting to combine MRI biomarkers and clinical markers such as EDSS and TK25FW. In addition, despite the fact that whole brain histogram-analysis of biomarkers is quite sensitive to subtle change and for the detection of heterogeneous abnormality, we could refine the study even more by focusing not only on whole brain-histograms but also on the histograms of the gray matter and white matter. Indeed, [30] [31] suggest that MTR of normal appearing white matter using histogram analysis demonstrates abnormality in the brain where whole-brain MTR histogram-analysis has failed.
The aim of this study was to present a method that can combine MRI biomarkers based on biomarkers histogram-analysis instead of a single central tendency measures (e.g. the mean). Since, this drug doesn’t seem to have the ability to separate the treated group from the Placebo group based on these 4 MRI biomarkers, it would be interesting in a future study to work on a dataset that have clearly distinct groups (e.g. sick and healthy subjects) to quantify the superiority of our method and to do so, we would compare the clustering or classification performances in the two cases: Before combining the biomarkers and after applying our combined biomarker approach described in this paper.
VI. CONCLUSION
This paper proposes a method for combining multiple MRI biomarkers from various MRI modalities in the context of clinical trials. To respond to the question: Does the treatment used in the clinical trial have a positive effect on the treated disease. It is important to be as specific as possible by extracting a good amount of information from the biomarkers. To do so, we performed a histogram analysis as opposed to most studies that limit their work by using a single central tendency measure (e.g. the mean). The next step was to use a Multiple Factor Analysis (MFA) to combine the biomarkers in a way to maximize the variability of the data. The MFA charts give an idea of the effect of treatment on the disease, but it’s the Hierarchical Clustering performed on the principal components (i.e. linear combinations of the biomarkers) that provides the final answer to the initial question.
This method is a promising approach, which provides more information than traditional analyses such as individual analysis of the biomarkers. Thus, this approach should find its place in the range of methods used to evaluate the efficacy of a treatment in a clinical trial.
ACKNOWLEDGMENT
This work was supported by the Fondation pour la Recherche Medicale (FRM grant number ECO20160736068 to S.R). The authors would like to thank MedDay Pharmaceu-ticals for sharing their data.
REFERENCES
[1] B. D. Trapp, J. Peterson, R. M. Ransohoff, R. Rudick, S. Mrk, and L. B, Axonal transection in the lesions of multiple sclerosis, N. Engl. J. Med., vol. 338, no. 5, pp. 278285, Jan. 1998.
[2] A. E. Miller and R. W. Rhoades, Treatment of relapsing-remitting multiple sclerosis: current approaches and unmet needs, Curr. Opin. Neurol., vol. 25 Suppl, pp. S4-10, Feb. 2012.
[3] F. De Angelis, D. Plantone, and J. Chataway, Pharmacotherapy in Secondary Progressive Multiple Sclerosis: An Overview, CNS Drugs, vol. 32, no. 6, pp. 499526, Jun. 2018.
[4] J. Q. Su and J. S. Liu, Linear Combinations of Multiple Diagnostic Markers, Journal of the American Statistical Association, vol. 88, no. 424, pp. 13501355, 1993.
[5] M. S. Pepe and M. L. Thompson, Combining diagnostic test results to increase accuracy, Biostatistics, vol. 1, no. 2, pp. 123140, Jun. 2000. [6] C. Liu, A. Liu, and S. Halabi, A min-max combination of biomarkers to
improve diagnostic accuracy, Stat Med, vol. 30, no. 16, pp. 20052014, Jul. 2011.
[7] L. Kang, A. Liu, and L. Tian, Linear combination methods to improve diagnostic/prognostic accuracy on future observations, Stat Methods Med Res, vol. 25, no. 4, pp. 13591380, 2016.
[8] J. Yin and L. Tian, Optimal linear combinations of multiple diagnostic biomarkers based on Youden index, Stat Med, vol. 33, no. 8, pp. 14261440, Apr. 2014.
[9] I. Kouskoumvekaki, Z. Yang, S. O. Jnsdttir, L. Olsson, and G. Panagiotou, Identification of biomarkers for genotyping Aspergilli using non-linear methods for clustering and classification, BMC Bioinformatics, vol. 9, p. 59, Jan. 2008.
[10] Y. Huang and Y. Fong, Identifying optimal biomarker combinations for treatment selection via a robust kernel method, Biometrics, vol. 70, no. 4, pp. 891901, Dec. 2014.
[11] T. Xu, Y. Fang, A. Rong, and J. Wang, Flexible combination of multiple diagnostic biomarkers to improve diagnostic accuracy, BMC Med Res Methodol, vol. 15, Oct. 2015.
[12] M. D. Steenwijk et al., Cortical atrophy patterns in multiple sclerosis are non-random and clinically relevant, Brain, vol. 139, no. 1, pp. 115126, Dec. 2015.
[13] K. Schmierer, F. Scaravilli, D. R. Altmann, G. J. Barker, and D. H. Miller, Magnetization transfer ratio and myelin in postmortem multiple sclerosis brain, Ann. Neurol., vol. 56, no. 3, pp. 407415, Sep. 2004. [14] M. Cercignani, G. Iannucci, and M. Filippi, Diffusion-weighted imaging
in multiple sclerosis, Ital J Neurol Sci, vol. 20, no. 5 Suppl, pp. S246-249, 1999.
[15] M. Rovaris et al., Diffusion MRI in multiple sclerosis, Neurology, vol. 65, no. 10, pp. 15261532, Nov. 2005.
[16] P. S. Tofts, G. R. Davies, and J. Dehmeshki, Histograms: Measuring Sub-tle Diffuse Disease, in Quantitative MRI of the Brain, Wiley-Blackwell, 2004, pp. 581610.
[17] J. Dehmeshki, A. C. Ruto, S. Arridge, N. C. Silver, D. H. Miller, and P. S. Tofts, Analysis of MTR histograms in multiple sclerosis using principal components and multiple discriminant analysis, Magn Reson Med, vol. 46, no. 3, pp. 600609, Sep. 2001.
[18] J. Dehmeshki, N. C. Silver, S. M. Leary, P. S. Tofts, A. J. Thompson, and D. H. Miller, Magnetisation transfer ratio histogram analysis of primary progressive and other multiple sclerosis subgroups, Journal of the Neurological Sciences, vol. 185, no. 1, pp. 1117, Mar. 2001. [19] L. Peyro Saint Paul, D. Debruyne, D. Bernard, D. M. Mock, and G. L.
Defer, Pharmacokinetics and pharmacodynamics of MD1003 (high-dose biotin) in the treatment of progressive multiple sclerosis, Expert Opin Drug Metab Toxicol, vol. 12, no. 3, pp. 327344, 2016.
[20] F. Sedel et al., High doses of biotin in chronic progressive multiple sclerosis: a pilot study, Mult Scler Relat Disord, vol. 4, no. 2, pp. 159169, Mar. 2015.
[21] A. Tourbah et al., MD1003 (high-dose biotin) for the treatment of progressive multiple sclerosis: A randomised, double-blind, placebo-controlled study, Multiple Sclerosis Journal, vol. 22, no. 13, pp. 17191731, Sep. 2016.
[22] O. Querbes et al., Early diagnosis of Alzheimers disease using cortical thickness: impact of cognitive reserve, Brain, vol. 132, no. Pt 8, pp. 20362047, Aug. 2009.
[23] S. E. Jones, B. R. Buchbinder, and I. Aharon, Three-dimensional mapping of cortical thickness using Laplaces equation, Hum Brain Mapp, vol. 11, no. 1, pp. 1232, Sep. 2000.
[24] N. Toussaint, J.-C. Souplet, and P. Fillard, MedINRIA: Medical Image Navigation and Research Tool by INRIA, presented at the Proc. of MICCAI07 Workshop on Interaction in medical image analysis and visualization, 2007.
[25] H. Abdi, L. J. Williams, and D. Valentin, Multiple factor analysis: principal component analysis for multitable and multiblock data sets, Wiley Interdisciplinary Reviews: Computational Statistics, vol. 5, no. 2, pp. 149179, 2013.
[26] F. Husson, J. Josse, and J. Pags, Principal component methods-hierarchical clustering-partitional clustering : why would we need to choose for visualizing data ?, 2010.
[27] O. Arbelaitz, I. Gurrutxaga, J. Muguerza, J. M. Prez, and I. Perona, An extensive comparative study of cluster validity indices, Pattern Recogni-tion, vol. 46, no. 1, pp. 243256, Jan. 2013.
[28] P. Robert and Y. Escoufier, A Unifying Tool for Linear Multivariate Statistical Methods: The RV- Coefficient, Applied Statistics, vol. 25, no. 3, p. 257, 1976.
[29] D. Arnold, MD1003 in progressive multiple sclerosis: 24-month brain MRI results of the MSSPI trial, presented at the 7th Joint ECTRIMS -ACTRIMS Meeting, Paris, 26-Oct-2017.
[30] G. Iannucci, L. Minicucci, M. Rodegher, M. P. Sormani, G. Comi, and M. Filippi, Correlations between clinical and MRI involvement in multiple sclerosis: assessment using T1, T2 and MT histograms, Journal of the Neurological Sciences, vol. 171, no. 2, pp. 121129, Dec. 1999. [31] G. Iannucci, C. Tortorella, M. Rovaris, M. P. Sormani, G. Comi, and
M. Filippi, Prognostic Value of MR and Magnetization Transfer Imaging Findings in Patients withClinically Isolated Syndromes Suggestive of-Multiple Sclerosis at Presentation, American Journal of Neuroradiology, vol. 21, no. 6, pp. 10341038, Jun. 2000.