HAL Id: hal-00871859
https://hal.archives-ouvertes.fr/hal-00871859
Submitted on 10 Oct 2013
HAL is a multi-disciplinary open access
archive for the deposit and dissemination of
sci-entific research documents, whether they are
pub-lished or not. The documents may come from
teaching and research institutions in France or
abroad, or from public or private research centers.
L’archive ouverte pluridisciplinaire HAL, est
destinée au dépôt et à la diffusion de documents
scientifiques de niveau recherche, publiés ou non,
émanant des établissements d’enseignement et de
recherche français ou étrangers, des laboratoires
publics ou privés.
in the Bivalve Macoma balthica: Marker Development
for Evolutionary Studies
Eric Pante, Audrey Rohfritsch, Vanessa Becquet, Khalid Belkhir, Nicolas
Bierne, Pascale Garcia
To cite this version:
Eric Pante, Audrey Rohfritsch, Vanessa Becquet, Khalid Belkhir, Nicolas Bierne, et al.. SNP Detection
from De Novo Transcriptome Sequencing in the Bivalve Macoma balthica: Marker Development for
Evolutionary Studies. PLoS ONE, Public Library of Science, 2012, 7 (12), pp.e52302.
�10.1371/jour-nal.pone.0052302�. �hal-00871859�
SNP Detection from
De Novo
Transcriptome Sequencing
in the Bivalve
Macoma balthica
: Marker Development for
Evolutionary Studies
Eric Pante1*., Audrey Rohfritsch1., Vanessa Becquet1, Khalid Belkhir2, Nicolas Bierne3, Pascale Garcia1
1 Littoral, Environnement et Socie´te´s Joint Research Unit 7266 Centre national de la recherche scientifique, Universite´ de La Rochelle, La Rochelle, France, 2 Joint Research Unit 5554, Institut des Sciences de l’Entreprise et du Management, Universite´ Montpellier II, Montpellier, France,3 Joint Research Unit 5554aˆ, Institut des Sciences de l’Entreprise et du Management, Universite´ Montpellier II, Station Me´diterrane´enne de l’Environnement Littoral, Montpellier, France
Abstract
Hybrid zones are noteworthy systems for the study of environmental adaptation to fast-changing environments, as they constitute reservoirs of polymorphism and are key to the maintenance of biodiversity. They can move in relation to climate fluctuations, as temperature can affect both selection and migration, or remain trapped by environmental and physical barriers. There is therefore a very strong incentive to study the dynamics of hybrid zones subjected to climate variations. The infaunal bivalve Macoma balthica emerges as a noteworthy model species, as divergent lineages hybridize, and its native NE Atlantic range is currently contracting to the North. To investigate the dynamics and functioning of hybrid zones in M. balthica, we developed new molecular markers by sequencing the collective transcriptome of 30 individuals. Ten individuals were pooled for each of the three populations sampled at the margins of two hybrid zones. A single 454 run generated 277 Mb from which 17K SNPs were detected. SNP density averaged 1 polymorphic site every 14 to 19 bases, for mitochondrial and nuclear loci, respectively. An F ST scan detected high genetic divergence among several hundred SNPs, some of them involved in energetic metabolism, cellular respiration and physiological stress. The high population differentiation, recorded for nuclear-encoded ATP synthase and NADH dehydrogenase as well as most mitochondrial loci, suggests cytonuclear genetic incompatibilities. Results from this study will help pave the way to a high-resolution study of hybrid zone dynamics in M. balthica, and the relative importance of endogenous and exogenous barriers to gene flow in this system.
Citation: Pante E, Rohfritsch A, Becquet V, Belkhir K, Bierne N, et al. (2012) SNP Detection from De Novo Transcriptome Sequencing in the Bivalve Macoma balthica: Marker Development for Evolutionary Studies. PLoS ONE 7(12): e52302. doi:10.1371/journal.pone.0052302
Editor: Bas E. Dutilh, Radboud University Medical Centre, NCMLS, The Netherlands Received July 25, 2012; Accepted November 16, 2012; Published December 26, 2012
Copyright: ß 2012 Pante et al. This is an open-access article distributed under the terms of the Creative Commons Attribution License, which permits unrestricted use, distribution, and reproduction in any medium, provided the original author and source are credited.
Funding: The University of La Rochelle computing infrastructure \YMIR’’ was partly funded by the European Union (contract 31031-2008, European Regional Development Fund). This work was funded by the Agence Nationale de la Recherche (Hi-Flo project ANR-08-BLAN-0334-01); salaries for AR and EP were covered by a grant to the Poitou-Charente region (Contrat de Projet Etat-Region 2007-2013). The funders had no role in study design, data collection and analysis, decision to publish, or preparation of the manuscript.
Competing Interests: The authors have declared that no competing interests exist. * E-mail: pante.eric@gmail.com
.These authors contributed equally to this work.
Introduction
Understanding the adaptation of organisms to their environ-ment is becoming a pressing matter, in the face of today’s anthropogenic pressures and rapid climate change (e.g. [1]). In response to elevated temperatures, the range of many terrestrial and marine species has shifted toward cooler zones (higher latitudes, altitudes, or deeper waters), leading to profound modifications in biogeographic, ecological, and evolutionary patterns [2–4].
In this context, hybrid zones are of particular interest, as they are an important component of both animal and plant systems, represent a key process in the maintenance of biodiversity, and sit at the very core of the process of speciation (e.g. [5] and the FroSpects workshop on hybridization and speciation 2012). Because climate can affect both selection (by the differential survival of cold-adapted and heat-adapted genotypes) and connectivity (by influencing, for example, the number of migrants produced), hybrid zones can move in response to climate change
(e.g. [6,7]). On the other hand, hybrid zones are expected to be efficiently trapped by exogenous factors such as natural barriers to gene flow [8] or environmental boundaries unrelated to climate. There is therefore a very strong incentive to study the mechanisms involved in the dynamics of hybrid zones subjected to climate change.
Macoma balthica, an infaunal tellinid bivalve from marine and estuarine soft-bottom habitats of the northern hemisphere, is a particularly well suited model system to study the response of marine hybrid zones to changing environmental conditions. The natural range of M. balthica is currently contracting poleward [9,10], in parallel with increasing sea surface temperatures in the Bay of Biscay (NE Atlantic; [11]). Previously found along the Atlantic side of Spain, the southern species boundary has shifted over 600 km north, to the Gironde Estuary (France) during the last 40 years. As M. balthica is a major element in the diet of several migratory bird, macro-invertebrates and fish [12–15], its disap-pearance from European coasts may lead to profound ecosystemic alterations. A putative hybrid zone was recently detected among
southern European populations of M. balthica [16], raising the question of the evolutionary equilibrium of meridional M. balthica populations. Whether this zone is moving northward in response to climate change is unclear, as it could be trapped by natural barriers to gene flow such as a the Brittany peninsula (e.g. [17,18]). Also, the northern lineage of M. balthica could benefit from warm-adapted alleles from the southern lineage through introgressive hybridization.
Next-generation sequencing technologies have recently cata-lyzed genome-wide studies of population differentiation, local adaptation and hybridization on non-model organisms (reviewed in [19–21]). In particular, transcriptome-wide sequencing was shown to be an effective way to obtain a large number of co-dominant genetic markers, even when no reference genome is available (e.g. [22–25]).
In this communication, we present results of a transcriptome-wide scan for single nucleotide polymorphisms (SNPs) with the 454 technology [26], performed in preparation for a large-scale study of the maintenance and dynamics of hybrid zones in the context of global climate change. This preliminary scan for genetic markers of adaptive differentiation (1) provides data on the polymorphism of M. balthica, (2) outlines loci putatively affected by selection, and (3) offers ground for discussing cytonuclear disequilibrium among M. balthica populations.
Results
Assembly Statistics
A total of 871,962 sequences were obtained with one 454 GS FLX Titanium run, representing 277 Mbases. Only 4,303 contigs (1,991, 1,389 and 923 for Aytre´, Gdansk and Somme respectively) were retained after assembly and removal of singletons and repetitive regions (Figure 1). Contig length ranged from 43 bp to 4,541 bp with a median of 513 bp. Distribution of average qualities was right-skewed with a peak score at 37. GC content varies from 21.3% to 73.8% with a median of 35.4%. Quality filtering based on contigs size ($400 bp) and base call quality ($42) significantly improved average contig quality and stabilized GC content (Figure 2). After the step of clustering and reciprocal blast, the remaining 1,714 contigs (1.96 Mbases) were used as reference genome for mapping and SNP calling. Medians of contig length, average quality and GC content were 1,061 bp, 63 and 42.8%, respectively.
Contig Identification and Functional Annotation
Of 1,714 reference contigs, 856 returned a blast hit, and, from these, 512 were associated to a Gene Ontology term. The species that returned the most of top blast hits was Branchiostoma floridae, a cephalochordate of the Branchiostomidae family. Among the top ten best-hit species, four mollusks were detected, including three bivalves (Ruditapes, Mytilus, and Crassostrea; Figure 3). A more thorough characterization of the transcriptome is ongoing. Eight contigs (cumulative size of 10,467 bp) were retained as sequences of mitochondrial origin, matching the following genes: cytb, nad2, nad4, nad5, cox1, cox3 and 16S (Sanger-sequencing validation of the homology of these contigs for mitochondrial genes is ongoing).
Only sequences from the mitochondrial cox1 and cox3 genes are currently available for M. balthica on GenBank. Reads mapped on two contigs (A_c14306 and G_c395, corresponding to cox1 and cox3, respectively) were used to build three consensus sequences corresponding to the three sampled populations. For cox1, consensuses were close to known haplotypes published in Luttikhuizen et al. [27,28] and Nikula et al. [29]. The consensus from the Aytre´ and Somme populations closely matched Nikula’s
haplotype 37 (M. balthica rubra b1 clade; GenBank accession n. EF044130) and Luttikhuizen’s haplotype e (AF443220) [27], while sequences from the Gdansk population closely matched Lutti-khuizen’s haplotype O (AY62262) from the Baltic Sea [28]. Similarly, for cox3, all three consensus sequences exactly matched a known M. balthica cox3 haplotype published in [29]. The Aytre´ population matched Nikula’s haplotype 37 (EF044099), belonging to the M. balthica rubra clade b1 (previously sampled from the Bay of Biscay); the Somme population matched haplotype 34 (EF044096) belonging to the same clade b1; the Gdansk population matched haplotype 16 (EF044078), belonging to the M. balthica balthica clade d2 (previously sampled from the Baltic Sea).
Polymorphism Detection and Statistics
Of the 567,467 cleaned read sequences, 416,330 were mapped on reference contigs, and 54,606 putative SNPs were identified (1,103 and 53,503 for mitochondrial and nuclear contigs, respectively). Only SNPs characterized by a depth of coverage $10 in each population and a mean Minor Allele Frequency (MAF) $5% were considered in further analyses. Only 623 (mitochondrial) and 17,328 (nuclear) SNPs met these criteria. These high-quality SNPs were detected from 441 nuclear and 6 mitochondrial contigs. A high level of polymorphism was observed for the two compartments with 1 SNP every 19 bases for nuclear genes (i.e. 52.8 SNPs/kb) and 1 SNP every 14 bases for mitochondrial genes (i.e. 71.15 SNPs/kb). Transition:transversion
Figure 1. Summary of assembly, trimming and quality filtering of raw 454 sequence data.
ratios for these mutations were 1.22:1 and 2.75:1 for nuclear and mitochondrial contigs, respectively (Figure 4).
Genetic Diversity and Population Differentiation
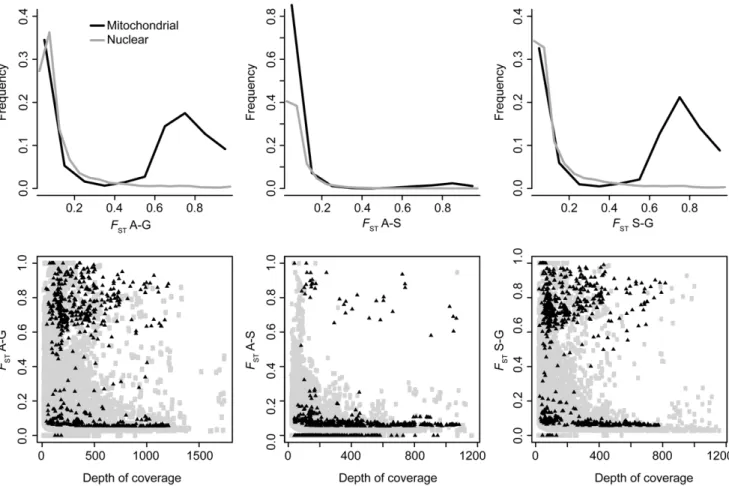
Average mitochondrial gene diversity (6SE) was 0.006560.0080, 0.013760.0083 and 0.004260.0049 for the Aytre´, Gdansk and Somme populations respectively. Nuclear gene diversity was 0.014560.02, 0.015960.0189, and 0.014160.0192 for the Aytre´, Gdansk and Somme samples. For nuclear loci, pairwise F ST distributions were unimodal for all pairwise comparisons. Levels of genetic differentiation were low,
with a median between 0.057 (Somme) and 0.071 for Aytre´-Gdansk. However, a few loci with high F ST values were observed across all pairs (Figure 5). Indeed, maximum F ST values were 1 for all pairs.
For mitochondrial loci, distributions of F ST were bimodal especially in pairs with Gdansk, as expected knowing mitochon-drial genealogies [27–29]. Medians of pairwise F ST were 0.060, 0.665 and 0.644 for Aytre´/Somme, Somme/Gdansk and Aytre´/ Gdansk respectively (Figure 5). Maximum F ST values reached 1 for all pairs of populations. We further characterized genetic variation at cox1 and cox3, for comparison with previous studies
Figure 2. Effect of data quality filtering on contig length, average quality, and GC content. Solid line: all contigs after removal of singletons and repetitive regions; black dashed line: contigs with high-quality SNPs; blue dashed line: reference contigs.
doi:10.1371/journal.pone.0052302.g002
Figure 3. Species identification of the best blast searches. Results shown for the first 20 species identified, based on the 1,714 reference contigs.
doi:10.1371/journal.pone.0052302.g003
[27–29]. Twelve diagnostic mutations were detected between the M. balthica balthica and M. balthica rubra lineages. Alleles corresponding to the M. balthica rubra lineage were nearly fixed within the Aytre´ and Somme populations (median frequency of 1.00), and rare with the Gdansk sample (allele frequency ranging from 0.005 to 0.104; median of 0.045). Twenty-two mutations separate the two lineages at cox3 [29]. Except for 2 loci, alleles diagnostic of the M. balthica rubra lineage were nearly fixed within the Aytre´ and Somme populations (median frequencies of 1.00), and rare at Gdansk (frequencies ranging form 0.15 to 0.20; median of 0.16), except for one locus, which frequency reached 0.44 in the Gdansk sample.
Outlier Detection
Out of 17,328 high-quality SNPs, 463 (2.7%) were identified as statistical outliers in our analyses involving all populations (i.e. loci in common between three independent BayeScan runs on the A-G-S set, in which 475, 477 and 478 outliers were detected). These outliers were clustered on 53 contigs, 28 of which could be
identified using blast (Table S1). Eight contigs contained SNPs differentially fixed between population (i.e. FST = 1), five of which
returning a blast hit (Cyclophilin A, Myosinase I and II, Tropomyosine and vdg3). Three contigs were involved in ATP transport and synthesis. Six contigs (including the ATP synthase gamma subunit) contained SNPs corresponding to high FSTvalues
for all three population pairs. One contig, corresponding to the Cyclin b gene (A_c226), was characterized by highly-differentiated SNPs for the Aytre´-Somme population pair only. When popula-tion pairs were analyzed independently using BayeScan, 25 additional outliers were detected (24 from the A-S population pair, and 1 from the A-G and G-S pairs; Figure 6). These outliers were located on four contigs (two of which identified by blast as coding for the ATP synthase subunit alpha and Calmodulin) not involved in the outlier detection performed on the A-G-S set. 294 out of 463 outliers (63.5%) were only detected using the A-G-S set. The proportion of SNPs putatively under selection therefore varies between 1% (using population pairs only) and 2.8% (combining the results of all analysis sets). The relatively low proportion of overlap between analyses of the full set (A-G-S) and population pairs may be explained by the statistical power gained from using 30 individuals (A-G-S set) instead of 20 (population pair sets), by a higher false discovery rate in the A-G-S set [30], or a combination of both.
Discussion
Assembly and Polymorphism Detection
Three non-normalized cDNA libraries of pooled individuals allowed us to sequence 277 Mb of the transcriptome of M. balthica. The 454 technology is powerful in non model species for which little knowledge of the genome is available, and allowed us to produce contigs up to 4 kbp with a mean coverage close to 3x. Using larger contigs increased the number and accuracy of blast results and stabilized overall GC content, therefore decreasing the risk of analyzing contaminating DNA sequences. Indeed, almost half of the 1,714 reference contigs returned a blast hit with an e-value,1e210 and 512 sequences were associated to a Gene Ontology term. These numbers are on par with previously-reported annotation success rates in mollusks [31–33], and reflect that the transcriptomics of this group are still poorly known. Results from blast searches did not provide any evidence of contamination by microalgae or bacteria. Most blast searches returned subject sequences corresponding to the cephalochordate Branchiostoma floridae, which complete genome was recently sequenced [34]. Additionally, top blast hits corresponded mainly to marine invertebrate species, including several bivalves.
Technique Validation
The retrieval of documented mitochondrial haplotypes for the cox1 and cox3 genes allowed us to validate our methodology. For these two genes, haplotypes clustered in the expected mitochon-drial clades (M. balthica rubra for Aytre´ and Somme populations and M. balthica balthica for Gdansk individuals), confirming that our quality filters seem to be appropriate. While comparing population consensuses to known M. balthica haplotypes, we also detected pseudogenes that would have otherwise been overlooked, as they were little divergent from orthologous sequences and contained few stop codons. This emphasizes the paramount importance of having a reference genome to which anonymous sequences can be compared, and warns that our sorting of mitochondrial and nuclear contigs is a mere hypothesis that remains to be fully tested. Nevertheless, putative mitochondrial contigs showed similar characteristics (relatively-high depth of coverage and high FST
Figure 4. Frequency of transversions and transitions among high-quality mitochondrial and nuclear SNPs. Statistical outliers (values $1.56 the interquartile range) are omitted.
values). Interestingly, several contigs characterized as putative mitochondrial pseudogenes were detected as FST outliers,
suggesting that either these pseudogenes were translocated into the nuclear genome after differentiation of mitochondrial loci (and the signature of population differentiation has not yet been diluted by drift), or that these pseudogenes are still under the influence of selection (e.g. [35]).
Polyadenylation of Mitochondrial mRNAs
We used the Mint cDNA Synthesis Kit to produce our cDNA libraries. This kit uses adapters that anneal to the poly(A) of mRNA to initiate reverse transcription. The presence of poly(A) tails on mitochondrial mRNA molecules is therefore required for their processing into cDNA. The occurrence and role of polyadenylated mitochondrial mRNA is, however, highly variable among organisms [36,37]. For example, this feature is completely absent in yeast [38], and triggers mRNA degradation in plants (e.g. [39]). Knowing whether mitochondrial mRNAs possess poly(A) tails is therefore paramount to properly annotating our contigs. Indeed, in the absence of poly(A) tails on mitochondrial mRNA, all contigs with high similarity with mt sequences must be nuclear pseudogenes (see [40] for a review of the prevalence of pseudogenes of mitochondrial origin in the nuclear genome). While data on mRNA polyadenylation is scant in non-model organisms [36], this mechanism has been hypothesized for some mitochondrial genes in the bellybutton nautilus [41] and the gastropod Biomphalaria glabrata [42,43], based on the presence of incomplete stop codons. Focusing on the periwinkle Littorina
Figure 5. Pairwise FSTdistributions.Top panel: frequency of FSTvalues for each pair of population. Bottom panel: relationship between depth
of coverage and FSTvalues. On both panels, nuclear and mitochondrial loci are represented in grey and black, respectively.
doi:10.1371/journal.pone.0052302.g005
Figure 6. Venn diagram showing the intersect between the four outlier detection analyses. Each ellipse represents the consensus of three independent runs of BayeScan, for the three population pairs (A-G, A-S, G-S), and all populations (A-G-S). Numbers correspond to the total number of outlier SNPs (left of slash) and corresponding contigs (right of slash) for each analysis.
doi:10.1371/journal.pone.0052302.g006
saxatilis, Galindo et al. [44,45] reported population differentiation data at NADH-like genes, based on 454 sequencing of pooled cDNA library produced using poly(A)+mRNA. While NADH genes are mitochondria-encoded, the authors recognized that their contigs could potentially be pseudogenes. The contigs that we selected as putative mitochondrial sequences have a homoge-neously high depth of coverage (average .40 read/locus), and were characterized by similar differentiation profiles (FSTscan and
Figure 5). Finally, we were able to match cox1 and cox3 sequences to known haplotypes produced by Sanger sequencing [27–29]. We therefore conclude that M. balthica is likely to feature polyadenyl-ation of mitochondrial mRNAs in at least two genes.
Extreme SNP Density
Simultaneous sequencing of individual pools is an economic alternative to the sequencing of individual genomes [46]. Although haplotype information is not retained if specimens are not individually tagged, it is possible to calculate reliable estimates of allele frequencies based on sampling effort, and therefore infer genetic diversity and population differentiation statistics [46,47].
A major outcome of this study is the large SNP density recorded among three populations of M. balthica (1 SNP every 14 to 19 bp, for mitochondrial and nuclear loci, respectively). Sauvage et al. [48] recorded an average of one SNP every 60 nt in coding regions (1 SNP/40 nt in non-coding regions) in the Pacific oyster Crassostrea gigas, and concluded that the high prevalence of polymorphisms in this species was among the highest in the animal kingdom (other hyper-diverse taxa counting the nematode Caenorhabditis remanei [49]; the ascidian Ciona savignyi [50]; and Drosophila [51]). Comparisons of polymorphism density between Macoma and Crassostrea must, however, be done with care, as our study involved two sub-species characterized by three distinct mitochondrial lineages, while the 24 individuals used in Sauvage et al. where closely related (siblings and parent-offspring; [52]). These results therefore add to the existing view that bivalves might be champions of genetic diversity among animals (e.g. [48,53]).
Genome Scan for Population Differentiation and Cytonuclear Disequilibrium
2.7% of the tested nuclear loci were detected as outliers, based on a FDR of 5% and considering all three populations (A-G-S set). This number increased to 3.1% when the FDR was set to 10%. A review of 18 papers on AFLP-based genome scans showed substantial, but not extreme variation in the proportion of outliers, with a range from 0.4 to 24.5% and a mean of 8.5% [54]. A recent study of selection across the genome of M. balthica reported that 19% (using a coalescent approach, [55]) to 37% (using cline analysis, [56]) of 84 AFLP loci were under the influence of selection (only 3.6% of markers were detected by both methods) [57]. Genome scans based on SNPs revealed estimates of 7.5% in mice (Mus musculus, whole genome, [58]), 7–12% in the periwinkle (Littorina saxatilis, transcriptome, [45]), 1.4–3.6% in the Atlantic salmon (Salmo salar, expressed sequence tags, [59]), and 12% in the waterflea (Daphnia magna, expressed sequence tags, [60]). Addi-tional estimates, within this range, were recently compiled by Orsini et al. [60]. The proportion of the transcriptome putatively under selection is therefore within the range of currently available estimates, although on its lower end.
Most recent studies aiming at detecting loci under divergent selection based on FST scans focus their interpretations of high
population differentiation on ‘‘genetic-environment associations’’ that imply exogenous barriers to gene flow and local adaptation ([61] and references therein). Here, we detected loci associated with energetic metabolism, cellular respiration, and physiological
stress (e.g. ATP synthesis genes, a heat shock protein, an immunosuppressant [cyclophilin A], and metalloproteases [myo-sinase I and II]), a result consistent with the fact that one population was sampled at the southern limit of the species range, and another was collected from heavily-polluted waters. It may therefore be tempting to conclude that a significant proportion of loci putatively under selection bear the molecular signature of local adaptation. Such loci are, however, expected to be rare at the scale of the entire genome and therefore very hard to pinpoint (e.g. [47,62]). Genetic incompabilities such as Dobzhansky-Muller interactions, on the other hand, may form when previously-separated populations come into secondary contact, and generate endogenous barriers to gene flow. Endogenous barriers are at least as likely as exogenous ones, and may therefore explain a significant proportion of the highly-differentiated loci that we have detected [61].
An interesting outcome of our study was the high FST values
recorded for the nuclear-encoded alpha, gamma and O subunits of the ATP synthase protein, an ATP/ADP transporter, and the second isoform of the nuclear NADH dehydrogenase, all of which being involved in electron transport and ATP synthesis at the mitochondrial membrane. The ATP synthase and NADH dehydrogenase genes contribute to the assembly of mitochondrial membrane proteins, which requires both nuclear- and mitochon-drial-encoded units (e.g. [63]). As most SNPs detected for mitochondrial loci are characterized by high FST values between
population pairs, the detection of nuclear genes involved in the electron transport system as FST outliers strongly suggests
cyto-nuclear incompatibilities (Dobzhansky-Muller incompatibilities between mitochondrial- and nuclear-encoded proteins), an endogenous barrier to gene flow symptomatic of hybridizing lineages (e.g. [64–70]). The hypothesis that genetic incompatibil-ities contribute to population differentiation in M. balthica is consistent with the complex colonization history of this species in the Atlantic [16,29,71–73]. Indeed, the last few million years have seen multiple colonization of Pacific M. balthica into Atlantic waters through the Bering Strait, leading to secondary contact between divergent lineages and extensive hybridization.
While describing the genetic structure of M. balthica populations in the Baltic, White and Barents Seas, Strelkov et al. [73] and Nikula et al. [72] statistically tested for evidence of cytonuclear disequilibrium among mitochondrial (cox3) and nuclear (10 allozyme loci) markers, but did not detect any. This genome-wide scan for genetic differentiation therefore provides the first signal of cytonuclear disequilibrium in M. balthica. As nuclear-encoded ATP synthase subunits proved to be outliers, it would be interesting to investigate further the rate of molecular evolution of mitochon-drial-encoded subunits [69]. Unfortunately, these genes (atp6 and atp8) could not be detected among the 1,714 quality-filtered contigs, or among the raw 58,304 contigs produced by our MIRA assembly. Future research efforts will therefore focus on further characterizing the extent of cytonuclear disequilibrium among hybrid populations of M. balthica, and contrast it with background levels from natural populations (e.g. [74]).
Conclusions and Future Research Efforts
M. balthica is a particularly interesting model system for the study of hybridization in postglacial marine environments [29,73,75], and genetic information is now accumulating rapidly for this species, as two mitochondrial genes (cox1 and cox3) [27– 29,72,73], nine nuclear microsatellite loci [16,76], 17 allozyme loci [71,77], and 84 AFLP loci [57] were produced to date. The avalanche of data produced with the 454 platform allowed us to scan for nuclear and mitochondrial genes putatively under the
influence of selection, detect about 17K SNPs, estimate their density across the genome, and pave the way to high-throughput population genetics for this species. Indeed, we were able, based on this preliminary scan, to identify 384 SNP markers that will be tested in mass genotyping across the full biogeographic range of M. balthica in the NE Atlantic, spanning two zones of strong population differentiation. SNPs diagnostic of population differ-entiation will be statistically tested for selection (e.g. [55,78]). Based on the preliminary annotation presented here, and future transcriptome sequencing efforts, outlier SNPs will further inform us on which genes are involved in the establishment and maintenance of hybrid zones of different age and origin, and their dynamics in the face of rapid climate change [6,7].
Materials and Methods Ethics Statement
No specific permits were required for the described field studies in Aytre´, France and in the Gulf of Gdansk, Poland. Sampling locations were not private nor protected. Collection of M. balthica in the Somme Nature Reserve, France, was approved by Mr. Patrick Triplet from the Reserve administration. Field studies did not involve endangered or protected species.
Sampling and Sequencing of cDNA Libraries
To maximize the likelihood to detect high polymorphism levels and develop SNP markers relevant to the study of hybrid zones and local adaptation, we chose to sample three geographically disjunct populations (Figure 7). The population of Aytre´ (Bay of Biscay, France; 46.13N 1.13W) is located at the southern limit of the species distributional range, is adjacent to a putative hybrid zone in southern Brittany [16], and is subjected to warming surface waters [11]. The population of Gdansk (Baltic Sea, Poland; 54.21N 18.68E) was sampled near the Vistula River. This population is located eastward of a well-documented hybrid zone [29,72]. The population of the Somme Bay (English Channel, France; 50.21N, 1.62W) is located in a nature reserve, and at the heart of the biogeographic range of M. balthica. Collections occurred in January 2008, and ten individuals were sampled per site. Whole individuals were preserved immediately after collection in RNAlater (Sigma) to stabilize cellular RNA. Total RNA was extracted with TRIzol (Invitrogen), quantified with a NanoDrop ND-1000 spectrophotometer (Thermo Fisher Scientific) and using 1% agarose gels, and diluted to 400 ng/ml. Pooling individuals into a single sequencing run allows the estimation of allele frequencies and population differentiation statistics at a lower cost than with individual tagging [46,79,80]. The RNA extracted from 10 individuals, for each population, was therefore pooled, and three cDNA libraries were constructed using the Mint cDNA Synthesis kit (Evrogen). cDNA quality was checked on a 1.2% agarose gel in 1X TAE buffer before purification with the NucleoSpin Extract II Kit (MACHEREY-NAGEL GmbH & Co.). Libraries were not normalized in order to maximize depth of coverage. Twenty mg of each cDNA library were sent to Beckman Coulter Genomics (Grenoble, France) to be analyzed on a single Roche 454 GS-FLX Titanium sequencing run. Each cDNA library was tagged prior to sequencing in order to separate reads from different populations after the sequencing step.
Assembly
Primer sequences, poly(A) tails and reads produced from ribosomal DNA template were removed with SeqClean [81]. Cleaned reads were deposited to the NCBI Short Read Archive (Submission # SRA052276.1, Accession # SRX145744-6, [82]).
Each of the three sets of sequences was individually assembled with MIRA v. 3.0.0 [83] with the following parameters: 454 sequencing technology; accurate, de novo EST assembly type). Resulting contigs were then pooled. Because the aim of the study was not to sequence the entire transcriptome but rather to detect polymor-phic sites from high-quality sequences, we restricted our analyses to contigs with average quality aˆ$42, built de novo from aˆ$10 reads, and longer than 400 bp. Duplicated contigs were removed after detection using clustering (CD-HIT-EST with default parameters; [84]), reciprocal blast, and custom perl scripts (available upon request). Singletons and contigs built in repetitive regions (‘‘rep’’, as detected by MIRA) were also removed.
Contig Identification and Functional Annotation
Automated local blastx search (NCBI ‘‘nr’’ database with e-value of 1e210 and HSP length cut-off of 100) and gene annotation (using default parameters and evidence code weights) were performed with Blast2GO v. 2.6.0 (database version b2g_jun11) [85–88]. Mitochondrial sequences were identified using local blast on the complete mitochondrial genome of Sinonovacula constricta (EU880278.1). To detect putative pseudo-genes, the selected contigs were then further characterized by the prevalence of stop codons in the six reading frames using NCBI ORF Finder [89].
Read Mapping and SNP Discovery
In this communication, coverage is referred as the number of time a particular reference DNA fragment was sequenced; depth of coverage is defined as the number of reads providing information about a particular base [90]. Contigs were used as reference genome for SNP discovery (1,714 contigs, equivalent to 1.96 Mb). To guide the mapping step, a hash index for those contigs was built in SMALT v. 0.5.8 (Wellcome Trust Sanger Institute 2010, 2011 Genome Research Limited [91]) using a word length of 13 (k-mer) and a sampling step size of 2, as recommended in the SMALT manual for Roche 454 sequence data. Read sequences and quality scores were combined into a fastq file using the Galaxy pipeline [92–95], and mapped onto the 1,714 reference contigs using SMALT. The resulting SAM files were filtered in SAMtools v. 0.1.17 [96] to retain alignments with a
Figure 7. Sampling locations of the three population pools used for SNP discovery inMacoma balthica. Orthogonal projection with 10 degree grid. The positions of contact zones among differentiated mitochondrial lineages are indicated as blue circles (after [16,72]).
doi:10.1371/journal.pone.0052302.g007
minimum quality score of 20, and individuals base calls with a minimum quality score of 20. This last threshold was found to be generally sufficient for the detection of high-quality SNPs from PoolSeq data on the Illumina platform [97]. Only SNPs with a minor allele frequency (averaged over all populations) aˆ$5% and a depth of coverage aˆ$10 reads for each population were considered. Mitochondrial and nuclear SNPs were treated separately. Data were manipulated using custom R scripts [98– 100].
Population Genetic Summary Statistics and Outlier Detection
Allele frequencies were computed for each population. Because of the atypical sampling properties due to pooling of individuals, pairwise FST and expected heterozygosity were computed as in
[47]. Gene diversity was computed as expected heterozygosity averaged over the total number of sites with coverage above 10. Outlier detection was performed on nuclear SNPs using the bayesian method implemented in BayeScan v2.0 [101]. In a recent benchmark of FST outlier tests for SNPs, BayeScan was found to
provide high power and low rates of type I errors [102]. To evaluate the impact of the hierarchical genetic structure between the three populations [30], we performed a total of four analysis sets: one including information from all three populations (A-G-S), and three corresponding to the different population pairs (G, A-S, G-S). Short pilot runs (20 pilot runs of length 5,000) were used to estimate model parameters. Sample size was then set to 5,000 and the thinning interval to 10, for a total MCMC chain length of 100,000 steps, of which the first 50,000 were discarded (burnin). Given the large number of SNPs to test, prior odds were set to 1,000 (BayeScan manual). Outlier detection was done with a false
discovery rate (FDR) set to 5%, corresponding to a Bayes Factor (BF).10, suggesting strong evidence for selection according to Jeffreys’ scale [103]. Three independent runs were performed to check for result consistency within each analysis set. Convergence was assessed by checking that no temporal trends in log-likelihood plots were visible.
Supporting Information
Table S1 Description of nuclear contigs with outlier loci. Contigs identified as aˆ ‘‘hypothetical protein’’ using blast were reported as ‘‘non-annotated’’ (na). Accession numbers and E-values correspond to the blast top hit. Information on SNPs that are fixed in some populations (FST = 1) is bolded.
(XLS)
Acknowledgments
The authors thank Patrick Triplet, Antoine Meirland (Association GEMEL, Picardie) and Rafal Lasota for specimen collections, the Molecular Core Facility at the University of La Rochelle, Se´bastien Harispe and Guillaume Dugas for their help with perl scripts, Philippe Bardou for his insights into data analysis, Mikael Guichard, Marc-Henri Boisis-Delavaud and Fre´de´ric Bret from the IT Center at the University of La Rochelle, and Ame´lia Viricel for constructive criticism of the manuscript.
Author Contributions
Conceived and designed the experiments: VB PG. Performed the experiments: EP AR VB. Analyzed the data: EP AR VB KB NB. Contributed reagents/materials/analysis tools: EP AR VB KB NB PG. Wrote the paper: EP AR VB NB PG.
References
1. Bell G, Collins S (2008) Adaptation, extinction and global change. Evolutionary Applications 1: 3–16.
2. Parmesan C, Galbraith H (2004) Observed ecological impacts of climate change in North America. Technical report, Pew Center on Global Climate Change, Arlington, VA.
3. Parmesan C, Yohe G (2003) A globally coherent fingerprint of climate change impacts across natural systems. Nature 421: 37–42.
4. Helmuth B, Mieszkowska N, Moore P, Hawkins SJ (2006) Living on the edge of two changing worlds: Forecasting the responses of rocky intertidal ecosystems to climate change. Annual Review of Ecology Evolution and Systematics 37: 373–404.
5. Mallet J (2005) Hybridization as an invasion of the genome. Trends in Ecology & Evolution 20: 229–237.
6. Hilbish TJ, Lima FP, Brannock PM, Fly EK, Rognstad RL, et al. (2012) Change and stasis in marine hybrid zones in response to climate warming. Journal of Biogeography 39: 676–687.
7. Hilbish TJ, Brannock PM, Jones KR, Smith AB, Bullock BN, et al. (2010) Historical changes in the distributions of invasive and endemic marine invertebrates are contrary to global warming predictions: the effects of decadal climate oscillations. Journal of Biogeography 37: 423–431.
8. Barton N (1979) The dynamics of hybrid zone. Heredity 43: 341–359. 9. Jansen JM, Pronker AE, Bonga SW, Hummel H (2007) Macoma balthica in
Spain, a few decades back in climate history. Journal of Experimental Marine Biology and Ecology 344: 161–169.
10. Hummel H, Bogaards R, Bachelet G, Caron F, Sol J, et al. (2000) The respiratory performance and survival of the bivalve Macoma balthica (L.) at the southern limit of its distribution area: a translocation experiment. Journal of Experimental Marine Biology and Ecology 251: 85–102.
11. Goikoetxea N, Borja A, Fonta´n A, Gonza´lez M, Valencia V (2009) Trends and anomalies in sea-surface temperature, observed over the last 60 years, within the southeastern Bay of Biscay. Continental Shelf Research 29: 1060–1069. 12. Edjung G, Bonsdorff E (1992) Predation on the bivalve Macoma balthica by the
isopod Saduria entomon: laboratory and field experiments. Marine Ecology Progress Series 88: 207–214.
13. Piersma T, Beukema J (1993) Tropic interactions between shorebirds and their invertebrate prey. Netherlands Journal of Sea Research 31: 299–512. 14. Mattila J, Bonsdorff E (1998) Predation by juvenile flounder (Platichthys flesus L.):
a test of prey vulnerability, predator preference, switching behaviour and functional response. Journal of Experimental Marine Biology and Ecology 227: 221–236.
15. Philippart C, Van Aken H, Beukema J, Bos O, Cadee G, et al. (2003) Climate-related changes in recruitment of the bivalve Macoma balthica. Limnology and Oceanography 48: 2171–2185.
16. Becquet V, Simon-Bouhet B, Pante E, Hummel H, Garcia P (2012) Glacial refugium versus range limit: conservation genetics of Macoma balthica, a key species in the Bay of Biscay (France). Journal of Experimental Marine Biology and Ecology 432–433: 73–82.
17. Jolly MT, Viard F, Gentil F, Thie´baut E, Jollivet D (2006) Comparative phylogeography of two coastal polychaete tubeworms in the Northeast Atlantic supports shared history and vicariant events. Molecular Ecology 15: 1841– 1855.
18. Jolly MT, Jollivet D, Gentil F, Thie´baut E, Viard F (2005) Sharp genetic break between Atlantic and English Channel populations of the polychaete Pectinaria koreni, along the North coast of France. Heredity 94: 23–32.
19. Gilad Y, Pritchard JK, Thornton K (2009) Characterizing natural variation using next-generation sequencing technologies. Trends in Genetics 25: 463– 471.
20. Wolf JBW, Lindell J, Backstro¨m N (2010) Speciation genetics: current status and evolving approaches. Philosophical transactions of the Royal Society of London Series B, Biological sciences 365: 1717–1733.
21. Ekblom R, Galindo J (2011) Applications of next generation sequencing in molecular ecology of non-model organisms. Heredity 107: 1–15.
22. Barbazuk W, Emrich S, Chen H, Li L, Schnable P (2007) SNP discovery via 454 transcriptome sequencing. The Plant Journal 51: 910–918.
23. Vera JC, Wheat CW, Fescemyer HW, Frilander MJ, Crawford DL, et al. (2008) Rapid transcriptome characterization for a nonmodel organism using 454 pyrosequencing. Molecular Ecology 17: 1636–1647.
24. Meyer E, Aglyamova GV, Wang S, Buchanan-Carter J, Abrego D, et al. (2009) Sequencing and de novo analysis of a coral larval transcriptome using 454 GSFlx. BMC Genomics 10: 219.
25. Cahais V, Gayral P, Tsagkogeorga G, Melo-Ferreira J, Ballenghien M, et al. (2012) Reference-free transcriptome assembly in non-model animals from next-generation sequencing data. Molecular Ecology Resources 12: 834–845. 26. Margulies M, Egholm M, Altman WE, Attiya S, Bader JS, et al. (2005)
Genome sequencing in microfabricated high-density picolitre reactors. Nature 437: 376–80.
27. Luttikhuizen PC, Drent J, van Delden W, Piersma T (2003) Spatially structured genetic variation in a broadcast spawning bivalve: quantitative vs. molecular traits. Journal of Evolutionary Biology 16: 260–272.
28. Luttikhuizen PC, Drent J, Baker AJ (2003) Disjunct distribution of highly diverged mitochondrial lineage clade and population subdivision in a marine bivalve with pelagic larval dispersal. Molecular Ecology 12: 2215–2229. 29. Nikula R, Strelkov P, Va¨ino¨la¨ R (2007) Diversity and trans-arctic invasion
history of mitochondrial lineages in the North Atlantic Macoma balthica complex (Bivalvia: Tellinidae). Evolution 61: 928–941.
30. Excoffier L, Hofer T, Foll M (2009) Detecting loci under selection in a hierarchically structured population. Heredity 103: 285–298.
31. Bultelle F, Panchout M, Leboulenger F, Danger JM (2002) Identification of differentially expressed genes in Dreissena polymorpha exposed to contaminants. Marine Environmental Research 54: 385–389.
32. Boutet I, Tanguy A, Moraga D (2004) Response of the Pacific oyster Crassostrea gigas to hydrocarbon contamination under experimental conditions. Gene 329: 147–157.
33. Huvet A, Herpin A, De´gremont L, Labreuche Y, Samain JF, et al. (2004) The identification of genes from the oyster Crassostrea gigas that are differentially expressed in progeny exhibiting opposed susceptibility to summer mortality. Gene 343: 211–220.
34. Putnam NH, Butts T, Ferrier DEK, Furlong RF, Hellsten U, et al. (2008) The amphioxus genome and the evolution of the chordate karyotype. Nature 453: 1064–1071.
35. Khachane AN, Harrison PM (2009) Assessing the genomic evidence for conserved transcribed pseudogenes under selection. BMC Genomics 10: 435. 36. Gagliardi D, Stepien PP, Temperley RJ, Lightowlers RN, Chrzanowska-Lightowlers ZMA (2004) Messenger RNA stability in mitochondria: different means to an end. Trends in Genetics 20: 260–267.
37. Mohanty BK, Kushner SR (2011) Bacterial/archaeal/organellar polyadenyl-ation. Wiley Interdisciplinary Reviews: RNA 2: 256–276.
38. Butow RA, Zhu H, Perlman P, Conrad-Webb H (1989) The role of a conserved dodecamer sequence in yeast mitochondrial gene expression. Genome 31: 757–760.
39. Gagliardi D, Leaver CJ (1999) Polyadenylation accelerates the degradation of the mitochondrial mRNA associated with cytoplasmic male sterility in sunflower. The EMBO journal 18: 3757–3766.
40. Bensasson D, Zang DX, Hartl DL, Hewitt GM (2001) Mitochondrial pseudogenes: evolution’s misplaced witnesses. Trends in Ecology & Evolution 16: 314–321.
41. Boore JL (2006) The complete sequence of the mitochondrial genome of Nautilus macromphalus (Mollusca: Cephalopoda). BMC Genomics 7: 182. 42. DeJong RJ, Emery AM, Adema CM (2004) The mitochondrial genome of
Biomphalaria glabrata (Gastropoda: Basommatophora), intermediate host of Schistosoma mansoni. The Journal of Parasitology 90: 991–997.
43. Faure E, Delaye L, Tribolo S, Levasseur A, Seligmann H, et al. (2011) Probable presence of an ubiquitous cryptic mitochondrial gene on the antisense strand of the cytochrome oxidase I gene. Biology Direct 6: 56.
44. Galindo J, Grahame JW, Butlin RK (2010) An EST-based genome scan using 454 sequencing in the marine snail Littorina saxatilis - Corrigendum. Journal of Evolutionary Biology 23: 2768–2769.
45. Galindo J, Grahame JW, Butlin RK (2010) An EST-based genome scan using 454 sequencing in the marine snail Littorina saxatilis. Journal of Evolutionary Biology 23: 2004–2016.
46. Futschik A, Schlo¨tterer C (2010) The next generation of molecular markers from massively parallel sequencing of pooled DNA samples. Genetics 186: 207–218.
47. Kolaczkowski B, Kern AD, Holloway AK, Begun DJ (2011) Genomic differentiation between temperate and tropical Australian populations of Drosophila melanogaster. Genetics 187: 245–260.
48. Sauvage C, Bierne N, Lapegue S, Boudry P (2007) Single Nucleotide polymorphisms and their relationship to codon usage bias in the Pacific oyster Crassostrea gigas. Gene 406: 13–22.
49. Cutter AD, Baird SE, Charlesworth D (2006) High nucleotide polymorphism and rapid decay of linkage disequilibrium in wild populations of Caenorhabditis remanei. Genetics 174: 901–913.
50. Small K, Brudno M, Hill M, Sidow A (2007) Extreme genomic variation in a natural population. Proceedings of the National Academy of Sciences of the United States of America 104: 5698–5703.
51. Shapiro JA, Huang W, Zhang C, Hubisz MJ, Lu J, et al. (2007) Adaptive genic evolution in the Drosophila genomes. Proceedings of the National Academy of Sciences of the United States of America 104: 2271–2276.
52. De´gremont L, Ernande B, Bedier E, Boudry P (2007) Summer mortality of hatchery-produced Pacific oyster spat (Crassostrea gigas). I. estimation of genetic parameters for survival and growth. Aquaculture 262: 41–53.
53. Bazin E, Glemin S, Galtier N (2006) Population size does not influence mitochondrial genetic diversity in animals. Science 312: 570–572. 54. Nosil P, Funk DJ, Ortiz-Barrientos D (2009) Divergent selection and
heterogeneous genomic divergence. Molecular Ecology 18: 375–402. 55. Beaumont M, Nichols R (1996) Evaluating loci for use in the genetic analysis of
population structure. Proceedings of the Royal Society B-Biological Sciences 263: 1619–1626.
56. Gompert Z, Buerkle CA (2009) A powerful regression-based method for admixture mapping of isolation across the genome of hybrids. Molecular Ecology 18: 1207–1224.
57. Luttikhuizen PC, Drent J, Peijnenburg KTCA, Van der Veer HW, Johannesson K (2012) Genetic architecture in a marine hybrid zone:
comparing outlier detection and genomic clines analysis in the bivalve Macoma balthica. Molecular Ecology 21: 30–48–3061.
58. Harr B (2006) Genomic islands of differentiation between house mouse subspecies. Genome Research 16: 730–737.
59. Freamo H, O’Reilly P, Berg PR, Lien S, Boulding EG (2011) Outlier SNPs show more genetic structure between two Bay of Fundy metapopulations of Atlantic salmon than do neutral SNPs. Molecular Ecology Resources 11 Suppl 1: 254–267.
60. Orsini L, Jansen M, Souche EL, Geldof S, De Meester L (2011) Single nucleotide polymorphism discovery from expressed sequence tags in the waterflea Daphnia magna. BMC Genomics 12: 309.
61. Bierne N, Welch J, Loire E, Bonhomme F, David P (2011) The coupling hypothesis: why genome scans may fail to map local adaptation genes. Molecular Ecology 20: 2044–2072.
62. Turner TL, Bourne EC, Von Wettberg EJ, Hu TT, Nuzhdin SV (2010) Population resequencing reveals local adaptation of Arabidopsis lyrata to serpentine soils. Nature Genetics 42: 260–263.
63. Ellison CK, Burton RS (2006) Disruption of mitochondrial function in interpopulation hybrids of Tigriopus californicus. Evolution 60: 1382–1391. 64. Asmussen MA, Arnold J, Avise JC (1987) Definition and properties of
disequilibrium statistics for associations between nuclear and cytoplasmic genotypes. Genetics 115: 755–768.
65. Arnorld M (1993) Cytonuclear disequilibria in hybrid zones. Annual Review of Ecology and Systematics 24: 521–554.
66. Breewer J, Werren J (1995) Hybrid breakdown between two haplodiploid species: The role of nuclear and cytoplasmic genes. Evolution 49: 705–717. 67. Burton RS, Ellison CK, Harrison JS (2006) The sorry state of F2 hybrids:
consequences of rapid mitochondrial DNA evolution in allopatric populations. American Naturalist 168 Suppl 6: S14–24.
68. Oliveira DCSG, Raychoudhury R, Lavrov DV, Werren JH (2008) Rapidly evolving mitochondrial genome and directional selection in mitochondrial genes in the parasitic wasp Nasonia (Hymenoptera: Pteromalidae). Molecular Biology and Evolution 25: 2167–2180.
69. Gagnaire PA, Normandeau E, Bernatchez L (2012) Comparative genomics reveals adaptive protein evolution and a possible cytonuclear incompatibility between European and American eels. Molecular Biology and Evolution 29: 2909–2919.
70. Burton RS, Barreto FS (2012) A disproportionate role for mtDNA in Dobzhansky-Muller incompatibilities? Molecular Ecology 21: 4942–57. 71. Va¨ino¨la¨ R (2003) Repeated trans-Arctic invasions in littoral bivalves: molecular
zoogeography of the Macoma balthica complex. Marine Biology 143: 935–946. 72. Nikula R, Strelkov P, Va¨ino¨la¨ R (2008) A broad transition zone between an inner Baltic hybrid swarm and a pure North Sea subspecies of Macoma balthica (Mollusca, Bivalvia). Molecular Ecology 17: 1505–1522.
73. Strelkov P, Nikula R, Va¨ino¨la¨ R (2007) Macoma balthica in the White and Barents Seas: properties of a widespread marine hybrid swarm (Mollusca: Bivalvia). Molecular Ecology 16: 4110–4127.
74. Latta RG, Linhart YB, Mitton JB (2001) Cytonuclear disequilibrium and genetic drift in a natural population of Ponderosa pine. Genetics 158: 843–850. 75. Riginos C, Cunningham CW (2007) Hybridization in postglacial marine
habitats. Molecular Ecology 16: 3971–3972.
76. Becquet V, Lanneluc I, Simon-Bouhet B, Garcia P (2009) Microsatellite markers for the Baltic clam, Macoma balthica (Linne´, 1758), a key species concerned by changing southern limit, in exploited littoral ecosystems. Conservation Genetics Resources 1: 265–267.
77. Va¨ino¨la¨ R, Varvio SL (1989) Biosystematics of Macoma balthica in northwestern Europe. In: Ryland J, Tyler P, editors, Reproduction, genetics and distributions of marine organisms. Fredensborg: Olsen and Olsen, 23rd Eur Mar Biol Symp, 309–316.
78. Beaumont MA (2005) Adaptation and speciation: what can F(st) tell us? Trends in Ecology & Evolution 20: 435–440.
79. Van Tassell C, Smith T, Matukumalli L, Taylor J, Schnabel R, et al. (2008) SNP discovery and allele frequency estimation by deep sequencing of reduced representation libraries. Nature Methods 5: 247–252.
80. Pe´rez-Enciso M, Ferretti L (2010) Massive parallel sequencing in animal genetics: wherefroms and wheretos. Animal Genetics 41: 561–569. 81. SeqClean (2012) DFCI Gene Indices Software Tools. URL http://compbio.
dfci.harvard.edu/tgi/software/.
82. NCBI (2012) Sequence Read Archive (SRA). Available: http://www.ncbi.nlm. nih.gov/sra. Accessed 25 Nov 2012.
83. Chevreux B, Pfisterer T, Drescher B, Driesel AJ, Mu¨ller WEG, et al. (2004) Using the miraEST assembler for reliable and automated mRNA transcript assembly and SNP detection in sequenced ESTs. Genome Research 14: 1147– 1159.
84. Li W, Godzik A (2006) Cd-hit: a fast program for clustering and comparing large sets of protein or nucleotide sequences. Bioinformatics 22: 1658–1659. 85. Go¨tz S, Arnold R, Sebastia´n-Leo´n P, Martn-Rodrı´guez S, Tischler P, et al.
(2011) B2G-FAR, a species-centered GO annotation repository. Bioinformatics 27: 919–924.
86. Go¨tz S, Garcia´-Go´mez JM, Terol J, Williams TD, Nagaraj SH, et al. (2008) High-throughput functional annotation and data mining with the Blast2GO suite. Nucleic Acids Research 36: 3420–3435.
87. Conesa A, Go¨tz S (2008) Blast2go: A comprehensive suite for functional analysis in plant genomics. International Journal of Plant Genomics Article ID 619832: 12 pages.
88. Conesa A, Go¨tz S, Garca-Go´mez JM, Terol J, Talo´n M, et al. (2005) Blast2GO: a universal tool for annotation, visualization and analysis in functional genomics research. Bioinformatics 21: 3674–3676.
89. Tatusov T, Tatusov R (2012) ORF Finder (Open Reading Frame Finder). Available: http://www.ncbi.nlm.nih.gov/projects/gorf/. Accessed 25 Nov 2012.
90. Stapley J, Reger J, Feulner PGD, Smadja C, Galindo J, et al. (2010) Adaptation genomics: the next generation. Trends in Ecology & Evolution 25: 705–712. 91. Ponstingl H (2012) Smalt. Available: http://www.sanger.ac.uk/resources/
software/smalt/. Accessed 25 Nov 2012.
92. Giardine B, Riemer C, Hardison RC, Burhans R, Elnitski L, et al. (2005) Galaxy: a platform for interactive large-scale genome analysis. Genome Research 15: 1451–1455.
93. Blankenberg D, Von Kuster G, Coraor N, Ananda G, Lazarus R, et al. (2010) Galaxy: a web-based genome analysis tool for experimentalists. In: Current Protocols in Molecular Biology. 1–21.
94. Blankenberg D, Gordon A, Von Kuster G, Coraor N, Taylor J, et al. (2010) Manipulation of FASTQ data with Galaxy. Bioinformatics 26: 1783–1785. 95. Goecks J, Nekrutenko A, Taylor J, Galaxy Team (2010) Galaxy: a
comprehensive approach for supporting accessible, reproducible, and trans-parent computational research in the life sciences. Genome Biol 11: R86.
96. Li H, Handsaker B, Wysoker A, Fennell T, Ruan J, et al. (2009) The sequence alignment/map format and samtools. Bioinformatics 25: 2078–2079. 97. Kofler R, Orozco-terWengel P, De Maio N, Pandey RV, Nolte V, et al. (2011)
PoPoolation: a toolbox for population genetic analysis of next generation sequencing data from pooled individuals. PLoS ONE 6: e15925.
98. R Development Core Team (2012) R: A Language and Environment for Statistical Computing. R Foundation for Statistical Computing, Vienna, Austria. Available: http://www.R-project.org. Accessed 25 Nov 2012. ISBN 3–900051–07–0.
99. Paradis E, Claude J, Strimmer K (2004) APE: analyses of phylogenetics and evolution in R language. Bioinformatics 20: 289–290.
100. Charif D, Lobry J (2007) SeqinR 1.0–2: a contributed package to the R project for statistical computing devoted to biological sequences retrieval and analysis. In: U Bastolla HR M Porto, Vendruscolo M, editors, Structural approaches to sequence evolution: Molecules, networks, populations, New York: Springer Verlag, Biological and Medical Physics, Biomedical Engineering. 207–232. 101. Foll M, Gaggiotti O (2008) A genome-scan method to identify selected loci
appropriate for both dominant and codominant markers: a bayesian perspective. Genetics 180: 977–993.
102. Narum SR, Hess JE (2011) Comparison of F(ST) outlier tests for SNP loci under selection. Molecular Ecology Resources 11 Suppl 1: 184–194. 103. Jeffreys H (1961) The Theory of Probability. Oxford, 3rd edition, 432 pp.