HAL Id: ird-03127240
https://hal.ird.fr/ird-03127240
Submitted on 1 Feb 2021
HAL is a multi-disciplinary open access archive for the deposit and dissemination of sci-entific research documents, whether they are pub-lished or not. The documents may come from teaching and research institutions in France or abroad, or from public or private research centers.
L’archive ouverte pluridisciplinaire HAL, est destinée au dépôt et à la diffusion de documents scientifiques de niveau recherche, publiés ou non, émanant des établissements d’enseignement et de recherche français ou étrangers, des laboratoires publics ou privés.
A. Lourme-Ruiz, S. Dury, Y. Martin-Prével
To cite this version:
A. Lourme-Ruiz, S. Dury, Y. Martin-Prével. Linkages between dietary diversity and indicators of agricultural biodiversity in Burkina Faso. Food Security, Springer, 2021, 13 (2), pp.329-349. �10.1007/s12571-020-01137-5�. �ird-03127240�
1
Linkages between dietary diversity and indicators of agricultural
biodiversity in Burkina Faso.
Lourme-Ruiz A.a, Dury S.a, b, Martin-Prével Y.a a
MoISA, Univ Montpellier, Cirad, Ciheam-IAMM, Inrae, Institut Agro, IRD, Montpellier, France b Cirad, UMR MoISA, F-34398, Montpellier, France
Alissia Lourme-Ruiz: alissia.lourme-ruiz@ird.fr
Funding
Funding: The RELAX project (N° AF 1507-329; N° FC 2015-2440, N° FDNC Engt 00063479) is funded under the « Thought for Food » initiative, by Agropolis Fondation (ANR-10-LABX-0001-01), by Fondazione Cariplo by Fondation Daniel et Nina Carasso.
Acknowledgements
Final proofreading: Emmanuelle Bouquet, Cirad (emmanuelle.bouquet@cirad.fr)
Abstract
This paper assesses the relationships between women’s dietary diversity and various indicators of agricultural biodiversity in farms of the Hauts-Bassins, a cotton-growing region in rural western Burkina Faso. A sample of 579 farms representative of the region was surveyed at three different periods of the year. Using a qualitative 24-hour dietary recall, we computed a women’s dietary diversity score (WDDS-10) based on ten food groups. We used four crop diversity indicators: crop count (CC), Simpson’s index (SI), nutritional functional diversity (NFD) and production diversity score (PDS) based on the same food groups as in the WDDS-10. We also counted the number of agroforestry tree species that provide food and the number of animal species raised.
Mean WDDS-10 was low (3.4 ± 1.5 food groups) and did not vary between seasons, whereas the food groups consumed changed according to harvests. Farm production is based on cereals and cotton with low diversity (on average 2.2 +/- 1.0 food groups were cultivated on each farm). Results of mixed models
2
showed that WDDS-10 is positively associated with PDS and the number of agroforestry trees species. In this area, dietary diversity of women in farming households depends on the on-farm production of nutritionally diverse crops, partly because when a crop is produced some of it is usually consumed by the members of the farm household. In addition, WDDS-10 was found to be negatively associated with cotton production when managed by male farm heads, but positively when managed by women. Our results show that assessing the relationships between WDDS-10 and agricultural biodiversity depends on how the latter is assessed. In Burkina Faso, enhancing agricultural biodiversity, especially nutrient-dense crops and agroforestry trees, could be an appropriate way to improve dietary diversity.
Key words
Agricultural biodiversity, crop diversity, cotton, dietary diversity, seasonality
Introduction
In the current context of climate change, both scientists and policymakers promote a sustainable diversification of agricultural production in order to improve the diet of the population (Bogard et al. 2018; Anna Herforth et al. 2017; HLPE 2019; Jones 2017; Torres 2013). The second Sustainable Development Goal also combines agriculture and nutrition targets and aims to “end hunger, achieve
food security and improved nutrition and promote sustainable agriculture”. Agricultural biodiversity,
defined as all crops, animals, trees or plants included in an agroecosystem managed by farmers (Jones et al. 2018), is also essential for the resilience of ecosystems. At the global scale, agricultural biodiversity allows the conservation of indigenous plant and animal species and the preservation of vital ecosystem services, and hedges against environmental or climatic risks such as erosion, droughts or floods (Thrupp 2000). For farmers, diversifying their agricultural production improves soil fertility and stability and helps combat pests and plant diseases, and hence increases agricultural productivity while simultaneously limiting the use of chemical inputs. Diversification can also provide income opportunities and livelihood diversification and decrease vulnerability to natural hazards and fluctuating prices (Jackson et al. 2007; Thrupp 2000). Finally, in the context of globalisation, in which food supplies
3
are becoming increasingly similar in composition, more standardised and less diverse in crop species (Khoury et al. 2014), enhanced agricultural biodiversity could ensure farmers and populations enjoy a more diverse and sustainable diet.
Micronutrient deficiencies affect two billion people in the world (Kennedy et al., 2003; The Global
Nutrition Report 2018) and are often linked to monotonous diets based on starchy staples with low
diversity and limited access to nutrient-dense foods (Fanzo and Mattei 2012). Women and children in developing countries and populations in rural areas are the most affected (Jones et al. 2014; Kennedy et al. 2003; Welch and Graham 1999), even though they often grow food crops on farms themselves. Agricultural households can use the production of their own farm to access more diverse diets in two main ways: (i) directly, by consuming the various products grown on their own farm; or (ii) indirectly, by using the agricultural income generated to purchase more diverse foods on the market. The question is: how can agricultural production be diversified so as to help diversify diets? Obviously, the answer varies according to context, agricultural system, natural resources, climatic conditions and socio-economic characteristics.
Burkina Faso, together with Mali and Benin, is one of the greatest cotton producers in West Africa, with a production of 500,000 tonnes in 2019-2020. Most of the production is located in the western part of the country, where we conducted our study, close to the Malian production areas (including the ‘Sikasso Region’). These areas are characterised by a dynamic agricultural sector, an increasing demographic pressure and declining natural resources such as forests (Cooper and West 2017). In spite of good levels of cotton and maize production, which provide cash and basic staple, several authors have underlined that the diets of children and women remain poor in several micronutrients (Arsenault et al. 2014; Lourme-Ruiz et al. 2016; Sawadogo et al. 2010). In Mali, it has been shown that dietary diversity in the Sikasso Region is lower than in other regions and that children in this region are particularly affected by stunted growth (Dury and Bocoum 2012; Tefft et al. 2000).
Many authors have explored the relationships between agricultural production and dietary diversity in farming families. Some showed a positive correlation between farm diversity and the dietary diversity
4
of individuals (Bellon et al., 2016; Lourme-Ruiz, 2017; Malapit et al., 2015) or between farm diversity and the dietary diversity of households (Bhagowalia et al. 2012; Herforth 2010; Jones et al. 2014; Oyarzun et al. 2013), whereas others found few or no correlations (Dillon et al. 2015; Sibhatu et al. 2015; Torheim et al. 2004). A critical review by Jones (2017) concluded that the relationship is positive, but weak and non-linear (stronger when the agricultural biodiversity is low). A meta-analysis of 45 studies by Sibhatu and Qaim (2018a) reached the same conclusion, with a greater correlation in sub-Saharan Africa.
However, aggregated trends between agricultural biodiversity and dietary diversity fail to give the full picture since in some contexts farmers have access to dietary diversity through their own produce, in other cases through markets or, in most cases, through a combination of both. In addition, the above-mentioned variable relationships between agricultural production and dietary diversity in the literature could be due to methodological differences because the indicators of dietary diversity differ from one study to the next (individual or household level, different food groupings) as do the metrics used for crop or farming diversity.
Standardised indicators have been developed to assess dietary diversity (FAO and FHI 360 2016; Kennedy et al. 2011). Three main dietary diversity scores (DDS) can be distinguished for households, women and children. The household DDS (HDDS) is based on the consumption of 12 food groups (including fats, sugars and spices) over the past 24 hours and is a proxy for economic access to food. The DDS for women of childbearing age (based on 10 food groups) and for children (based on 7 food groups) are proxies for micronutrient adequacy of the diet and for adequate micronutrient density of complementary foods, respectively.
In contrast, no standardised indicator exists to assess the diversity of agricultural production, nor to assess its nutritional quality. Using the studies reviewed by Jones (2017) on linkages between agricultural biodiversity and dietary diversity, and five additional studies meeting the same inclusion criteria1 (appendix A), we identified four main types of farm diversity indicator.
5
(i) Crop counts (CC) are richness indicators corresponding to the number of crop species produced on
each farm (used in 22 studies out of 27 reviewed). They reflect the agronomical and ecological diversity of an area (Mulmi et al. 2017; Oyarzun et al. 2013) without taking into account the functional characteristics of crops.
(ii) Crop evenness indicators – such as the Shannon index or the Simpson index - assess the relative
abundance of crops by taking into account both richness and evenness (mainly based on the amount of land used for each crop). These indicators were used in four studies out of 27.
Because previous indicators do not consider the nutritional value of crops, two types of indicator that measure the nutritional quality of agricultural production have emerged in the literature in recent years.
(iii) Nutritional functional diversity (NFD) indicators also derive from the ecological literature but –
unlike the previous ones - were designed to assess production diversity based on the nutritional functionalities of crops (DeClerck et al. 2011). Usually, they measure the diversity of the nutrients produced on each farm. We found them in two studies only, primarily because they are complex to calculate.
Lastly, (iv) the number of groups of crops (used in 11 studies out of the 27) was initially based on farm products (Gonder 2011) or on food production activities (Ecker et al. 2012)
.
Later, Dillon et al. (2015) developed a production diversity score (PDS), based on the same food groups as those included in the dietary diversity score, which is now widely used.Among these four types of agricultural diversity indicator, many variants can be found in the literature. They include - or not - livestock (and the distinction between draught animals and farmed animals), home gardens, and the produce of gathering, hunting and fishing activities. Just as importantly, the inclusion of non-food crops in diversity indicators varies across studies. In our case, we chose not to keep cotton in our indicators since it is ‘only’ a cash crop for farmers, in contrast to all other products. In addition, agricultural diversity indicators often exclude ‘minor’ species, i.e. those cultivated in home
and Qaim, (2018a) because they met the following criteria: written in English, with at least 1 metric of agricultural diversity and 1 metric of diet or nutrition outcome, and concern entire farm systems (not a specific crop or gardening).
6
gardens or individual plots, or gathered, or crops managed by women, which are often omitted even though they are crucial for dietary diversity (Fanzo and Mattei 2012). Lastly, agricultural data are usually collected over a period of one year, while dietary diversity is measured over the one to seven days preceding the interview (Mulmi et al. 2017). These different time scales could partly explain the weak associations found between agricultural diversity and dietary diversity (Jones 2017; Sibhatu and Qaim 2018a).
We believe that the four indicator groups described above and their variants reflect numerous distinct dimensions of farming diversity and that the lack of clarity surrounding the construction of the indicators can have serious consequences for the analysis of linkages between agriculture and nutrition.
The aim of this paper is thus to explore the relationships between women’s dietary diversity and agricultural biodiversity using the four crop diversity indicators, as well as the number of agroforestry tree species and animal species, while also taking into account cotton production. We analysed these relationships using data collected at three different periods of the year in the Haut-Bassins region of western Burkina Faso.
Methods
1.1. Setting
Hauts-Bassins is an administrative district of western Burkina Faso that has three subdistricts: Tuy, Houet and Kenedougou. There are two seasons: a rainy season from May to October/November and a dry season from November to April. Average annual rainfall ranges from 800 to 1,200 mm.
In rural areas, almost all households are farm households (FAO 2009). Production is based on the association of maize and cotton, supported by the long-term presence of the cotton industry in the district and by public agricultural policies including research and extension services. The cotton industry provides the inputs on credit (seeds, fertilisers and pesticides), to which maize also responds well. Burkina Faso is one of the greatest cotton producers in sub-Saharan Africa and 40% of all the cotton
7
comes from the Hauts-Bassins district, particularly Tuy. Between 2009 and 2011, the average annual production of cereals was 412 kg/capita, compared with 261 kg/capita at the national level (FAO Countrystat, 2009). Houet is also a livestock-rearing area and Kenedougou is called “the Burkina orchard” thanks to its production of mangos and cashews.
Despite the good agricultural production of cotton and cereals, dietary diversity is low (Lourme-Ruiz et al. 2016) and the prevalence of stunting among children is very high (39% in 2011 according to the Department of nutrition - Health ministry 2012).
1.2. Data collection
A randomly-selected sample of 580 farms was monitored over one year to capture seasonal variations. Out of the list of all the rural villages of the region (obtained from the General Population and Habitat Census of 2006, Ministry of Economy and Finance), 40 villages were selected through random choice weighted according to the size of their population. Although this census was fairly old, it was the most recent available at the time of the study. We then conducted a census of all the farms in each of these villages, and from this exhaustive numbered list of farms we selected at random 15 farms per village. In each farm, we interviewed the farm head (always a man) and the woman living in the farm who had the youngest child (between 6 and 24 months of age). The data collected included socio-demographic characteristics, farm and agricultural production characteristics, as well as farm and non-farm income of farm heads and women alike.
The same farm heads and the same women were interviewed at three different periods. The first round of interviews, in April 2013, took place at the end of the dry season. The second round was organised in August 2013, during the rainy season, when vegetation is growing - but this is also the lean season, when peasants are waiting for the first cereal harvest, which starts in October. The third round, in February 2014, took place after the end of the cereal and cotton harvests. February is also a season of vegetable gardening (tomatoes, onion and green vegetables) for farmers who have access to irrigation. Among the 600 farms we sampled, 579 ‘male farm head – woman pairs’ were surveyed in April, 402 in August and 421 in February. In April, 21 survey questionnaires were excluded due to unreliability. In
8
August, during the rainy season, many farmers could not be contacted mainly because they were working in fields located far from the village with no telephone network, and in February, post-harvest, a few male farm heads had migrated for work reasons. Because of the death of children, eight farms were removed from the sample in August and seven in February.
1.3. Women’s Dietary Diversity Score
At each campaign of interviews, women freely described all the food items and drinks they had consumed the day before the interview. From this qualitative 24-hour diet recall of women, food items were classified among the ten food groups recommended by the FAO (FAO and FHI, 2016): (1) grains, white roots and tubers, (2) pulses (beans, peas and lentils), (3) nuts and seeds, (4) dairy, (5) meat, poultry and fish, (6) eggs, (7) dark green leafy vegetables, (8) other vitamin A-rich fruits and vegetables, (9) other vegetables and (10) other fruits. We calculated the women’s dietary diversity score (WDDS-10) based on the number of food groups consumed out of these ten food groups by each woman (Martin-Prevel et al., 2017). As recommended in the guide (FAO and FHI, 2016), food items were taken into account in the score only if the woman consumed more than 15 grams. For example, dried fish or soumbala (fermented nere seeds) used as spice in small quantities were not counted.
This score was the continuous variable used to define the minimum dietary diversity for women (MDD-W) indicator, which corresponds to the proportion of women in a population who consume at least five food groups out of 10. The MDD-W is a proxy for micronutrient adequacy summarised across 11 micronutrients (FAO and FHI 360 2016; Martin-Prevel et al. 2017).
1.4. Agricultural diversity indicators
By simple recall, we interviewed (i) farm heads on their production in the ‘family fields’ and (ii) women on their production in their individual plots. Data were collected in April 2013 and covered all crops (grown in fields, home gardens or other areas) harvested during the 2012-2013 agricultural campaign. For each crop species, we recorded the quantities harvested, self-consumed, sold (and the amount of cash received) and stocked, in local units of measure (jute bag, tomato tin, wheelbarrow, etc.), and we converted these data into kilograms using local conversion tables.
9
Agricultural biodiversity assessment was divided into crop diversity indicators, the number of agroforestry tree species and the number of animal species. We chose to assess four crop diversity indicators based on a literature review concerning linkages between agricultural diversity and dietary diversity: crop count (CC), Simpson’s diversity index (SDI) as crop evenness indicator, Nutritional functional diversity (NFD) and production diversity score (PDS). We calculated them using data on food crops (and eggs and milk for the PDS) as defined below. Among the crop evenness indicators, we chose Simpson’s diversity index because, unlike the Margalef index for instance, it takes into account the relative abundance of crops; in addition, it is the most frequently used indicator of this type in the literature, including in a recent comparable study (Jones 2015). Cotton production, the only non-food crop produced on the farms, was not included in these diversity indicators but was included in our analyses as a dichotomous variable.
The number of agroforestry tree species that provide edible products (with the exception of orchard trees) are considered independently because their production is based on a different logic than that of agricultural crops. Trees in fields are not planted every year, but are intentionally kept and maintained. We identified nine species of agroforestry trees with a food interest: baobab (Adansonia digitata L.), shea (Vitellaria paradoxa), nere (Parkia biglobosa), mimosa (Acacia macrostachya), kapok (Bombax
costatum), tamarind (Tamarindus indica L.), wild grape (Lannea microcarpa), palmyra palm
(Borasssus) and plum (Vitex doniana) and we established as specific indicator of tree diversity (TD), the number of these species managed on the farm, ranging from 0 to 9.
We recorded farm animal species (except draught animals) including poultry, cattle, sheep, equidae, pigs and goats and built an indicator of animal diversity (AD, the number of animal types present, ranging from 0 to 6).
Because only a few women managed agricultural production, agricultural diversity variables calculated from their products (crop diversity indicators, agroforestry trees on fields, livestock) were considered as dichotomous (Yes/No).
10
1.4.1. Crop Count (CC)
The Crop Count (or Crop Index) is an indicator of wealth and is calculated as a simple sum of the different crop species produced by the farmers. This indicator is the most widely used in the literature, but the ‘crop count’ is usually used as a basic, simple, measure of the diversity of genetic resources, with no particularly precise indication of methodology (Meng et al. 1998). In particular, there is no rule concerning what is added up (crops, livestock, etc.), the level of detail (crop, species, varieties) or the interpretation.
Here, we included food crops only. We found 31 crops among the 48 identified by the Ministry of Agriculture for Permanent Agricultural Surveys: millet and sorghum (white and red), maize, rice, fonio, peanut, sesame, soybean, cowpea, woandzou (Bambara groundnut), yam, sweet potato, cassava, orange, cashew, banana, mango, papaya, onion, green onion, cabbage, tomato, eggplant, chilly, green bean, cucumber, bell pepper, okra, zucchini, melon and watermelon, ginger and roselle (Hibiscus sabdariffa). We counted 30 crops produced on family plots and managed by the male farm heads, and 13 managed by women.
1.4.2. Simpson’s diversity index (SDI)
Simpson's diversity index (SDI) is an indicator of relative abundance (Simpson 1949) that reflects wealth (number of crops produced) and evenness of the quantities of each crop. Presented in a different way, SDI is the probability that two randomly-selected quantities produced on the farm belong to the same crop type. The closer to 0 its value, the lower the number of species and the more different are the quantities of each. Its value increases when the number of species increases and/or when the quantities of each species are more similar.
In most studies applied to agriculture that use Simpson's index, it is calculated from the surface area occupied by each crop in the fields, expressed in relative terms. We chose to calculate SDI on the basis of production in kilograms of dry matter because we had noted that it is difficult to collect reliable data concerning the areas dedicated to each crop given that different crops are often associated on the plots. Moreover, seeding densities can vary considerably, as well as yields. Production levels seem to us to be
11
much more precise than surface areas to express the diversity of production. Finally, as it is difficult to compare kilograms of cereals, legumes or fruits, we used kilograms of dry matter. The conversion was done using the USDA (United States Department of Agriculture) National Nutrient Database for Standard Reference Release 272.
1.4.3. Nutritional functional diversity (NFD)
Nutritional Functional Diversity (NFD) was developed by Petchey and Gaston (2002) to measure the impact of biodiversity on the provision of ecosystem services. This indicator uses the characteristics (or functionalities) of species to assess biodiversity. Based on this method, DeClerck et al. (2011) created the nutritional functional diversity indicator by using the quantities of nutrients contained in crops to assess the coverage of the nutritional needs of individuals. Thus, the more crops with different nutrients a farm produces, the higher its NFD will be. If the farm produces two crops containing the same micronutrients and the first crop is sufficient to cover the needs of individuals in these micronutrients, then the second crop will be equated to zero.
Nutritional functional diversity was calculated from two matrices:
(i) the crop-nutrient matrix corresponds to the concentrations of 17 nutrients in each crop according to their importance for nutritional needs and data availability (appendix B). To convert crop species into nutrients, we used the USDA Food Composition Database (USDA 2018) and, if the food was not listed, the FAO West African Food Composition Table (Stadlmayr et al. 2012). We calculated the NFD in the same way as Luckett et al. (2015), considering the coverage percentage of recommended nutrient intakes for 100 g of standardised daily consumption. As these authors did, we standardised the nutrients in two steps:
(a) First, we expressed the nutrients present in each product as a percentage of the Recommended Nutrient Intake3 for a woman aged between 31 and 50. We calculated the fat and carbohydrate requirements by considering the low range recommended by the USDA, respectively 20% and 45% of
2 https://ndb.nal.usda.gov/ndb/search/list
12
the energy requirements for an active woman between 31 and 50 years old (i.e. 2,200 calories); (b) then we standardised them to obtain a mean of 0 and a standard deviation of 1;
(ii) the farm-crop matrix corresponds to all crops harvested by each farm head and woman.
From these two matrices, Euclidean distances between crops were used to draw a classification tree (figure 1) in which crops are clustered according to their similarity in nutrient contents. The total length of the branches for each farm corresponds to their respective NFD calculated with the free softwares FDiversity (Casanoves et al. 2008) and R (version 2.11.0).
Fig.1: Classification tree showing the grouping of crops according to their nutrients traits
1.4.4. Number of crop groups: Production Diversity Score (PDS)
The Production Diversity Score (PDS) consists in the number of food groups produced, using the same groups as in the Dietary Diversity Score. The PDS is the number of crop groups out of nine, based on the same 10 food groups as the dietary diversity score (table 1) excluding the ‘meat, poultry and fish’ food group, which we considered separately in analyses of farm animal species (excluding draught animals). We used laying hens for eggs and dairy cows for dairy products. Crops were classified in their main consumption group. For instance, okra was classified under ‘other vegetables’ even if the leaves
13
are also consumed. Ginger, generally consumed as a spice, was not included.
Table 1: Crop and animal products per food group in the women’s dietary diversity score Women’s DDS food groups Crops and livestock
Starchy staples (grains, white roots and tubers)
Millet, maize, rice, fonio, white sorghum, red sorghum, yam, cassava
Beans, peas and lentils Cowpea, voandzou, soybean
Nuts and seeds Peanut, sesame
Dairy products Cow’s milk
Eggs Laying hens
Vitamin A-rich leafy vegetables Roselle (hibiscus sabdariffa) Vitamin A-rich fruits and vegetables Sweet potato, mango, papaya
Other vegetables Onion, tomato, local aubergine, aubergine, chili, cabbage, green bean, cucumber, pepper, courgette, okra
Other fruits Banana, watermelon, cashew (fruit), orange
*Flesh foods (poultry, cattle, ovine, equidae, pigs and goats) were excluded from the PDS and analysed separately.
1.5. Analysis
We first estimated the following linear three-level mixed models (or random-effect panel model) with individuals and villages as nested random-effect intercepts with our four different crop diversity indicators:
(1) WDDS-10it= α + β1 AB + β2 Xit + β3 Zi + ui + εit
Women’s dietary diversity score (WDDS-10) across seasons t (1, 2 and 3) depends on the agricultural biodiversity (AB) broken down into crop diversity (CD, with the four crop diversity indicators), food tree diversity (TD, estimated using the number of agroforestry tree species), animal diversity (AD, the number of animal species), and cotton production (cotton) as a dichotomous variable.
(2) WDDS-10it= α + β1 CDi + β2 TDi + β3 ADi + β4 cottoni + β5 Xit + β6 Zi + ui + εit
Each indicator was estimated both for the family fields managed by the male farm head (subscript fh) and for the individual field(s) managed by the woman (subscript w), such that:
(3) WDDS-10it= α + β11 CDfh + β12 CDw + β21 TDfh + β22 TDw + β31 ADfh + β32 ADw + β41 cottonfh + β42 cottonw + β5 Xit + β6 Zi + ui + εit.
We controlled for other factors, including time-dependent variables Xit (non-agricultural incomes for male farm heads and for women) or not Zi (agricultural income for male farm heads and women as the
14
total value of the agricultural production of the 2012-2013 campaign in CFA francs), distance to the market (walking time), size of the household, women’s age and women’s literacy.
Because we considered (simultaneously) production and consumption decisions taken within agricultural households as inseparable, we suspected a potential problem of reverse causality between women’s dietary diversity and agricultural diversity. An instrumental variable for agricultural diversity was created from cultivated area per capita, livestock, farm size, distance from market and time needed to go to a water source, and the Durbin–Wu–Hausman test revealed no endogeneity problem.
Next, we studied the association between WDDS-10 and the nine food groups of the production diversity score (PDS) obtained from family plots and women’s plots, with the following random-effect panel data models:
WDDS-10it = β FCGxi + ui + εit
in which the food crop groups (FCG) listed in table 1 are dichotomous variables, equal to 1 if they are produced and 0 if not.
Finally, we ran three linear multivariate regressions with the same variables as those used in the panel model (1) for the three different data collection periods. All analyses were performed using the software Stata 14 (StataCorp. LP, College Station, TX, USA).
Results
1.6. Women’s dietary diversity
Table 2 shows that the women’s dietary diversity score was low and did not differ significantly according to the season: on average 3.4 (± 1.5) food groups in April 2013, 3.4 (± 1.3) in August 2013 and 3.4 (± 1.3) in February 2014. Out of the sample of women, a mean of only 20% reached the threshold of five food groups consumed out of ten in April and August and only 19% in February.
15
Table 2: Women’s dietary diversity
April 2013 August 2013 February 2014
Dry season Lean season Post-harvest F-test
Sample size 579 402 421
Women’s dietary diversity
Women’s Dietary Diversity Score (WDDS-10) 3.4 (1.5) 3.4 (1.3) 3.4 (1.3) NS
Proportion of women with WDDS-10 ≥ 5 20% 20% 19% NS
Food groups consumed by women
Starchy staples 98% 98% 98% NS
Beans, peas and lentils 15% 16% 11% NS
Nuts and seeds 30% 29% 34% NS
Dairy products 8% 12% 10% NS
Meat, poultry and fish 50% 55% 50% NS
Eggs 4%a 2% 1%a **
Vitamin A-rich leafy vegetables 62%a 73%a 66% **
Vitamin A-rich fruits and vegetables 65%ab 8%a 6%a ***
Other vegetables 10%a 41%a 66%a ***
Other fruits 3%ab 1%a 0.4%a **
Means and standard deviations are given for continuous variables. For categorical data, the percent of categories is given. Values in the same row with the same superscript letter differed significantly from each other at the p<0.05 level, using Pearson’s chi2 test for categorical variables and the Tukey-Kramer test for quantitative variables.
Table 3: Agricultural biodiversity (campaign 2012-13)
Family Farms Women’s plots
Crop diversity indicators*
Production of food crops 100% 37%
Crop count (CC) 3.1 (1.5) 1.5 (0.8)
Simpson’s Diversity Index (SDI) 0.37 (0.2) 0.38 (0.2)
Nutritional Functional Diversity (NFD) 17.5 (12) 5.7 (9)
Production Diversity Score (PDS) 2.2 (1.1) 1.3 (0.8)
Production of starchy staples 99% 32%
Production of beans, peas and lentils 34% 31%
Production of nuts and seeds 38% 60%
Ownership of dairy cows 14% 0.9%
Ownership of laying hens 4% 0.4%
Production of vitamin A-rich leafy vegetables 0% 4%
Production of vitamin A-rich fruits and vegetables 11% 0%
Production of other vegetables 7% 5%
Production of other fruits 11% 0%
Production of cotton 66% 4%
Agroforestry trees on plots 90% 35%
Number of agroforestry tree species (if agroforestry trees on plots=1) 1.6 (0.7) 1.4 (0.5)
Ownership of farm animals 90% 35%
Number of farm animal species 2 (1.1) 1.4 (0.6)
Means and standard deviations are given for continuous variables, percentages for dichotomous variables. *For women, crop diversity indicators only concern women who grew food crops.
16
Almost all women consumed starchy products during the three survey periods. The most consumed groups were vitamin A-rich-leafy vegetables, flesh foods (meat, poultry and fish), other vegetables and nuts and seeds: 67%, 52%, 37% and 31% respectively of women, on average across the three periods, had eaten a food item belonging to these groups during the 24 h recall period. Consumption of beans (14%), dairy products (10%), eggs (2%) or other fruits (1%) concerned a small percentage of women. Three groups of products were more seasonal than others: vitamin A-rich fruits (mainly mango) peaked in April (65% of women had eaten some foods from this group) compared with February or August (only 6%). More leafy vegetables were consumed in August than in the other seasons (73% of women vs. 62% in April); and only 10% of women consumed ‘other vegetables’ in April whereas the percentage was 41% in August and 66% in February. In addition, eggs and other fruits, the least consumed food groups, were more consumed in April (by respectively 4% and 3% of the women) (table 3).
1.7. Agricultural biodiversity
1.7.1. Crops grown in farm fields
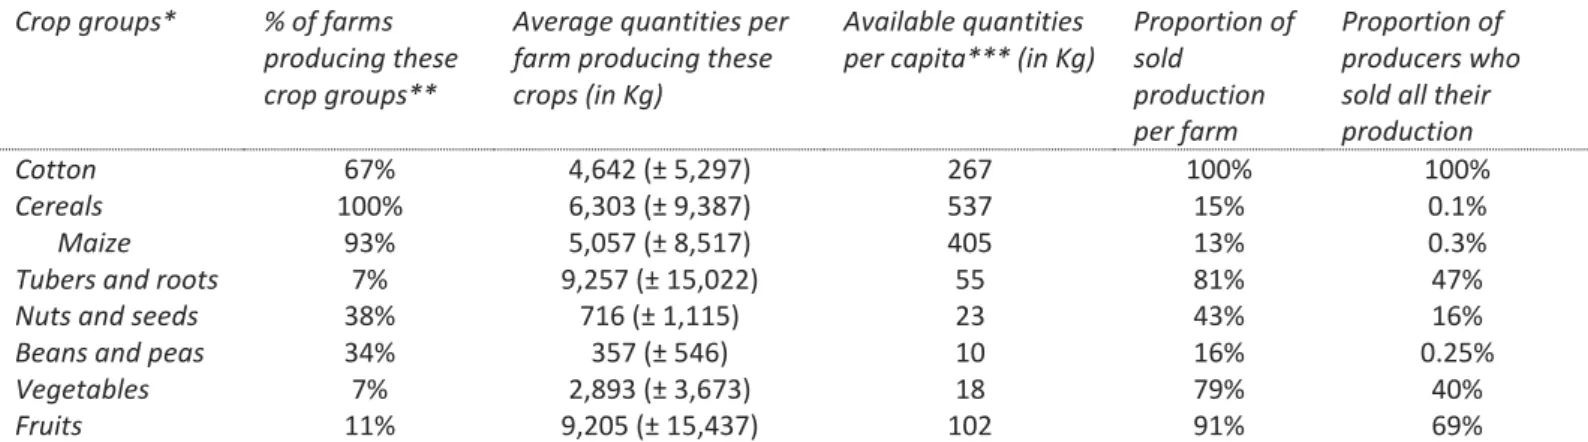
Table 4: Characteristics and uses of food groups produced in family fields (agricultural campaign 2012-13)
Table 4 shows that all the farms produced cereals (6.3 ± 9.3 tonnes on average, mainly for their own consumption) and two-thirds produced cotton (4.6 ± 5.2 tonnes on average) in the family’s fields. In Crop groups* % of farms
producing these crop groups**
Average quantities per farm producing these crops (in Kg)
Available quantities per capita*** (in Kg)
Proportion of sold production per farm Proportion of producers who sold all their production
Cotton 67% 4,642 (± 5,297) 267 100% 100%
Cereals 100% 6,303 (± 9,387) 537 15% 0.1%
Maize 93% 5,057 (± 8,517) 405 13% 0.3%
Tubers and roots 7% 9,257 (± 15,022) 55 81% 47%
Nuts and seeds 38% 716 (± 1,115) 23 43% 16%
Beans and peas 34% 357 (± 546) 10 16% 0.25%
Vegetables 7% 2,893 (± 3,673) 18 79% 40%
Fruits 11% 9,205 (± 15,437) 102 91% 69%
* Detail of crop groups: Cereals: millet and sorghum, maize, rice, fonio; Tubers and roots: yam, sweet potato, cassava; Nuts and seeds: peanut, sesame; Peas and beans: cowpea, voandzou, soybean; Fruits: orange, cashew, banana, mango, papaya, melon and watermelon: Vegetables: onion, green onion, cabbage, tomato, aubergines, chili, green beans, cucumber, bell pepper, okra, zucchini, ginger.
** Concerning the 579 farms surveyed during the first round in April 2013
17
addition, 38% of farms cultivated nuts and seeds (mainly peanuts) and 34% beans (cowpea and Bambara groundnut), in smaller quantity (716 ± 1,115 kg and 357 ± 546 kg, respectively). Only 7% of farms cultivated tubers or roots and 7% vegetables; for both of these crop types, almost 80% of the production was sold. Lastly, 11% of farms, mostly located in Kenedougou, produced orchard’s fruits, mainly for sale.
On average, the farms produced 3.1 (± 1.5) different food crop species, but 47% of farms cultivated maize and another cereal, and 27% maize and two other cereals. The production diversity score (PDS) included 2.2 (±1.1) food groups on average, mainly ‘grains, white roots and tubers’ with ‘nuts and seeds’ or ‘peas and beans’. Simpson’s diversity index and the nutritional functional diversity – on average 0.37 (± 0.2) and 17.5 (± 12) respectively – are more complex to interpret. They are more useful for comparing farms with each other.
18
Crops diversity indicators were strongly correlated with one another (figure 2). Correlation coefficients were lower between Simpson’s Diversity Index (SDI) and others indicators because it is the only one to take into account the quantities produced (SDI-CC: 0.62, SDI-PDS: 0.36 and SDI-NFD: 0.56 vs CC-NFD: 0.9; CC-PDS: 0.78; NFD-PDS: 0.79). Despite the significance of these coefficients, the data points on the scatter-plots are widely spread out.
Even though the production was not very diverse and some food groups were available in smaller amounts per capita (beans and peas, nuts and seeds and vegetables), table 4 suggests that when a food group is produced (fruits excepted), at least a small quantity is usually consumed within the farm. There was a mean of 1.6 (± 0.7) agroforestry food tree species on family plots: all the farms had at least one shea (Vitellaria paradoxa), and 60% had at least one nere (Parkia biglobosa) as well.
Almost all farms heads (90%) owned farm animals, especially poultry, cattle and sheep. On average, farms owned 27 heads of livestock, plus two draught animals. However, only 14% of the farms produced milk, and 4% produced eggs.
1.7.2. Crops grown on women’s individual plots
Among the women surveyed, only 37% managed a field of their own while the majority worked in family fields. Table 3 shows that 60% of the women who produced food crops cultivated nuts and seed (mainly peanuts), 31% beans and peas (mainly cowpea) and 32% cereals (mainly maize or sorghum). In addition, 35% of women had agroforestry trees growing in their personal plots: 1.4 (± 0.5) species on average, especially shea trees. Last, 35% of women owned farm animals, with a mean of 1.4 (+/- 0.6) species, mainly poultry and sheep.
All crop diversity indicators calculated for women’s crops were lower than those managed by male farm heads (CC: 1.5 ± 0.8; PDS: 1.3 ± 0.6; NFD: 5.7 ± 9), except Simpson’s diversity index SDI (0.38 ± 0.2), which remained the same even though the women’s plots were smaller. The women produced fewer crop species but the quantities produced of each were more similar.
19
1.8. Associations between women’s dietary diversity and agricultural biodiversity
Table 5: Panel regression of women’s dietary diversity score (WDDS-10) according to agricultural biodiversity factors (with different crop diversity indicators)
Panel regression Models of WDDS-10 on various crop diversity indicators Model 1:
With the Crop Count (CC)
Model2: With the Production Diversity Score (PDS)
Model 3: With Simpson’s Diversity Index (SDI)
Model 4: With the Nutritional Functional Diversity (NFD)
Crop diversity
In farm plots 0.02 0.11 ** -0.09 0.001
In women’s plots (0/1) -0.14 -0.09 0.06 -0.06
Other variables
Agroforestry tree species
In farm plots (number) 0.23 *** 0.21 *** 0.25 *** 0.24 ***
In women’s plots (0/1) 0.17 0.15 0.08 0.07
Animal species
Managed by male farm heads (nb) -0.05 -0.06 -0.05 -0.05
Managed by women (0/1) -0.12 -0.12 -0.12 -0.12
Production of cotton
In farm plots (0/1) -0.48 *** -0.42 *** -0.5 *** -0.49 ***
In women’s plots (0/1) 0.34 + 0.31 0.34 + 0.36 +
Constant term (intercept) 2.6 *** 2.4 *** 2.6 *** 2.6 ***
Number of observations 1,402 1,402 1,402 1,402
Values shown are coefficients derived from linear three-level mixed models (with individuals and provinces as nested random-effect intercepts), with WDDS-10 as dependant variable. The models (in columns) correspond to regression results depending on the crop diversity indicator used.
We adjusted the models for agricultural income for male farm heads and women, non-agricultural income for male farm heads and for women, size of household, distance to market (in 10 minutes), women’s age (years) and women’s literacy (0/1).
+ p<0.10, * p<0.05, ** p<0.01, *** p<0.001
Results of the mixed models in table 5 show that the production diversity score was the only one associated with a higher women’s dietary diversity score. When an additional food group was produced on family plots managed by the male farm head, women consumed 0.11 (p<0.01) additional food groups. Moreover, women’s dietary diversity was positively and strongly correlated with the presence, in family plots, of agroforestry tree species that provide food products (0.21 to 0.25, p<0.001), regardless of the crop diversity indicator used. However, the number of animal species (excluding draught animals) was not correlated with women’s dietary diversity. Women living on cotton-producing farms had a significantly lower WDDS-10 than others (-0.42 to -0.5, p<0.001). Cotton production in tones was not correlated with agricultural income. In contrast, when women cultivated cotton (except in the regression with PDS), their dietary diversity was higher (0.31-0.36, p<0.1).
20
1.9. Associations between women’s dietary diversity and crop groups derived from the production diversity score
Table 6: Panel regression results of the association between women’s dietary diversity and crop groups produced on the farms or in the women’ fields.
Crop group produced (0/1) Farm fields
Women’s fields
1. Starchy staples 0.7 0.4 **
2. Beans. peas and lentils -0.1 0.1
3. Nuts and seeds -0.01 -0.1
4. Dairy products (ownership of dairy cows) 0.2 * 0.5
5. Flesh food (livestock, exclusive of draught animals) -0.01 -0.07
6. Eggs (ownership of laying hen) 0.4 * -0.2
7. Vitamin A-rich leafy vegetables 0.4
8. Vitamin A-rich fruits and vegetables 0.6 ***
9. Other vegetables 0.1 0.15
10. Other fruits 0.8 ***
Constant 2.5 * 3.4 ***
Sample size 1,527 1,527
Values shown are coefficients derived from a random-effect panel regression, with women’s dietary diversity score as dependant variable. + p<0.10, * p<0.05, ** p<0.01, *** p<0.001
When women lived on farms that produced vitamin A-rich fruits and vegetables, or other fruits, or that kept dairy cows or laying hens, they consumed respectively 0.6 (p<0.001), 0.8 (p<0.001), 0.2 (p<0.05) and 0.4 (p<0.05) additional food groups (table 6). The women’s dietary diversity was improved when they produced starchy staples (mainly maize) (0.4, p<0.01).
1.10. Association between women’s dietary diversity and the production diversity score across seasons
PDS (based on the 2012-2013 agricultural season) was associated with a better WDDS-10 in April 2013 (0.10, p<0.1) and in August 2013 (0.14, p<0.05), but there was no statistically significant association between PDS and WDDS-10 in February 2014 (table 7). WDDS-10 was positively associated with the number of trees species growing in the male farm head’s plots in the three periods surveyed. Cotton production managed by male farm heads was always negatively and strongly associated with women’s dietary diversity, particularly in August (-0.65, p<0.001 vs. -0.31, p<0.05 in April and -0.38, p<0.01 in February), while we controlled for the total value of the agricultural production and other variables.
21
Table 7: Multiple regression results of the association between the women’s dietary diversity score (WDDS-10) and the production diversity score (PDS) in April 2013, in August 2013 and in February 2014
April 2013 August 2013 February 2014
Dry season Lean season Post-harvest
Production Diversity Score (PDS)
For male farm head’s plots (number of groups) 0.10 + 0.14 * 0.04
For women’s plots (0/1) 0.04 -0.04 -0.4
Agroforestry tree species
In male farm head’s plots (number) 0.25 ** 0.21 ** 0.14 +
In women’s plots (0/1) 0.09 0.07 0.23
Livestock species
Managed by male farm heads (number) 0.02 -0.1 -0.07
Managed by women (0/1) -0.19 -0.23 0.12
Production of cotton
In male farm head’s plots (0/1) -0.31 * -0.65 *** -0.38 **
In women’s plots (0/1) 0.31 0.5 0.17
Constant 1.8 *** 2.4 *** 2.7 ***
R² 0.13 0.31 0.15
Sample size 579 402 421
Values shown are coefficients derived from multiple regressions, with WDDS-10 as dependant variable. The columns correspond to regressions in the three seasons.
We adjusted the models for agricultural income for male farm heads and women, non-agricultural income for male farm heads and for women, household size, distance to market (in 10 minutes), women’s age (years) and women’s literacy (0/1). + p<0.10, * p<0.05, ** p<0.01, *** p<0.001
Discussion
1.11.
Women’s dietary diversityWe show that women’s dietary diversity was low in the Hauts-Bassins region and that a large proportion of women (80%) did not reach the MDD-W. These women are more likely to have lower micronutrient intakes than the 20% of women who did reach the MDD-W. Women usually consumed foods that make up the traditional family meal: the tô – a thick paste made from maize flour or another cereal – and a sauce, like elsewhere in West Africa (Bricas and Akindès, 2012). The sauces can be very basic, made from leafy vegetables and condiments or garnished with peanut paste, other vegetables and pieces of fish or meat. Fruits, dairy products, eggs and beans were the least consumed food groups. Women had a better dietary diversity score when they consumed foods from ‘dairy products’, ‘nuts and seeds’ and ‘meat, poultry and fish’ food groups (data not shown).
Our data also show that the mean women’s dietary diversity score did not change significantly over the year (WDDS-10: 3.4, +/- 1.3), while consumption of the different food groups did. The consumption of
22
some food groups depended on their harvesting period. Women consumed (i) vitamin A-rich fruits only during the mango season in April, (ii) more leafy vegetables in August during the rainy season, when it is possible to forage for fresh leaves (baobab, Roselle or okra leaves), and (iii) more ‘other vegetables’ in February, when horticultural crops are harvested (fresh maize, tomatoes, okra and onions).
Other publications have also observed seasonal variations in dietary diversity in Burkina Faso. In the Gnagna region in eastern Burkina Faso, Savy et al. (2006) showed an improvement in mothers’ dietary diversity in September, at the end of the seasonal cereal shortage, in comparison with April, thanks to the availability of legumes, milk, fresh fish and vegetables, which compensate for the decreased consumption of purchased foods. These findings illustrate how food consumption can vary according to location and/or time of the year.
Somé and Jones (2018), working on national data, also observed that in Burkina Faso, and more precisely in the Sudano-Sahelian zone (including the Hauts-Bassins region), household dietary diversity was higher during the lean season than in the post-harvest period due to the availability of leafy vegetables and fruits and continued to increase during the harvest season with the consumption of beans and nuts. The authors reported the beneficial contribution of foraged foods (green leaves and wild fruits) in the diet during the lean season. These results corroborate ours, although the study designs differ in terms of geographical coverage (national vs regional) and of survey instrument (HDDS questionnaire administered as part of a multi-topic survey vs individual questionnaire administered to women only and with special attention to food description). Such differences could affect the interpretation of results. Many studies use secondary data from national-level surveys, for example living standards surveys, which are often the only data available on both agricultural production and food consumption. The integration of reliable and detailed food consumption data into these national surveys would make it easier to obtain more robust results and help improve this area of research (Verger et al. 2019).
1.12. Agricultural biodiversity and dietary diversity
We showed that a higher crop diversity, measured with the production diversity score, was linked to a higher dietary diversity for women who lived on farms. When one additional food group was produced
23
on family fields, women’s dietary diversity increased by 0.11 (p<0.01). Although this effect may seem low, this result means that on average one additional food group was consumed every 9 days. This can make a difference, for example between women who eat meat once every 9 days versus very rarely. There are three main possible explanations for linkages between PDS and WDDS-10. First, the existing production diversity score was low, with an average of only 2.2 (+/- 1) food groups cultivated on farms, increasing its association with women’s dietary diversity (Jones 2017). Unlike the diversity indicators for other crops, PDS includes animal by-products. However, even when PDS did not take into account eggs nor dairy products, it was still associated with WDDS-10 (0.09, p<0.05 in the panel regression and 0.12, p<0.05 in the linear regression in May, results not shown). Second, food consumption partly depended on the production on-farm. Cereals, which formed the staple of women’s daily diet, were produced on almost all farms for domestic consumption. In addition, the least frequent food groups (fruits, vitamin A-rich fruits and vegetables, eggs and dairy), when they were produced, were positively associated with their consumption (results not shown) and with a greater dietary diversity (table 5). Indeed, when a food group – whether cash crop or not - was produced on the farm, at least a small proportion was consumed by members of the household (table 4) and this could have been sufficient to increase women dietary diversity. The only exception concerned the fruits produced, which were entirely sold by 69% of producers. Indeed, mangoes grown in orchards (50% of the fruit production) were not consumed because ‘semi-wild’ mango trees are plentiful, and cashews (35% of the fruit production) require considerable processing before consumption. Even if some products are not consumed, crop diversification can lead to higher dietary diversity through increased income (Herforth, 2010). The third possible explanation is that markets were not very effective for supplying rural households with a regular, accessible, and diverse range of food products (Somé and Jones 2018), and most farmers still relied on their own production to meet their family’s consumption needs.
In addition to crops, benefiting from agroforestry tree species that provide food was strongly correlated with higher WDDS-10. Gathering was an important source of leafy vegetables (baobab leaves), fruits (mango, wild grapes, shea fruits), nuts (nere) and edible insects (shea caterpillars). In April, two-thirds
24
of the women living on farms where there was at least one agroforestry tree species consumed fruits and/or leafy vegetables, compared with 51% of the other women (p<0.05). Only a few studies have shown the importance of trees in food and micronutrient intakes (Blaney et al. 2009 in Gabon; Powell et al. 2013 in Tanzania). Boedecker et al. (2014) in Benin also observed that women who consumed wild edible plants had better dietary diversity scores than others. These authors also underlined that these plants are consumed in addition to other food items and not as replacements.
The availability of crops or gathered products varied with the season. Both PDS and agroforestry tree species were mainly associated with WDDS-10 in April and in August 2013. This seasonal effect can be explained by the fact that the production of ‘vitamin A-rich fruits and vegetables’, ‘other fruits’ and ‘other vegetables’ was mostly correlated with WDDS-10 in April and August (results not shown). Specifically, in April, garden products were available and the mango season was starting, and in August, during the rainy season, okra, fresh maize and most foods provided by agroforestry trees were harvested. In addition, in February, after the harvest of rain-fed crops, we observed less inequality among farms regarding access to diverse foods. These seasonal variations show that the period of data collection can mask or, on the contrary, emphasise linkages between agricultural biodiversity and dietary diversity: in many contexts, harvests are seasonal and only few conservation methods are available for perishable crops.
Even though half the women surveyed consumed flesh foods (meat, poultry and/or fish), the number of farm animal species (excluding draught animals) was not associated with their dietary diversity. Similarly, no association was observed with livestock as a dichotomous variable, nor with the number of animals. Flesh foods consumed by women, mainly dried fish or a piece of meat, were purchased. Animals raised on the farm tended to be considered as capital that could be sold when cash was needed, and they were consumed or used as gifts on special occasions only.
1.13. Linkages between dietary diversity and crop diversity
In our case study, PDS was the only indicator of crop diversity associated with WDDS-10. The three other indicators, all derived from ecological tools to measure biodiversity in natural areas, were not.
25
There are several possible explanations. Crop count and Simpson’s diversity index reflect the biodiversity and/or the agronomic diversity of plots and take no account of the different nutritional characteristics of crops: several crops can belong to the same food group. More particularly, almost all farms produced cereals, 47% produced two cereals and 27% grew three or more cereal species, and most rural people eat cereals every day. Growing several cereal species thus improved the two above-mentioned crop diversity indicators but not the dietary diversity. This is also why Somé and Jones (2018) found that, in Burkina Faso, CC did not modify the seasonal variations in household dietary diversity, even though the two variables was positively associated. However, CC indicators, which do not consider the nature of crops, are often misinterpreted. Many authors consider, explicitly or not, that each crop is nutritionally different from the others. As explained in the letter from Berti (2015) to Sibhatu et al. (2015), two equal CCs can have different nutritional values. A CC of two composed of two cereals is nutritionally different from another combining a cereal and a vegetable. Simpson’s diversity index is more complex to interpret because it can increase if farms produce an additional crop and/or if crops are grown in more similar amounts. As explained in the methods, many studies used the surface area of land allocated to each crop. To us, this way of estimating the relative amount produced of each crop seems imprecise, given that several crops can be grown together on the same plot and/or planted at different densities. In addition, products such as livestock, wild plants or trees are often not managed or grown in dedicated areas. It is thus difficult to compare one hectare of maize with one hectare of orange orchard in terms of the amount of food made available. Although our choice to use produced quantities expressed as dry matter does decrease this bias, we are quite aware that a kilogram of maize is not equivalent to a kilogram of peanuts.
In contrast, nutritional functional diversity indicators take into account the nutritional functionalities of crops. However, NFD indicators and WDDS-10 are not constructed according to the same logic. While WDDS-10 is a simple count of food groups, in which foods are grouped according to their nutritional characteristics but with no other calculations, our NFD indicator was based on the extent to which the needs in 17 different nutrients were covered (Remans et al. 2011). This is why in the classification tree
26
used to calculate the NFD indicator (figure 1) the food groups are different from those used in the WDDS-10. However, the NFD indicator remains complex to construct as much as to interpret.
Logically, the statistical association is more easily established between PDS and WDDS-10 since they are built in the same way and on the same food groups. More specifically, the PDS has the merit of (i) not overestimating the nutritional diversity of the production (given that two crops belonging to the same group are only counted once) and (ii) being easy to calculate and interpret. In our opinion, the letter from Berti (2015) marked a new way of perceiving agricultural biodiversity indicators. The author concluded that nutritionists enhance the diversification of agricultural production through the production of various food groups. However, even though this indicator is relevant for measuring production diversity from a nutritional perspective, it also has its limitations. Contrary to SDI and NFD, it does not take quantities into account. In addition, just as there are different dietary diversity scores, there are also different PDSs, with different meanings that depend on the number of food groups chosen (mainly 7, 9, 10 or 12 groups). To this date, no standardised indicator has been described or validated that could serve as a reference in this area of research. Empirically, in three out of the four studies described in the introduction that used both CC and PDS, dietary diversity scores (of children or households) were more markedly associated with PDS than with CC (Jones 2016; Koppmair et al. 2017; Mulmi et al. 2017; Sibhatu and Qaim 2018b). Only Kumar et al. (2015) found that CC was more closely associated with the minimum dietary diversity for children (at least four food groups consumed out of seven) than PDS - but the authors used quintiles of CC.
Research on the relationships between agricultural biodiversity and dietary diversity in farm households mobilises both agronomic and nutritional concepts. To truly understand their linkages, we need reliable indicators of both dietary diversity and agricultural biodiversity. Current production diversity indicators, however, only consider part of the production system and focus on agricultural products more than on functionalities in terms of diet and dietary diversity, and hence nutritional quality of the foods produced. Regarding the diversity of the production managed by women, none of the dichotomous crop diversity indicators (nor non-dichotomous indicators, results not shown) were associated with the women’s
27
dietary diversity. Only a third of the women surveyed owned a plot, and the plots they owned were tiny. All the dependent household members, women as well as the children and brothers of the male farm head, worked on the family plot before working on their own (Chia et al. 2006). However, they had the potential to increase the household’s dietary diversity with agricultural and/or gathering activities of their own.
1.14. Linkages between dietary diversity and cotton production
Cotton production managed by male farm heads was negatively and strongly correlated with WDDS-10. There can be several explanations for this result. First, food crops compete with cotton for land and labour: harvesting cotton and sowing horticultural crops take place during the same period, and most cultivated land is shared between cotton and maize. Unlike other food cash crops, of which a small proportion is consumed on the farm, cotton is not an edible crop (except cottonseed oil, which is not included in the 10 food groups of WDDS-10). Cotton production on large plots can also threaten ‘food trees’ in agroforestry parks because standing trees hinder specialisation and mechanisation. Cooper and West (2017) observed that in Sikasso, a Malian region close to the Hauts-Bassins, cotton production is associated with a decrease in tree species richness and with malnutrition at the village level.
In addition, cotton represented 50% of the value of farm sales on average, equivalent to 488,000 CFA francs (± 100,000) (US$1 928 in purchasing power parity). However, the per capita agricultural income of cotton producers was not higher than that of other farmers, on average, because some farmers derived a very substantial income from the sale of fruits and/or vegetables. Moreover, the income obtained from cotton sales did not appear to be used for purchasing more diverse foods. Other studies showed that, even if cotton is an important source of income, cropping cotton can have negative effects on diet and child nutrition because the cotton industry upsets the balance of power on farms in favour of men, and income from cotton is mainly held by men (Carney and Watts 1991; Kelly et al. 2004).
On the contrary, women who grew cotton (only 4% of women did in our sample) tended to have a higher WDDS-10 than women who did not (Table 5). This shows that how income from the sale of cotton or other cash crops is spent depends on individual consumption preferences. Many authors have also shown
28
that decision-making power and control over resources by women were associated with a larger share of the income spent on food (Doss 2006; Duflo and Udry 2004; Hoddinott and Haddad 1995; Quisumbing and Maluccio 2003) and with greater individual dietary diversity (Malapit et al. 2015).
1.15. Specialisation of agricultural systems at the expense of crop diversity
Both agricultural biodiversity and dietary diversity remained low in our study and were interlinked. In western Burkina Faso, the problem is that public policies have oriented production systems towards commercial agriculture specialised in cotton-maize, with a certain success for both these crops. Maize is cultivated on 93% of farms and, in 2012, provided 405 kg of dry maize per capita on the farms (table 4), more than twice what is needed for food self-sufficiency, which is set at 190 kg per capita per year (Cilss 2004). The production of cotton in the region represents 40% of the national production of Burkina Faso, which is the greatest cotton producer in sub-Saharan Africa. For decades, most investments and extension services provided under agricultural policies only concerned these two crops.
As a result, nutrient-dense crops have not been encouraged and production diversity is quite low. The 2.2 food groups produced by individual farms always included starchy staples (often maize) alongside another group, often an oleaginous crop (peanuts) or legumes (cowpeas). Only a few farms grew fruits and vegetables (4%, 7% and 11% of farms mentioned they cultivated vitamin A-rich fruits and vegetables, other vegetables and other fruits, respectively, in the 2012-2013 survey campaign) or animal by-products (only 14% of farms owned dairy cows and 4% kept laying hens). In our sample, the least available crop groups, such as beans and peas, other vegetables, and nuts and seeds (representing 10, 18, and 23 kg available per capita respectively during the 2012-13 season, table 4), were consumed by a few women only.
This lack of crop diversification negatively affects the diversity of the food available for consumption on the farm and of the food available for purchase at local markets. Due to a lack of infrastructure and a poor system of transportation to supply diverse foods to remote rural areas, local production mostly supplies local markets (Somé and Jones 2018). In addition, according to the last report on The State of Food Security and Nutrition in the World (Herforth et al. 2020), these foods are often the most
29
expensive, and 57% of the population in sub-Saharan Africa cannot access healthy food due to lack of means. Financial or technical support for agricultural diversification, production of nutritious food groups (such as fruits, vegetables, dairy products or eggs) and nutrient-dense crops could therefore be a way to improve dietary diversity for farmers, even at the local scale (Adjimoti and Kwadzo 2018).
Conclusion
In this study, we showed that the diversity of food groups consumed by women was associated with the diversity of those produced on farms, as reflected by the production diversity score, and with the number agroforestry tree species women have access to. Our results thus shed light on the debate about linkages between agricultural biodiversity and dietary diversity by showing that these linkages at least partly depend on how farming diversity is measured. Indeed, production diversity indicators used in the literature, mostly derived and adapted from ecology, assess various dimensions of agricultural production but were not specifically developed to highlight the potential of agricultural biodiversity for improving food and nutrition security. Another interesting result of our study was that cotton production was found to be negatively or positively associated with women dietary diversity depending on whether it was managed by men or women, respectively. This suggests that the linkages between cotton production and dietary diversity depend on individual preferences for allocating income from cotton sales.
Finally, while in Burkina Faso national agricultural policy mostly supports mass production of cotton and maize, as sources of income and calories, in our study the dietary diversity of women remained low. More attention should be paid to the nutritional quality of agricultural production, by supporting production of nutrient-dense crops, such as vegetables, fruits, beans or animal by-products, and to the access to agroforestry trees, that are altogether able to improve and stabilize the farmers’ diet over the year.
30
References
Adjimoti, G. O., & Kwadzo, G. T.-M. (2018). Crop diversification and household food security status: evidence from rural Benin. Agriculture & Food Security, 7(1), 82. https://doi.org/10.1186/s40066-018-0233-x
Arsenault, J. E., Nikiema, L., Allemand, P., Ayassou, K. A., Lanou, H., Moursi, M., et al. (2014). Seasonal differences in food and nutrient intakes among young children and their mothers in rural Burkina Faso. Journal of nutritional science, 3.
Bellon, M. R., Ntandou-Bouzitou, G. D., & Caracciolo, F. (2016). On-Farm diversity and market participation are positively associated with dietary diversity of rural mothers in Southern Benin, West Africa. PloS one, 11(9), e0162535. https://doi.org/10.1371/ journal.pone.0162535 Berti, P. R. (2015). Relationship between production diversity and dietary diversity depends on how
number of foods is counted. Proceedings of the National Academy of Sciences, 112(42), E5656– E5656.
Bhagowalia, P., Kadiyala, S., & Headey, D. (2012). Agriculture, income and nutrition linkages in India: Insights from a nationally representative survey. (Technical report). Washington DC: The
International Food Policy Research Institute.
http://researchonline.lshtm.ac.uk/id/eprint/1440436
Blaney, S., Beaudry, M., & Latham, M. (2009). Contribution of natural resources to nutritional status in a protected area of Gabon. Food and nutrition bulletin, 30(1), 49–62.
Boedecker, J., Termote, C., Assogbadjo, A. E., Van Damme, P., & Lachat, C. (2014). Dietary contribution of Wild Edible Plants to women’s diets in the buffer zone around the Lama forest, Benin–an underutilized potential. Food Security, 6(6), 833–849.
Bogard, J. R., Marks, G. C., Wood, S., & Thilsted, S. H. (2018). Measuring nutritional quality of agricultural production systems: Application to fish production. Global food security, 16, 54– 64.