HAL Id: hal-02619451
https://hal.inrae.fr/hal-02619451
Submitted on 25 May 2020HAL is a multi-disciplinary open access archive for the deposit and dissemination of sci-entific research documents, whether they are pub-lished or not. The documents may come from teaching and research institutions in France or abroad, or from public or private research centers.
L’archive ouverte pluridisciplinaire HAL, est destinée au dépôt et à la diffusion de documents scientifiques de niveau recherche, publiés ou non, émanant des établissements d’enseignement et de recherche français ou étrangers, des laboratoires publics ou privés.
Distributed under a Creative Commons Attribution - NonCommercial| 4.0 International License
To clean or not to clean phenotypic datasets for outlier
plants in genetic analyses?
Santiago Alvarez Prado, Isabelle Sanchez, Llorenç Cabrera Bosquet, Antonin
Grau, Claude Welcker, Francois Tardieu, Nadine Hilgert
To cite this version:
Santiago Alvarez Prado, Isabelle Sanchez, Llorenç Cabrera Bosquet, Antonin Grau, Claude Wel-cker, et al.. To clean or not to clean phenotypic datasets for outlier plants in genetic analyses?. Journal of Experimental Botany, Oxford University Press (OUP), 2019, 70 (15), pp.3693-3698. �10.1093/jxb/erz191�. �hal-02619451�
Journal of Experimental Botany, Vol. 70, No. 15 pp. 3693–3698, 2019 doi:10.1093/jxb/erz191 Advance Access Publication 25 April, 2019
This paper is available online free of all access charges (see https://academic.oup.com/jxb/pages/openaccess for further details)
© The Author(s) 2019. Published by Oxford University Press on behalf of the Society for Experimental Biology.
This is an Open Access article distributed under the terms of the Creative Commons Attribution Non-Commercial License (http://creativecommons.org/licenses/ by-nc/4.0/), which permits non-commercial re-use, distribution, and reproduction in any medium, provided the original work is properly cited. For commercial re-use, please contact journals.permissions@oup.com
Viewpoint
To clean or not to clean phenotypic datasets for outlier
plants in genetic analyses?
Santiago Alvarez Prado1,†,*, , Isabelle Sanchez2, Llorenç Cabrera-Bosquet1, , Antonin Grau1,‡, Claude Welcker1, , François Tardieu1,*, and Nadine Hilgert2
1 LEPSE, Université de Montpellier, INRA, Montpellier SupAgro, Montpellier, France
2 MISTEA, Université de Montpellier, INRA, Montpellier SupAgro, Montpellier, France
† Present address: IFEVA - CONICET, Av. San Martín 4453 (C1417DSE), Ciudad de Buenos Aires, Argentina
‡ Present address: UE DIASCOPE, INRA, Montpellier SupAgro, Université de Montpellier, Montpellier, 34060, France
* Correspondence: francois.tardieu@inra.fr or psalvare@agro.uba.ar
Editor: Christine Raines, University of Essex, UK
Based on case studies, we discuss the extent to which genome-wide association studies (GWAS) are affected by outlier plants, i.e. those deviating from the expected distribution on a multi-criteria basis. Using a raw dataset consisting of daily measurements of leaf area, biomass, and plant height for thousands of plants, we tested three different cleaning methods for their effects on genetic analyses. No-cleaning resulted in the highest number of dubious quantitative trait loci, especially at loci with highly unbalanced allelic frequencies. A trade-off was identified between the risk of false-positives (with no-cleaning and/ or a low threshold for minor allele frequency) and the risk of missing interesting rare alleles. Cleaning can lower the risk of the latter by making it possible to choose a higher threshold in GWAS.
An outlier is usually defined as an observation considered to be inconsistent with the distribution of values in the dataset being analysed (Barnett and Lewis, 1994). Observations may be time-points (Grubbs, 1950) or whole time-courses of one or more variables (Hubert et al., 2015). The concept can be extended to ‘outlier plants’, defined here as biological replicates that deviate from the overall distribution of plants on a multi-criteria basis, regardless of the quality of measurements. For example, outlier plants can originate from poor seed quality, from wrong geno-type identification, or from fertilization of ovaries by undesired pollen, for example generating a hybrid instead of an inbred line, which can have a large effect if the hybrid is derived from lines with high consanguinity. In field experiments, outlier plants have a low impact on genotypic means because the ex-perimental units (the smallest entity to which a treatment can be applied; http://www.miappe.org) are microplots containing
tens of plants (Tollenaar et al., 1984). In phenotyping plat-forms with hundreds of genotypes, and also in many other experiments in controlled conditions, the experimental unit is frequently an individual plant with 3 to 10 replicates per geno-type, so the presence of one or more outlier plants may have a high impact on genotypic means (Estaghvirou et al., 2014).
Whilst numerous methods have been developed for detecting outlier points, involving either individual (Grubbs, 1950; Utz, 2003; Rousseeuw and Hubert, 2011) or multiple traits (Reimann et al., 2008; Rousseeuw and Hubert, 2011;
Hubert et al., 2015), the detection of outlier plants is, to our knowledge, still in its infancy. This is probably because the con-cept of an outlier is less straightforward in plants because it in-volves a reasoning based on a multiplicity of criteria. Statistical methods based on individual traits are reproducible for a given experiment, but they may exclude different plants depending on the considered trait, resulting in different final trait-specific datasets for each variable. Multi-trait methods based on multi-variate procedures can avoid this problem but they are com-plex to handle and, in our experience, result in non-satisfactory results if traits are not weighted based on expert rules. Visually removing outlier plants based on expert intuition is the most used method, and can result in similar accuracy compared with statistical methods (Bernal-Vasquez et al., 2016). However, criteria for visual elimination can appreciably differ between experimenters. Moreover, whereas visual cleaning can be per-formed in small datasets, it becomes nearly impossible when thousands of time-courses need to be analysed.
In addition, issues other than the significance of statistical tests on the variable of interest need to be considered for out-lier plants. Indeed, the benchmark in this case is rather the degree to which each method affects the results of genetic
3694 | Prado et al.
analyses. In genome-wide association studies (GWAS), a causal polymorphism (quantitative trait locus, QTL) is considered significant if the values of the studied variable (e.g. leaf area) differ significantly between genotypes carrying alleles A or B at the considered marker on the genome. Because the detection of outliers may interact with allelic frequencies at this QTL, we aimed to identify in which cases the detection of outlier plants may or may not affect the results of genetic analyses. To this end, as a case study, we compared the outputs of a gen-etic analysis of a raw dataset consisting of daily measurements of leaf area, biomass, and plant height for thousands of plants with those of datasets based on the same experiments but re-sulting from three different cleaning methods, namely visual elimination based on the experimenter’s expertise, a statistical semi-automated method based on single traits, and a statistical composite multi-trait method combined with expert rules (see Supplementary Protocol S1 at JXB online). The dataset (Alvarez Prado et al., 2018) consisted of a diversity panel of 254 maize hybrids growing in three experiments (Spr12, Spring 2012; Win13, Winter 2013; and Spr13, Spring 2013) with two irrigation treatments (WW, well-watered; and WD, water def-icit treatments) (Supplementary Table S1). Each experiment involved 1680 plants in an image-based phenotyping plat-form located in a greenhouse (see Supplementary Protocol S1;
https://www6.montpellier.inra.fr/lepse/M3P).
Different cleaning methods provide
markedly different lists of plant outliers
In the visual method, outlier plants were identified and tagged by the experimenter based on expert criteria. The statistical single-trait method was performed for each trait individually, meaning that distinct outlier datasets associated with each con-sidered trait were obtained. The composite statistical method was based on a multi-trait approach with expert rules that considered two categories of potentially outlier plants, namely plants that were apparently too small or too large. For the de-tection of unexpectedly small plants that probably have physio-logical disorders, the progression of leaf stages was considered in addition to the time-course of shoot biomass. Indeed, leaf appearance rate carried non-redundant information compared with biomass (r=0.49, 0.26, and 0.30 in Exp. Win13, Spr13, and Spr12, respectively). It usually presents low plant-to-plant vari-ability except in case of severe disorders, and is relatively in-sensitive to environmental cues other than temperature, which was already taken into account via the use of thermal time (Parent et al., 2010, 2019). A small plant, which would be diffi-cult to classify as an outlier based on biomass alone because of the continuous distribution of values, was identified by com-bining the biomass information with that of progression of leaf stages for which one plant unambiguously differed from the others (Box 1A). For the detection of unexpectedly large plants, potentially associated with wrong genotype identifica-tion, combining plant height and biomass resulted in an effi-cient identification, as illustrated in Box 1B and revealed by the statistical approach (see Supplementary Protocol S1 for details). When comparing the three methods, a trade-off appeared between the resulting heritability and the rate of outlier
exclusion. The statistical composite method increased her-itability by only 1% for biomass, leaf area, and plant height compared with the raw dataset (Supplementary Tables S2, S3), but it was the most parsimonious with only 0–2.2% of plants identified as outliers depending on the experiment. The statis-tical single-trait method increased heritability by 8.0, 9.5, and 4.3% for biomass, leaf area, and plant height, respectively, but with higher rates of exclusion (0–4.3%). The visual method re-sulted in the highest heritability, which was increased by 10.0, 11.0, and 6.2% for the same three traits compared with the raw dataset, at the cost of a high rate of exclusion (3–12.2%). The plants that were identified differed among the methods (Supplementary Table S4), so appreciably different datasets were generated by each one. Hence, the increase in heritability cannot be considered as the unique benchmark for ranking the effectiveness of the cleaning methods.
Exclusion of outlier plants strongly affects
the results of genetic analyses
Genome-wide association studies were performed on indi-vidual traits for each combination of experiment × water treat-ment (Supplementary Protocol S1, Supplementary Table S5). The cleaning method had a large effect on the distribution of allelic effects at QTLs identified in all the tested datasets. This is exemplified in Box 2 for one QTL of leaf area on chromo-some 10 that was identified in Exp. Win13_WD. Appreciably unbalanced allelic frequencies were observed at this marker (236 versus 18 genotypes for alleles A and B, respectively), which were nevertheless acceptable in GWAS analyses (7%, for a commonly accepted threshold of 5%). The range of pheno-typic values was large for both allelic groups, from 0.1–0.45 m2 for allele A and from 0.05–0.4 m2 for allele B (Box 2A). In
the absence of cleaning, six hybrids carrying allele B had low genotypic means because of plants with low leaf area (Box 2B), so the QTL was found to be significant (log10P-value=5.7).
The statistical single-trait method resulted in the same output (log10P-value=5.3). In contrast, visual cleaning resulted in a
non-significant QTL (log10P-value=0.139) after elimination
of 45 plants with low leaf area, in particular plants of geno-types carrying allele B. The composite statistical method elim-inated only 15 plants, but also resulted a in a non-significant QTL (log10P-value=3.44). Interestingly, this specific QTL was
found to be non-significant in Exp. Win13_WW, Spr12_WW and WD, and Spr13_WW and WD regardless of the method used (Supplementary Table S5). Hence, the QTL identified in Exp. Win13_WD with either no cleaning or with the statistical single-trait method is likely to be an artefact. Notably, the dif-ferences in significance between methods were not linked to the size of samples involved in the GWAS, because the cleaning methods affected the values but not the number of genotypic means (254 in all cases).
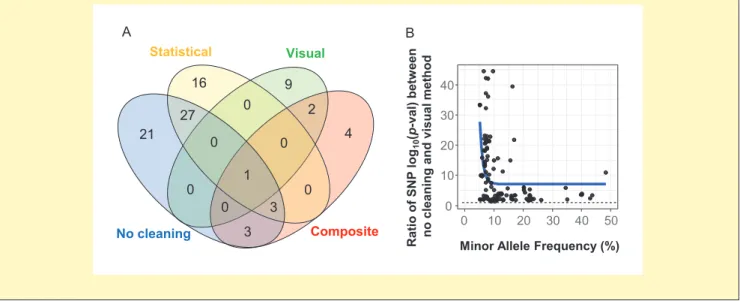
At the whole-genome level, a considerably higher number of QTLs was observed in the raw dataset compared with those that were cleaned, in which many QTLs disappeared at gen-omic positions with highly unbalanced allelic frequencies (Box 3B, Supplementary Table S5). Indeed, 55 QTLs of leaf area were detected without cleaning, 47 with the statistical
single-traits method, 13 with the composite method, and 12 with the visual method (Box 3A; Supplementary Table S5). The difference between methods depended on allelic frequen-cies, but was still appreciable for some QTLs displaying more than 15% of minor allele frequency (Box 3B).
When and where do cleaning methods
affect the outputs of GWAS analyses?
The above results suggest that the method for managing out-liers can cause a ‘QTL×Method interaction’ in the same way as
Box 1. An example of multi-trait detection with expert rules
(A) Detection of plants that probably have physiological disorders. Detection based on the time-course of biomass only is difficult because of the continuous distribution of values, whereas considering it together with leaf appearance rate allows unambiguous identification (red points). Here, the plant architecture itself would not provide any extra information (images). (B) Detection of plants that probably have different genotypes. Detection based on biomass only is ambiguous, whereas combining it with plant architecture (height) identifies the plant represented by the red dots. The data are from six replicates in one experiment for one genotype.
3696 | Prado et al.
multiple environments generate a QTL×Environment inter-action (Malosetti et al., 2013). Intuitively, cleaning methods may be seen as aiming to obtain more numerous and more precise QTLs. On the contrary, the results presented here sug-gest that excluding outlier plants instead serves to avoid the detection of artefact QTLs. For every potential QTL, an arte-fact is most likely to occur for lowest numbers of genotypes carrying the minor allele, as suggested by Box 2. Because GWAS involve hundreds of thousands of markers over the genome, with varying allelic frequencies between markers, an accumulation of outlier trait values is bound to occur at some markers for the minor allele. This causes an artefact QTL at the corresponding marker position. The number of such problematic markers depends on the total number of genotypes in the panel, but also on the threshold, chosen in all GWAS methods, for the frequency of the minor allele below which a marker is excluded. A high number of non-eliminated outliers has relatively low consequences on the
detection of artefact QTLs if the studied population is large (e.g. >400 genotypes) and/or if a high threshold eliminates markers with unbalanced allelic frequencies, as suggested by
Box 3B. Elimination of outliers becomes essential if the popu-lation is smaller and/or if researchers are interested by rare alleles with unbalanced allelic frequencies (Yang et al., 2010;
Ingvarsson and Street, 2011).
Large trades-off associated with each cleaning method therefore appeared between the increase in heritability, the rate of outlier exclusion, and the risks of either identifying artefact QTLs or missing real QTLs. The consequences of no cleaning (which may tend to generate false-positives) may be counteracted by the choice of a higher threshold for minor al-lele frequency, itself associated with a decreased power of QTL detection. Conversely, a high rate of plant exclusion, observed here using a visual method, is a problematic feature in any analysis but it may allow a lower threshold for minor allele fre-quency to be chosen. The composite multi-trait method that
Box 2. The method used for data cleaning affects the apparent allelic effects on leaf area at a given genomic position
(A) The leaf area of plants carrying alleles A and B at a QTL detected in experiment Win13_WD, either in the absence of cleaning, or with visual cleaning, single-trait statistical cleaning, or a composite multi-trait method for cleaning. Note that the plants considered as outliers (blue) differ in number between the methods. (B) The mean leaf area of genotypes carrying each allele. The mean values differ between methods for a given hybrid because they were obtained from non-outliers (red points in A). ns, non-significant; and * significant. The log10P-values
were 5.7, 0.1, 3.4, and 5.3 for no cleaning, visual, composite, and statistical single-trait methods, respectively. The threshold for considering a QTL as significant was 5. Allelic effects are calculated for SNP952509 on chromosome 10.
minimized the rate of outlier exclusion, but also the number of potentially artefact QTLs, appeared to be a promising op-timum in the dataset presented here.
The choice of one method or another thus depends on an optimization of criteria and on strategic decisions for genetic analyses. Attempting to standardize this choice, for instance with regards to placing data in repositories (Ćwiek-Kupczyńska
et al., 2016), may lead to interminable discussions whose
rele-vance probably depends on specific questions and datasets. In any case, the method of outlier identification, or its absence, is an essential criterion in GWAS analyses. Datasets should be organized and stored in such a way that they can be re-analysed either by the same group some years later in the light of fur-ther results, or by different groups (Wilkinson et al., 2016). This requires that detected outliers are identified as such but are not deleted in the information system, and that the rules for outlier detection are kept as meta-data of the GWAS analysis. Recent information systems for phenomic data allow these two condi-tions to be fulfilled (Neveu et al., 2019).
Keywords: Allele frequency, genetic analysis, outliers, phenomics,
quantitative trait loci, statistical analysis.
Supplementary data
Supplementary data are available at JXB online.
Protocol S1. Details of the three methods used for outlier detection in our case study.
Table S1. Basic details of the experiments included in the case study.
Table S2. Summary of results for the different cleaning methods when applied to data for leaf area.
Table S3. Summary of results for the different cleaning methods when applied to data for plant height and biomass.
Table S4. Number of common outliers between the three cleaning methods for leaf area, biomass, and plant height.
Table S5. Complete set of QTLs detected for biomass, plant height, and leaf area.
Acknowledgements
This work was supported by the European Union Framework Program 7 ‘Drought-tolerant yielding plants’ (DROPS) project (FP7-KBBE-244374); the ‘Infrastructure Biologie Santé’ Phenome supported by the National Research Agency and the ‘Programme d’Investissements d’Avenir’ (PIA) (ANR-11-INBS-0012), and by the UE H2020
pro-ject No 731013 (EPPN2020). SAP was funded by the European Union’s
Seventh Framework Program under grant agreement no. FP7-609398, through the award of an AgreenSkills+ fellowship. We are grateful to Stéphane Berthézène, Nicolas Brichet, Thomas Laisné, Vincent Nègre, Carine Palaffre, Pauline Sidawy, and Benoît Suard for their help in con-ducting the experiments.
References
Alvarez Prado S, Cabrera-Bosquet L, Grau A, Coupel-Ledru A, Millet EJ, Welcker C, Tardieu F. 2018. Phenomics allows identification
of genomic regions affecting maize stomatal conductance with conditional effects of water deficit and evaporative demand. Plant, Cell & Environment
41, 314–326.
Barnett V, Lewis T. 1994. Outliers in statistical data. New York: John Wiley.
Box 3. QTL detection using datasets originating from different methods as a function of the allelic frequency at the considered genomic position
(A) Venn diagram showing the number of QTLs for leaf area detected without cleaning, with statistical single-trait cleaning, with visual cleaning, or with the composite multi-trait method of cleaning. (B) The relationship between the frequency of minor alleles at the 55 QTLs detected in our case study and the effect of the cleaning method on QTL significance, estimated by the ratio of the log10(P-value) of the considered QTLs detected in the datasets
with either no cleaning or with visual cleaning. An exponential decay, y ~ exp(–x), was fitted to the data in order to represent the trend (blue line).
B A 0 10 20 30 40 0 10 20 30 40 50
Minor Allele Frequency (%)
Rati oo f SNP log 10 (p -val) betw een no cleaning and visual method 16 9 0 2 4 0 1 0 3 0 27 21 0 0 3 Statistical Visual Composite No cleaning
3698 | Prado et al.
Bernal-Vasquez AM, Utz HF, Piepho HP. 2016. Outlier detection
methods for generalized lattices: a case study on the transition from ANOVA to REML. Theoretical and Applied Genetics 129, 787–804.
Ćwiek-Kupczyńska H, Altmann T, Arend D, et al. 2016. Measures for
interoperability of phenotypic data: minimum information requirements and formatting. Plant Methods 12, 44.
Estaghvirou SB, Ogutu JO, Piepho HP. 2014. Influence of outliers on
ac-curacy estimation in genomic prediction in plant breeding. G3 4, 2317–2328. Grubbs FE. 1950. Sample criteria for testing outlying observations. Annals
of Mathematical Statistics 21, 27–58.
Hubert M, Rousseeuw PJ, Segaert P. 2015. Multivariate functional outlier
detection. Statistical Methods & Applications 24, 177–202.
Ingvarsson PK, Street NR. 2011. Association genetics of complex traits
in plants. New Phytologist 189, 909–922.
Malosetti M, Ribaut JM, van Eeuwijk FA. 2013. The statistical analysis of
multi-environment data: modeling genotype-by-environment interaction and its genetic basis. Frontiers in Physiology 4, 44.
Neveu P, Tireau A, Hilgert N, et al. 2019. Dealing with multi-source and
multi-scale information in plant phenomics: the ontology-driven phenotyping hybrid information system. New Phytologist 221, 588–601.
Parent B, Millet EJ, Tardieu F. 2019. The use of thermal time in plant
studies has a sound theoretical basis provided that confounding effects are avoided. Journal of Experimental Botany 70, 2359–2370.
Parent B, Turc O, Gibon Y, Stitt M, Tardieu F. 2010. Modelling
temperature-compensated physiological rates, based on the co-ordination of responses to temperature of developmental processes. Journal of Experimental Botany 61, 2057–2069.
Reimann C, Filzmoser P, Garrett RG, Dutter R. 2008. Multivariate
outlier detection. In: Statistical data analysis explained: applied envir-onmental statistics with R. Chichester, UK: John Wiley & Sons Ltd, 201–210.
Rousseeuw PJ, Hubert M. 2011. Robust statistics for outlier detection.
WIREs: Data Mining and Knowledge Discovery 1, 73–79.
Tollenaar M, Muldoon JF, Daynard TB. 1984. Differences in rates of leaf
appearance among maize hybrids and phases of development. Canadian Journal of Plant Science 64, 759–763.
Utz HF. 2003. ‘PLABSTAT’ a computer program for statistical
ana-lysis of plant breeding experiments. Stuttgart, Germany: Institute for Plant Breeding, Seed Science and Population Genetics, University of Hohenheim.
Wilkinson MD, Dumontier M, Aalbersberg IJ, et al. 2016. The FAIR
guiding principles for scientific data management and stewardship. Scientific Data 3, 160018.
Yang J, Benyamin B, McEvoy BP, et al. 2010. Common SNPs explain
a large proportion of the heritability for human height. Nature Genetics 42,
565–569.