Publisher’s version / Version de l'éditeur:
Vous avez des questions? Nous pouvons vous aider. Pour communiquer directement avec un auteur, consultez la première page de la revue dans laquelle son article a été publié afin de trouver ses coordonnées. Si vous n’arrivez pas à les repérer, communiquez avec nous à [email protected].
Questions? Contact the NRC Publications Archive team at
[email protected]. If you wish to email the authors directly, please see the first page of the publication for their contact information.
https://publications-cnrc.canada.ca/fra/droits
L’accès à ce site Web et l’utilisation de son contenu sont assujettis aux conditions présentées dans le site
LISEZ CES CONDITIONS ATTENTIVEMENT AVANT D’UTILISER CE SITE WEB.
Cement and Concrete Research, 10, May 3, pp. 347-359, 1980-05-01
READ THESE TERMS AND CONDITIONS CAREFULLY BEFORE USING THIS WEBSITE. https://nrc-publications.canada.ca/eng/copyright
NRC Publications Archive Record / Notice des Archives des publications du CNRC : https://nrc-publications.canada.ca/eng/view/object/?id=ac5f65b3-67bc-4fac-af6d-b9410904736a https://publications-cnrc.canada.ca/fra/voir/objet/?id=ac5f65b3-67bc-4fac-af6d-b9410904736a
NRC Publications Archive
Archives des publications du CNRC
This publication could be one of several versions: author’s original, accepted manuscript or the publisher’s version. / La version de cette publication peut être l’une des suivantes : la version prépublication de l’auteur, la version acceptée du manuscrit ou la version de l’éditeur.
For the publisher’s version, please access the DOI link below./ Pour consulter la version de l’éditeur, utilisez le lien DOI ci-dessous.
https://doi.org/10.1016/0008-8846(80)90110-6
Access and use of this website and the material on it are subject to the Terms and Conditions set forth at
Collapse of structure in sepiolite and other layered silicate systems
COLLAPSE OF STRUCTURE
IN SEPlOLlTE AND OTHER LAYERED
SILICATE SYSTEMS
by
J. J. Beaudoin and P. E. Grattan-Bellew
Reprinted from
CEMENT
AND CONCRETE RESEARCH
Vol. 10, No.
3,
May 1980
'
p. 347-359
DBR Paper No. 899
Division of Building Research
- Ser I
7871
TH1
N21d no.899
I c . 2a&*,,
-
NATIONAL RESEARCH COUNCIL OF CANADA
CONSEIL NATIONAL DE RECHERCHES DU CANADA
1
This publication is being distributed by the Division of Building Research of the National Research Council of Canada. It should not be reproduced in whole or in part without permission of the original publisher. The Division would be glad to be of assistance in obtaining such permission.
Publications of the Division may be obtained by mailing the ap- propriate remittance (a Bank, Express, or Post Office Money Or- der, or a cheque, made payable to the Receiver General of Canada, credit NRC) to the National Research Council of Canada, Ottawa, K I A OR6. Stamps are not acceptable.
A list of all publications of the Division is available and may be obtained from the Publications Section, Division of Building Re- search, National Research Council of Canada, Ottawa, K I A 0R6.
CEMENT and
CONCRETE
RESEARCH.Vol
.
10, pp. 347-359, 1980. Printedin
the USA.0008-8846/80/030347-13$02.00/0 Copyright (c) 1980 Pergamon Press, Ltd.
COLLAPSE OF STRUCTURE IN SEPIOLITE
AND OTHER LAYERED SILICATE SYSTEMS
J.J. Beaudoin and P.E. Grattan-Bellew
Building Materials Section, Division of Building Research National Research Council of Canada, Ottawa, Canada
KIA OR6
(Communicated by F.
H. Wi
ttmann)(Received Dec. 31
,
1979)ABSTRACT
Collapse of structure due to removal of water from sepiolite and
other layered silicates was studied. Data from three systems
-
sepiolite, hydrated C3S, and hydrated portland cement
-
are presented.Changes in mechanical properties and helium flow characteristics were correlated with collapse processes in sepiolite. Similarities in helium flow characteristics of the three systems are discussed to elucidate the role of decomposition processes in microstructural collapse. The sepiolite system appears to have potential as a model for the study of collapse processes in other cementitious systems.
SOMMAIRE
On Etudie l'effondrement de la structure de la s6piolite et d'autres
phyllosilicates sous l'effet de llElimination de l'eau. On prEsente
des donn6es relatives 21 trois systsmes
-
sGpiolite, C3S hydratE etciment Portland hydrat6. Dans le cas de la sgpiolite, on ?iEtabli
une corr6lation, d'une part entre les modifications des propri6tEs
m6caniques et des caract6ristiques d16coulement de llhElium, et
d'autre part le m6canisme d'effondrement. On examine les caractsres
communs de 116coulement d1h61ium pour les trois systGmes, afin
d161ucider le rBle des processus de d6composition lors de l'effondre- ment de la microstructure. I1 semble qu'on puisse utiliser le systsme bas6 sur la sepiolite, comme modsle d'6tude des processus d'effondrement dans les autres systsmes contenant un matgriau cimentant.
Vol. 10, No. 3
J. J. Beaudoin, P. E. Grattan-Be1 lew
Introduction
The term "collapse of structure" describes a situation where due to the removal of structural water? (sometimes referred to as load-bearing water) the silicate layers are displaced relative to one another by deformation processes involving consolidation of hydrates due to folding, buckling, rotation, dis- tortion or other mechanisms.
Volume changes - shrinkage and creep
-
in hydrated portlant cement paste are processes that involve collapse of structure of layered CSH and the amount of volume change is dependent on the state of collapse of the micro- structural units (1). For example, when cement paste is autoclaved under certain conditions a high density, low surface area product-
aC2SH-
will form. Shrinkage and creep of this material is significantly lower than normally cured portland cement paste as collapse of structure has already taken place during autoclaving.Few experiments have provided direct evidence of structural collapse in hydrated portland cement (2). X-ray low-angle scattering experiments enabled Winslow (3) to follow changes in surface area of hardened portland cement paste from the wet condition to the dry state; he observed that surface areas decreased from approximately 600 m2/g to 200 m2/g. On rewetting most of the original surface area was regenerated. This provided evidence that the structure had not stabilized on first drying and that water could reenter the layered structure.
Modulus of elasticity measurements on samples of hydrated portland cement increase by as much as 100% when the samples are wet due to increases stiff- ness of the solid when water is present in interlayer positions (4). On drying there is a continuous decrease in the solid volume of cement paste but the system retains its stiffness except at very low humidity when a large decrease in stiffness occurs accompanied by collapse of the layered structure.
Irreversible shrinkage and creep strains in hydrated portland cement have been attributed, in part, to irreversible structural changes involving trans- lation of the ends of silicate chains into closer proximity with each other
(5).
Attempts torelate volume changes occurring in hydrated portland cement with microstructural changes have been mostly qualitative (6). Helium dif- fusion techniques provided a tool for quantitative assessment of micro- structural changes (7). Measurements of solid volume, and helium intake on removal of interlayer water from the hydrated cement system, enabled estimates to be made of the space occupied by water prior to its removal. Changes in the rate of helium intake and in total helium intake as water was removed provided a means of detecting structural collapse (8).
In crystals containing coordinating water, the water molecules play an essential role in maintaining the structure intact.
*
V o l . 10, N o . 3 3 4 9 LAYER STRUCTURE, COLLAPSE, S E P I O L I T E , HYDRATION C3S, PASTES
At present, there is no general agreement about the state of water in hydrated portland cement and its role in the collapse process, although the view that interlayer water plays a major role in shrinkage and creep processes in this system is gaining acceptance. It was thought that a systematic study of the removal of water from a well crystalline layered system, wherein water is held in well-defined states, would enable an assessment of the ability of helium diffusion methods to elucidate the role of various types of water in
structural collapse processes. Sepiolite (8 Mg0.12SiO nH20) was the layered
silicate system chosen for this purpose. Sepiolite, wgich contains zeolitic water, coordination water and octahedral OH, is a microporous solid having pore space in the form of long, narrow molecular size channels and grooves. Details of folding and collapse processes on removal of coordination water have been studied using X-ray diffraction, thermogravimetric analysis and infra-red spectroscopy (9, 10, 11).
This paper is a report of the results of helium diffusion, length change, modulus of elasticity and microhardness measurements for sepiolite as water is removed in steps from 11% RH condition. Similarities in helium diffusion and other test results of sepiolite, C3S and hydrated portland cement are discussed with a view to the use of seljiolite as a model for the study of CSH layered systems.
Materials
Vallecas scpiolite was used for all sepiolite samples. Details of
chemical and physical properties have been published elsewhere (9, 12). X-ray
diffractograms revealed all the sepiolite lines expected. The sepiolite sample contained minor amounts of quartz. Samples were prepared by compacting sepiolite powder into discs 3.2 cm in diameter and 1.25 mm thick at pressures up to 680 MPa. All samples were conditioned at 11% RH prior to testing.
Preparation of hydrated C S and portland cement pastes referred to in the
3
text has been reported elsewhere (7, 13). Procedures
Removal of Water from Sepiolite Samples
Sepiolite samples, conditioned to 11% RH, were placed in a vacuum vessel. Water was subsequently removed in increments by pumping or a combination of pumping and heating for various time periods ranging from a few minutes to
several hours. Temperatures ranged from 40 to 850°C. At higher temperatures
water was removed by placing samples in a furnace. After each increment of water was removed weight changes were recorded in a dry box; samples were then inserted in the helium pycnometer for solid volume and helium intake measure- ments. Companion samples, subject to the same conditioning, were selected for modulus of elasticity and microhardness measurements.
Helium Comparison Pycnometry and Helium Intake
The apparatus and procedure for solid volume and helium intake measure- ments are described in detail in other papers (14, 15). Solid volumes are the instantaneous volumes obtained using helium as a displacement fluid.
350 Vol. 10, No. 3
J.J.
Beaudoin,P.E.
Grattan-BellewMolecular size channels or interlayer spaces that cause a delayed flow of helium into the sample, are, in the first instance, regarded as part of the solid.
Length Change
Samples were cut in a rectangular shape approximately 2.5 by 0.6 cm and mounted on a modified Tuckerman gauge extensometer. The details of this
method have been described elsewhere (16). The samples, initially conditioned
to 11% RH, were placed in vacuum cells where length change resulting from combinations of pumping and heating was monitored.
Modulus of Elasticity
The method used to measure modulus of elasticity of the sepiolite discs
has been reported (4). The procedure involves measuring the deflection of the
disc specimen when loaded at its centre and supported at three points on the circumference of a circle 2.5 cm in diameter.
Microhardness
A Leitz microhardness testing machine with a Vickers indenter was used for the microhardness measurements. Ten microhardness measurements were made on each disc tested.
Results Helium Intake versus Time
Selected helium intake versus time curves are plotted in Figure 1. Water was removed from the samples in increments and each curve, in numerical order, is the result obtained at a further increase in weight loss. The weight Losses identified with each curve are indicated in Figure 1. 'I'here is a progressive increase in the amount of helium intake at 72 hours as weight loss increases to 6.75%. At weight loss 6.75 to 8.60% there is a successive decrease in both the initial rate of helium intake as well as the total helium intake at 72 hours. The total helium intake at weight loss 8.60% has decreased to nearly that shown by curve 1. The total helium intake and the initial rate of helium intake increase to maximum at 12.82% weight loss. There is a subsequent de- crease in helium intake to a value less than that obtained for the starting condition at weight loss of 15.36%.
Total Helium Intake versus Weight Loss
The total helium intake after 40 hours, AD, is plotted against weight loss in Figure 2. There is an increase in total helium intake to a maximum of 4.26 cc/100 g at a weight loss of 6.75% followed by a decrease in the value of total helium intake to 1.12 cc/100 g at a weight loss of 8.60%. Upon further removal of water there is a rapid increase in total helium intake to a maximum 6.00 cc/100 g at a weight loss of 12.82%; this is followed by a decrease in total helium intake to a minimum of 0.53 cc/100 g at a weight loss of 15.36%. The Term (AV-AD) versus Weight Loss
The term (AV-AD), (solid volume change, AV,
-
total helium intake, AD) isVol. 10, No. 3 351 LAYER STRUCTURE, COLLAPSE, S E P I O L I T E , HYDRATION C3S, PASTES
between the two terms up to a weight loss of approximately 6.80%. The in- verse slope of this curve is approxi- mately 1.00.
In the weight loss region 6.80- 8.96% there are three occurrences of large changes in (AV-AD) with very small increases in weight loss (this will be discussed later); for the re- maining data in this region there is very little change in (AV-AD) with weight loss. For subsequent weight losses up to 12.82% there is a linear dependence in (AV-AD) and weight change; the inverse slope of the curve is approximately 0.39. Further re- moval of water results in increased values of (AV-AD) up to a weight change of 15.36%. The inverse slope of a line joining the origin and the final data point is approximately 1.15. An interpretation of the meaning of
Zd 3 2 4 0 1e J~ b n 1 2 these curves will be given later.
T I M E , n
FIG. 1
S E P I O L I T E : 8 M g O ' 12 S I O 2 ' n H 2 0
Helium intake vs time curves for sepiolite which has been dried in stages from 11% RH
Solid Density versus Weight Loss
8 a
Solid density versus weight loss
data is plotted in Figure 4. As water 2
is removed solid density (taking
account of helium intake) increases
=
3f r o m 2 . 3 6 g / c c t o 3 . 1 2 g / c c a t 6 . 8 0 %
weight loss. In the weight loss
region 6.80 to 8.96% there are three L
2
moisture contents where there are sig-
-
nificant increases in solid density with little change in weight. Solid density increases from 2.81 g/cc at 8.09% weight loss to 3.76 g/cc at 12.82% weight loss. Further removal of water results in a decrease in density to 2.85 g/cc at 15.36% weight
W E I G H T L O S S . %
i([L!!
O C 2 1 6 8 10 1 2 14 lbs
18loss.
Length Change Data FIG. 2
Length change, A R / R , versus Total helium intake at 40 h vs weight
weight change On from 11% RH loss for sepiolite which has been dried
352 Vol. 1 0 , No. 3
J . J . Beaudoin, P . E. Grattan-Be1 lew
I I I I I I T E M P E R A T U R E , 'C D 1 1 5 2 5 0 3 0 0 5 5 0 850 4 . 0 S E P I O L I T E 8 M g O - 1 2 S i 0 2 n H 2 0 I I I I I
-
- 3 . 8 --
3 . 6-
- l I S L O P E = l 0-
: rn 3 4 --
z 3 2 - - 4 m I Z u - L O - 3.0 - n-
2 0 - 1 2-
2 . 8 --
2 0 - 1 4 - 2. 6-
-
a - 1 6 - > a I I 1 1 I I - 1 8 - 2 . 2.
I 0 2 4 6 8 1 0 1 2 1 4 I 6 W E I G H T L O S S , % - 2 0 - FIG. 4 - 2 2 I I I I I I II
0 1 4 6 8 1 0 I 2 1 4 1 6 Solid density vs weight loss for
W E I G H T L O S S . %
sepiolite which has been dried from 11% RH
FIG. 3
The term, AV-AD, vs weight loss for
sepiolite which has been dried from P I I I I I I I
11% RH a
-
-
7
-
iP - 6 -
There is an initial length change of approxi-
i
- -mately 2% at a weight change of approximately Q 5 -
0.5%. In the weight change region 0.50 to6.75% 3
there is no additional length change. From 4 4 -
6.75 to 7.80% weight change length increases to
$
3 -l
y
3.1% and from weight change 7.80 to 8.06% there,-!...
.
is a large increase in length change to 7.60%. f
J -
-
In Figure 6, the term 3 AR/L is plottedO o : A 1 o
against solid volume change, AV. There is an
W E I G H T L O S S . %
initial length change with very little solid
volume change. Solid volume change then in- FIG. 5 creases up to 20.80% with no length change.
Subsequent fluctuations in solid volume Shrinkage vs weight loss for change from 20.8%+12.8%+20%+12.4% occur in sepiolite which has been dried the weight loss region 6.70% to 8.04%, where from 11% RH
there are large increases in helium intake with little weight change (Figure 3); these
fluctuations include the large increase in helium intake at 6.80% weight change. On further removal of water from the system
-
to 7.8% weight loss-
the change in solid volume increases to 24.25%; this weight loss is where a second large increase in helium flow with small weight changes occurs(Figure 3). The curve (3 AR/R versus AV) in this region is approximately parallel to the line of equality. Further removal of water (only 0.1%) is
V o l . 10, No. 3 3 5 3 LAYER STRUCTURE, COLLAPSE, S E P I O L I T E , HYDRATION C3S, PASTES
28
accompanied by a large decrease in solid 26 - I I l ~ I I I I T I T I 1 . 1
-
volume change to 15.8%, the plot point 24 - -
lying near the line of equality. Further 2 2 -
-
removal of water (weight change 8.04%) . 20
-
-results in increased length change, the 2 -r 1 8 - a
curve being close and approximately para-
:
16 -llel to the line of equality. Mechanical Properties
Mechanical property versus weight -
change curves are plotted in Figure 7.
-
Microhardness - 2 o 2 4 b 8 10 1 2 14 16 18 20 22 24 26 28 30S O L I D V O L U M E D E C R E A S E . A V . %
As water is removed from the samples
conditioned at 11% RH microhardness in- FIG. 6 creases from 337 MPa to 490 MPa at 8.13%
weight loss. At 11.90% weight loss micro- Shrinkage vs decrease hardness decreases to 181 MPa. Further for sepiolite which has been dried removal of water to 12.82% weight loss from 11% RH
results in a microhardness value of 168 MPa. At weight losses of 13.19 and 15.36% microhardness increases to values of 225 and 379 MPa, respectively. The value of 337 MPa is close to the initial value at 11% RH.
Modulus of Elasticitv
At weight losses up to 8.13% there is very little change in the initial modulus of elasticity value 7.2 x lo3 MPa. As weight loss increases to 11.90 and 12.82% modulus of elasticity decreases to values of 4.03 and 3.09 x 10³ MPa. At weight losses of 13.19 and 15.36% modulus of ela- sticity increases to values of 3.19 and 5.9 x 10³ MPa. Mechanical property r, asults will be discussed in more detail later.
Discussion
In order to facilitate discussion of the helium diffusion, length change and mechanical property results obtained for the sepiolite system in this study, a brief description of the molecular struc- ture of sepiolite is necessary. Figure 8
5 2 I I I I I I I ' , 48 Y 1 . 2 32 - 2 8 - D1
z
2 4 -&
20 - SEPIOLITE: 8 M g 0 - 12Si02. nH20-
I 16 -
-
1 , I I I t I I I I
W E I G H T L O S S . %
FIG. 7
is a schematic representation (after Mechanical properties vs weight Cerna et a1 (9)) of the structure of loss for sepiolite which has been sepiolite projected on the (001) plane. dried from 11% RH: (a) micro- Water is held in various states: zeo-
hardness, (b) modulus of elasticity litic water is lost at temperatures near
1 1 0 ~ ~ ; first water of coorhination at
each edge Mg is removed at 17S°C under vacuum; second water of coordination is..removed at higher temperatures from collapsed channels where diffusion
354 Vol. 10, No. 3
J.J.
Beaudoin,P.E.
Grattan-Bellewproblems delay its escape from the crystal (anhydride forms at about 500°C); octahedral hydroxyls react and
disappear as water by 780°C. h-
Following the model of Cerna et a1 Q Mg
0 0
it is suggested that the crystal folds
after the removal of the first water of B OH
coordination and that the crystal is m H O
subsequently distorted durlng removal of second water of coordination. It is the hydrogen bridges (at points b
(Figure 8)) from the waters of coordi- nation to the oxygen of the neighbor-
ing silica surfaces which stabilize the FIG. 8
structure. Total dehydroxylation and
sepiolite anhydride destruction take End view of the right-hand edge of a
place by 780°C. model sepiolite fiber (a) water-SiOH
bond (b) water-oxygen bond (after
Helium Diffusion Studies Cerna et a1 (9))
After reaching a maximum total helium intake at 6.75% weight loss there
is a decrease to a minimum at 8.60% weight loss (Figure 2). This decrease is
attributed to folding (structural collapse) of the sepiolite crystal due to
removal of the first coordination water. Further removal of #water up to
12.82% is accompanied by a large increase in total helium intake. This is attributed to the removal of the second coordination water from collapsed channels. The folding processes, themselves, may produce trapped space into which helium may subsequently flow. Further weight loss probably involves dehydroxylation especially at the highest temperatures. At 850°C XRD indi- cates the presence of enstatite; also some of the quartz has reacted with anhydrous sepiolite.
Consider the (AV-AD) versus weight loss plot (Figure 3). The inverse
slope of the curve up to 6.75% weight loss is approximately 1.00; this repre- sents the density of the water (zeolitic) which has been removed from the molecular sized channels. In the weight loss region 6.75 to 8.60% there are three verticle "spikes" at weight loss positions where helium intake is large and weight change is small. This is attributed to the diffusion of helium into empty discrete space which has opened up during the folding of the crystal. Opening up and filling of discrete space has been observed in other systems (17).
For the remaining plot points in this region there is very little change in (AV-AD) with weight loss; structural collapse of the crystal inhibits the flow of helium into the microspace. A similar characteristic is observed in the (AV-AD) versus weight loss plot for the hydrated C3S system in the weight
loss region from 5.0 to 7.0% (Figure 9). This was attributed to the collapse
of layered silicates in the hydrated C3S system (13).
In the weight loss region 8.60 to 12.82% the slope of the (AV-AD) versus weight loss curve increases; the inverse slope is approximately 0.39. In
this region helium intake increases (curves 7, 8, 9, Figure 1) due to removal
of the second coordination water from collapsed molecular sized channels and accessibility of microspace trapped during the folding process. In this region, the structure is apparently distorted as sepiolite anhydride is farmed.
Vol. 10, No. 3 355
LAYER STRUCTURE, COLLAPSE, SEPIOLITE, HYDRATION CgS, PASTES
Further removal of water to 15.36% a I I I I I
weight loss involves a dehydroxylation 0.5 W I S C g S
process and further collapse of micro-
.
0 . 8 WIS c 3 sstructure. The term (AV-AD) increases to
give a plot point (-13.36, 15.36; Figure - I . O O O -
-
3). If this point is joined to the
origin the inverse slope of the line Dl
gives a value of 1.15 g/cc (similar a
0
-
values were obtained for adsorbed water Z
in other systems (18)) for the density of
2
the water removed, indicating that in C O L L A P S E
this dehydroxylated state helium is now 2
able to enter nearly all the space vaca-
ted by water. - 3 . 0 0 0
The solid density versus weight loss curve for hydrated C3S (Figure 10) reaches a maximum at 5% weight loss and
then decreases (due to structural col- - 4 . 0 0 0 I I I I I I 1
0 1 . 0 2 . 0 3 . 0 4 . 0 5 . 0 6 . 0 7 . 0 8 . 0
lapse) as weight loss increases to 7%.
W E I G H T L O S S . % Solid density for sepiolite in-
creases steadily to a weight loss of FIG. 9
6.75% (Figure 4). In the weight loss
The term, AV-AD, vs weight loss for region 6.75 to 8.60%, there are three
C3S dried from 11% RH
vertical "spikes" - large increases in
solid density resulting from the access- ibility of discrete microspace to helium.
2,60
As weight loss increases to 12.82% solid density increases to a maximum; there is a decrease in solid volume as helium can now enter space created by the removal of
secondary coordination water and the 2 . 3 5 -
/"'
accessibility of previously trapped space. y
The density of 3.76 observed at 12.8% :
weight loss is higher than might be ex-
=
' C O L L A P S Epected. A possible explanation for this
'-"-
-
apparently anomalous density may be that
-
W I Z
-
a . 8the volume measured by helium diffusion is
.
- W I S - 0 . 5not a multiple of the volume of the unit
cell which is used in the XRD method of 2.25, I t I I I 1 I
calculating density but a smaller volume 0 1 2 3 4 5 6 7 8
due to helium penetrating vacant lattice W E I G H T L O S S . 4
sites. Gunnar Hagg and Ingrid Sucksdorff FIG. 10
(19) showed that there is a direct re-
lationship between density and the number Solid density vs weight loss for
of lattice vacancies in pyrrhotite. Ball C3S dried from 11% RH
and Taylor (20) found that under certain
conditions Mg(0H) dehydrated to a spinel
2
phase in which there are vacant sites in the lattice. Mg(0H) forms the core
2
of the structure of sepiolite (Figure 8) and the work of Ball and Taylor (20) suggests that the spinel phase might be expected to form in sepiolite. The
presence of silica layers on either side of the Mg(OH)2 core of sepiolite re-
tards the loss of (OH) ions from the structure and can be expected to increase the probability of the formation of the spinel phase rather than periclase the
356
Vol.
10,No.
3J.J. Beaudoin,
P.E.
Grattan-Bellew
normal end product of dehydration.
l l [ I I l
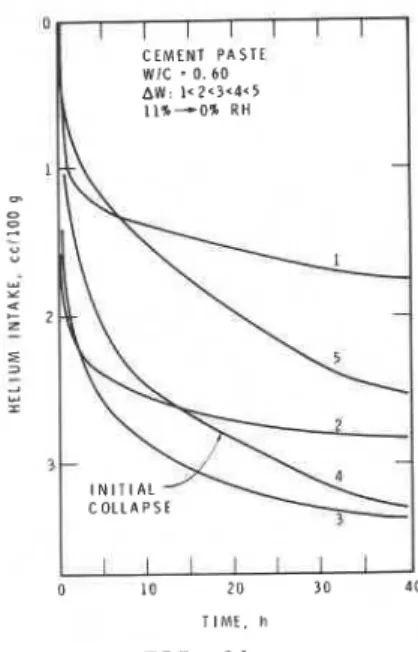
CEMENT PASTE
Helium intake versus time curves for the W I C = 0. 6 0
AW: 1 < 2 < 3 < 4 < 5
hydrated portland cement system are given in 11%-0% R H
Figure 11. When the curves begin to cross over
(Curve 4) microstructural collapse of the layered
-
silicates is initiated. This initiation of struc- tural collapse coincides with the maxima (at 6% weight loss) in the total helium intake versus weight loss curve for hydrated portland cement
(Figure 12)
.
Structural collapse occurring in the three layered systems studied (sepiolite, C S, portland
cement), due to the removal of ~ a t e r , ~ i s indicated
by the helium diffusion technique by the following: (a) a decrease in the rate and amount of helium
intake ;
u
10 2 0 3 0 40(b) a decrease in the slope of the (AV-AD) versus T I M E . h
weight loss curve; FIG. 11
(c) a decrease in solid density. Helium intake vs time
curves for hydrated port-
Length Change Measurements land cement paste dried
from 11% RH Reference is made to Figures 5 and 6. The
initial length change resulting from removal of 0.50% water is probably due to liberation of some water from crystal edges and the removal
o f z e o l i t i c w a t e r f r o m t h e e n d s o f m o l e c u l a r
--
W I S = 0 . 4 0 size channels. There is no further length2 G 2
change on removal of zeolitic water up to 6.75%
2 ;
,
weight change; this is expected as removal of + Z
zeolitic water is not supposed to alter crystal 0 2 4 6 8 1 0 1 2
structure. WEIGHT L O S S , %
FIG. 12 From 6.75 to 7.8% weight change, length
change increases from 2.0 to 3.2%; a further Total helium intake at 40
increase in length to 7.6% occurs as weight vs weight loss for hydrated
change increases to 8.1%. These length changes cement paste dried
may be correlated to folding of the crystal from 11% RH
structure.
In Figure 6, it is shown that the initial length change is accompanied by a small increase in solid volume; this may be due to structural collapse or folding at the ends of channels. The large solid volume change with no length change is due to the removal of zeolitic water. It is probable that helium is entering, instantaneously, some of the space vacated by zeolitic water accounting for decreased solid volume. Folding of the lattice begins at 6.75% weight change and large fluctuations in solid volume change are due to both folding and opening up of discrete pores (9). The length change due to structural collapse appears to occur in two stages: the first stage up to a solid volume change of 24% involves crystal folding and opening up of discrete pores; the second stage appears to be a consolidation process as the net solid volume decrease is reduced, possibly due to channel walls coming into closer proximity; subsequent shrinkage plot points are close to and parallel with the
V o l . 1 0 , No. 3
LAYER STRUCTURE, COLLAPSE, SEPIOLITE, HYDRATION C3S, PASTES
line of equality. The latter volume changes correspond to changes of weight which total approximately 013%.
Mechanical Properties
Microhardness and modulus of elasticity measurements (Figure 7) were use- ful in elucidating the structural role of the various types of water in the sepiolite crystal.
Where zeolitic water is removed (up to 6.75% weight change) microhardness increases significantly while there is negligible change in modulus of elasti- city values. It is apparent that zeolitic water does not contribute to the stiffness of the crystal. However, the presence of zeolitic water may weaken the Si-0-Si bonds, resulting in decreased strength. This form of stress cor- rosion has been suggested as a possible mechanism for the weakening of hydra- ted portland cement in presence of moisture (21). As part of the first co- ordination water is removed (up to 8.10% weight loss), accompanied by folding of the sepiolite crystal, microhardness continues to increase while modulus of elasticity undergoes little change.
It is apparent that most of the first coordination water does not contri- bute to the stiffness of the crystal which contains undistorted molecular sized channels whose contribution to the compressibility of the material re- mains the same even though lattice folding has taken place. Increased micro- hardness may be due to a reduction in the number of potential stress concen- tration sites in locations where external hydrogen bridging occurred.
Removal of the remaining coordination water causes distortion and weaken- ing of the structure. Second coordination water bridges the corners of col- lapsed pore walls and apparently contributes significantly to the stiffness and strength of the crystal. At weight losses greater than 12.82% dehydroxy- lation begins to occur. This is accompanied by increases in both microhard- ness and modulus of elasticity. Sepiolite anhydride structure is destroyed, the structure consolidates to form enstatite and weakening effects of trapped space due to removal of second coordination water are apparently removed.
Conclusions
Several experimental techniques
-
helium diffusion, length change, andmechanical property measurements
-
permitted elucidation of structural changesin sepiolite caused by water removal. The observations support the following conclusions:
1. a) Helium diffusion techniques can be used to detect microstructural instability due to the removal of water from selected layered sili- cates, such as hydrated portland cement, hydrated C S and sepiolite.
3
b) Helium diffusion techniques can be used to follow microstructural changes due to drying in the sepiolite system; these changes involve removal of zeolitic water, lattice folding and distortion caused by the removal of coordination water and consolidation due to dehydroxy- lation.
I c) Length change measurements on sepiolite samples dried from 11% RH
permit the delineation of processes involved in the removal of zeo- litic water and coordination water.
i
d) Removal of zeolitic water from sepiolite has little or no effect on358 Vol. 1 0 , No. 3
J.J.
Beaudoin,P.E.
Grattan-Bellew
values. It is apparent that there probably are different mechanisms associated with the removal of zeolitic water that are operative in determining these two properties; this is the case when interlayer water is removed from portland cement and C3S systems.
e) Removal of most of the first coordination water from the sepiolite crystal does not significantly affect modulus of elasticity values. Under the same moisture conditions microhardness values increase due, perhaps, to possible removal of stress concentration sites in locations where hydrogen bridging occurred.
f) Removal of second coordination water from the sepiolite crystal is des- tructive resulting in decreases in both modulus of elasticity and microhardness values.
g) Dehydroxylation of the crystal consolidates the structure, eliminates trapped space which may act as potential stress concentration sites, and results in significantly increased values of microhardness and modulus of elasticity.
2 . The layered mineral sepiolite may be useful as a model for des- cribing collapse of structure processes accompanying water removal in other layered but less crystalline systems.
Acknowledgement
The authors wish to thank J.J. Wood for his fine work in performing the experiments. This paper is a contribution from the Division of Building Research, National Research Council of Canada, and is published with the approval of the Director of the Division.
References 1. R.F. Feldman. Cem. Concr. Res.
-
2, 521 (1972).2. R.H. Mills. Proc. Int. Conference on Structure, Solid Mechanics, and Engineering Design in Civil Engineering Materials, Southampton, U.K., Part 1, 751 (1969)
.
3. D.N. Winslow. Ph.D. Thesis, Department of Civil Engineering, Purdue Uni- versity, p. 148 (1973).
4. P.J. Sereda, R.F. Feldman and E.G. Swenson. Highway Research Board Special Report No. 90, 58 (1966).
5. R.F. Feldman. Proc. RILEM/IUPAC Int. Symp. On Pore Structure and Properties of Materials, Prague, ClOl (1973).
6. T.C. Powers. RILEM Bull., No. 33, 381 (1966) 7. R.F. Feldman. Cem. Concr. Res. - 1, 285, (1971).
8. R.F. Feldman. Cem. Concr. Res.
-
3, 777 (1973).9. C. Cerna, J.L. Ahlrichs and J.M. Serratosa. Clays and Clay Minerals, 23, 452 (1975).
-
10. H. Hayashi, R. Otsuka and W. Imai. The Amer, Mineralogist
53,
1613 (1969). 11. H. Nagata, S. Shimoda and T. Sudo. Clays and Clay Minerals,22,
285(1974).
12. J.L. Ahlrichs, C. Cerna and J.M. Serratosa. Clays and Clay Minerals
-
23, 119 (1975).V o l . 10, No. 3 359 LAYER STRUCTURE, COLLAPSE, SEPIOLITE, HYDRATION C3S, PASTES R.F. Feldman. Cem. Concr. Res. - 2, 123 (1972).
J.J. Beaudoin and R.F. Feldman. Cem. Concr. Res.
-
8, 223 (1978). R.F. Feldman, Cem. Concr. Res.4,
1 (1973).R.F. Feldman. Proc. Fifth Int. Symp. Chem. of Cement, Tokyo, Part 111, Vol. 111, 53 (1968).
J.J. Beaudoin and R.F. Feldman. Cem. Concr. Res.
-
7, 585 (1977).S. Brunauer. The Adsorption of Gases and Vapors, Princeton University Press, Princeton, 420 (1943).
G. Hagg and I. Sucksdorff. Zeit. Phys. Chem. B.