HAL Id: hal-00296197
https://hal.archives-ouvertes.fr/hal-00296197
Submitted on 19 Apr 2007
HAL is a multi-disciplinary open access
archive for the deposit and dissemination of
sci-entific research documents, whether they are
pub-lished or not. The documents may come from
teaching and research institutions in France or
abroad, or from public or private research centers.
L’archive ouverte pluridisciplinaire HAL, est
destinée au dépôt et à la diffusion de documents
scientifiques de niveau recherche, publiés ou non,
émanant des établissements d’enseignement et de
recherche français ou étrangers, des laboratoires
publics ou privés.
regional scale nuclear conflicts and acts of individual
nuclear terrorism
O. B. Toon, R. P. Turco, A. Robock, C. Bardeen, L. Oman, G. L. Stenchikov
To cite this version:
O. B. Toon, R. P. Turco, A. Robock, C. Bardeen, L. Oman, et al.. Atmospheric effects and societal
consequences of regional scale nuclear conflicts and acts of individual nuclear terrorism. Atmospheric
Chemistry and Physics, European Geosciences Union, 2007, 7 (8), pp.1973-2002. �hal-00296197�
www.atmos-chem-phys.net/7/1973/2007/ © Author(s) 2007. This work is licensed under a Creative Commons License.
Chemistry
and Physics
Atmospheric effects and societal consequences of regional scale
nuclear conflicts and acts of individual nuclear terrorism
O. B. Toon1, R. P. Turco2, A. Robock3, C. Bardeen1, L. Oman3, and G. L. Stenchikov3
1Department of Atmospheric and Oceanic Sciences, Laboratory for Atmospheric and Space Physics, University of Colorado,
Boulder, CO, USA
2Department of Atmospheric and Oceanic Sciences, Univ. of California, Los Angeles, USA 3Department of Environmental Sciences, Rutgers Univ., New Brunswick, NJ, USA
Received: 15 August 2006 – Published in Atmos. Chem. Phys. Discuss.: 22 November 2006 Revised: 14 March 2007 – Accepted: 2 April 2007 – Published: 19 April 2007
Abstract. We assess the potential damage and smoke production associated with the detonation of small nuclear weapons in modern megacities. While the number of nuclear warheads in the world has fallen by about a factor of three since its peak in 1986, the number of nuclear weapons states is increasing and the potential exists for numerous regional nuclear arms races. Eight countries are known to have nu-clear weapons, 2 are constructing them, and an additional 32 nations already have the fissile material needed to build sub-stantial arsenals of low-yield (Hiroshima-sized) explosives. Population and economic activity worldwide are congregated to an increasing extent in megacities, which might be tar-geted in a nuclear conflict. We find that low yield weapons, which new nuclear powers are likely to construct, can pro-duce 100 times as many fatalities and 100 times as much smoke from fires per kt yield as previously estimated in anal-yses for full scale nuclear wars using high-yield weapons, if the small weapons are targeted at city centers. A single “small” nuclear detonation in an urban center could lead to more fatalities, in some cases by orders of magnitude, than have occurred in the major historical conflicts of many coun-tries. We analyze the likely outcome of a regional nuclear exchange involving 100 15-kt explosions (less than 0.1% of the explosive yield of the current global nuclear arsenal). We find that such an exchange could produce direct fatal-ities comparable to all of those worldwide in World War II, or to those once estimated for a “counterforce” nuclear war between the superpowers. Megacities exposed to at-mospheric fallout of long-lived radionuclides would likely be abandoned indefinitely, with severe national and interna-tional implications. Our analysis shows that smoke from ur-ban firestorms in a regional war would rise into the upper troposphere due to pyro-convection. Robock et al. (2007) show that the smoke would subsequently rise deep into the
Correspondence to: O. B. Toon
stratosphere due to atmospheric heating, and then might in-duce significant climatic anomalies on global scales. We also anticipate substantial perturbations of global ozone. While there are many uncertainties in the predictions we make here, the principal unknowns are the type and scale of conflict that might occur. The scope and severity of the hazards identified pose a significant threat to the global community. They de-serve careful analysis by governments worldwide advised by a broad section of the world scientific community, as well as widespread public debate.
1 Introduction
In the 1980s, quantitative studies of the consequences of a nuclear conflict between the superpowers provoked interna-tional scientific and political debate, and deep public con-cern (Crutzen and Birks, 1982; Turco et al., 1983; Pittock et al., 1985). The resulting recognition that such conflicts could produce global scale damage at unacceptable levels contributed to an ongoing reduction of nuclear arsenals and improvements in relationships between the major nuclear powers. Here we discuss the effects of the use of a single nuclear weapon by a state or terrorist. We then provide the first comprehensive quantitative study of the consequences of a nuclear conflict involving multiple weapons between the emerging smaller nuclear states. Robock et al. (2007) ex-plore the climate changes that might occur due to the smoke emissions from such a conflict.
The results of this study show that the potential effects of nuclear explosions having yields similar to those of the weapons used over Japan during the Second World War (WW-II) are, in relation to yield, unexpectedly large. At least eight countries are capable of transport and detonation of such nuclear devices. Moreover, North Korea appears to have a growing stockpile of warheads, and Iran is suspi-ciously pursuing uranium enrichment – a necessary precursor
0 10000 20000 30000 40000 50000 60000 70000 1945 1955 1965 1975 1985 1995 2005 Year N u m b e r o f W a r h e a d s Total Russia U.S. 0 100 200 300 400 500 600 1945 1955 1965 1975 1985 1995 2005 Year N u m b e r o f W a r h e a d s U.K. France China
Fig. 1. (top): Number of nuclear warheads in Russia (USSR), the U.S. and the total for all the Nuclear Weapons States (Norris and Kristensen, 2002). (About 10 000 Russian warheads of indetermi-nate status were omitted ). Russia and the U.S. have more than 95% of the warheads worldwide. The number of warheads began to fall after 1986 following the Intermediate-Range Nuclear Forces Treaty, and by 2002 was about one-third of its value at the peak in 1986. Current treaties do not require a future reduction in the num-bers of warheads, only a reduction in the numnum-bers of warheads that are on strategic delivery systems. (bottom): The arsenals of China, France and Britain have also remained stable or declined in the past two decades. Note the factor of about 100 change in scale between (top) and (bottom).
to weapons construction. Thirty-two other countries that do not now have nuclear weapons possess sufficient fissionable nuclear materials to construct weapons, some in a relatively short period of time. For these nations, a regional conflict involving modest numbers of 15-kiloton (kt, the TNT explo-sive yield equivalent) weapons to attack cities could cause casualties that exceed, in some cases by orders of magnitude, their losses in previous conflicts. Indeed, in some case, the casualties can rival previous estimates for a limited strate-gic war between the superpowers involving thousands of weapons carrying several thousand megatons (Mt) of yield. Early radioactive fallout from small nuclear ground bursts would leave large sections of target areas contaminated and effectively uninhabitable. (Hiroshima and Nagasaki were at-tacked by airbursts, which will not deposit large amounts of
local radiation unless it is raining. They were continuously inhabited.) Because of the smoke released in fires ignited by detonations, there is a possibility that 100 15-kt weapons used against city centers would produce global climate dis-turbances unprecedented in recorded human history (Robock et al., 2007). An individual in possession of one of the thou-sands of existing lightweight nuclear weapons could kill or injure a million people in a terrorist attack.
Below we first discuss the arsenals of the existing, and po-tential, nuclear powers. We then describe the casualties due to blast and to fires set by thermal radiation from an attack on a single megacity with one low yield nuclear weapon. Next we discuss the casualties if current and projected arsenals of such weapons were ever used in a regional conflict. We then discuss the impact of radioactive contamination. Finally, we describe the amounts of smoke that may be generated in a regional scale conflict. At the end of each of these sections we outline the associated uncertainties.
We have attempted to employ realistic scenarios in this analysis. However, we do not have access to the war plans of any countries, nor to verifiable data on existing nuclear ar-senals, delivery systems, or plans to develop, build or deploy nuclear weapons. There are obviously many possible path-ways for regional conflicts to develop. Opinions concerning the likelihood of a regional nuclear war range from highly improbable to apocalyptic. Conservatism in such matters requires that a range of plausible scenarios be considered, given the availability of weapons hardware and the history of regional conflict. In the present analysis, we adopt two po-tential scenarios: i) a single small nuclear device detonated in a city center by terrorists; and ii) a regional nuclear ex-change between two newly minted nuclear weapons states involving a total of 100 low yield (15-kt) detonations. We do not justify these scenarios any further except to note that most citizens and politicians today are aware of the potential disaster of an Israeli-Iranian-Syrian nuclear confrontation, or a Indian-Pakistani territorial confrontation. Moreover, as nu-clear weapons knowledge and implementation proliferates, the possible number and combinations of flash points mul-tiplies. The fact that nuclear weapons of the type assumed here have been used in past hostilities substantiates the idea that such scenarios as we propose are executable.
2 Nuclear arsenals
Table 1 lists the world’s known nuclear arsenals. Five coun-tries were recognized as Nuclear Weapons States in the 1968 Treaty on Non-Proliferation of Nuclear Weapons: France, People’s Republic of China, Russia (formerly USSR), United Kingdom and the United States. There are about 30 000 nu-clear warheads worldwide, 95% being held by Russia and the U.S. There is enough refined and unrefined nuclear explosive material in the world to construct another 100 000 weapons (National Academy of Sciences, 2005). No state has revealed
Table 1. Nuclear weapons inventories.
Country India Pakistan Israel China France Britain U.S. Russia
Date of analysis 2003 2003 2003 2003 2005 2005 2005 2005
Total # warheads 85(65–110)a 52(44–62)a 116(102–130)a 400b 350c < 200d 5315e 7200f
# detonatedg 2–5 2–6 45 210 45 1030 715
# atmospheric testsg 23 50 21 215 219
aTo compute the numbers of weapons for India, Pakistan and Israel, we used the Pu and HEU estimates of Albright et al. (1997) for 2003. We assumed each weapon contained 5 kg Pu or 25 kg of HEU. Parentheses indicate 5% and 95% confidence limits on Pu or HEU.
bNorris and Kristensen (2003). 280 of these are strategic weapons. cNorris and Kristensen (2005c).
dNorris and Kristensen (2005e).
eNorris and Kristensen (2005f). 4535 of these warheads are for strategic weapons. There are also 5000 intact warheads in reserve or in inactive stockpiles.
fNorris and Kristensen (2005a). 3814 of these are strategic warheads. Another 9000 intact warheads are in reserve or inactive stockpiles. gNorris and Arkin (1998).
the precise number of warheads in its stockpile (National Academy of Sciences, 2005). However, the strategic arsenals of Britain, France, Russia, and the U.S. can be reasonably estimated from treaties that verifiably limit the number and capacity of delivery systems. The U.S. and Russia also have significant stockpiles of strategic warheads in reserve, or in storage, beyond those devoted to current strategic delivery systems. The numbers of tactical weapons, including mines, artillery shells, depth charges, and bombs are more uncer-tain; for example, the Russian tactical stockpile is known only to within 5000 devices (National Academy of Sciences, 2005). Figure 1 plots the trends of nuclear warheads (exclud-ing about 10 000 of indeterminate status in Russia for 2002) during the past several decades. As may be seen the numbers of warheads has declined by roughly a factor of 3 in the past two decades.
There are currently three De Facto nuclear weapons states, which have developed weapons outside of the restrictions of the Nuclear Non-Proliferation Treaty: India, Israel, and Pak-istan. The arsenals of India, Israel and Pakistan (as well as China) are not well documented. The numbers of warheads they control was determined by several researchers by first estimating the amount of highly enriched uranium (HEU) or of plutonium that could have been produced by each country and allocated to military uses, as opposed to civilian appli-cations. An assumption is then made regarding the amounts of fissionable material needed for each warhead. While all of the available material in military hands may not be assem-bled into weapons, the numbers in Table 1 assume it has. We omit possible nuclear devices in North Korea, although it is estimated that 10 plutonium weapons in the 10–20 kt range may have been produced (Norris and Kristensen, 2005b).
India and Pakistan conducted nuclear tests in 1998. There are significant differences between the stated yields of the devices in these tests and those estimated from seismic stud-ies (Wallace, 1998). However, the yields of some of the
de-vices were similar to the first weapons tested by the U.S., and those dropped on Hiroshima and Nagasaki during WW-II. In-dia claims to have both fusion and fission devices (Norris and Kristensen, 2005d). It has been suggested that India may at-tempt to build nuclear parity with France, Britain, and China in the next 5–7 years by constructing 300–400 warheads de-ployed on a triad of delivery systems (missile, aircraft, and submarine) (Norris and Kristensen, 2005d).
In Table 1 we estimate that India has between 65 and 110 weapons, with 85 being most likely. We also estimate that Pakistan has 44–62 weapons with 52 being most likely. Our estimate for India is identical to that of Albright et al. (1997) for India in 2004, because we followed the Albright et al. technique and used their numbers for Pu and HEU. Norris and Kristensen (2005d) estimate India had 40–50 assembled nuclear weapons in 2005. Norris and Kristensen (2006) state that “independent experts” estimate India has 60–105 nuclear warheads, of which 50–60 may be assembled. Norris and Kristensen (2006) state “experts” believe Pakistan has 55–90 weapons with 40–50 assembled. Lavoy and Smith (2003) extrapolated older estimates from Albright et al. (1997) us-ing reactor production rates to determine that India in 2002 might have 40–120 devices, with a medium guess of 70, and Pakistan 35–95 with a medium guess of 60.
Several countries possessed nuclear weapons in the past, but abandoned them. South Africa constructed six devices, which they destroyed, possibly after one nuclear test (Al-bright et al., 1997). Belarus, Ukraine, and Kazakhstan in-herited nuclear weapons with the fall of the Soviet Union, but have transferred them to Russia.
As summarized in Table 2, there are a large number of countries that possess the raw materials needed to construct nuclear weapons, mainly in their civilian nuclear reactor pro-grams. Altogether, 45 nations are identified in Table 2 as having previous nuclear weapons programs, current weapons stockpiles, or the potential to become nuclear states. Thirteen
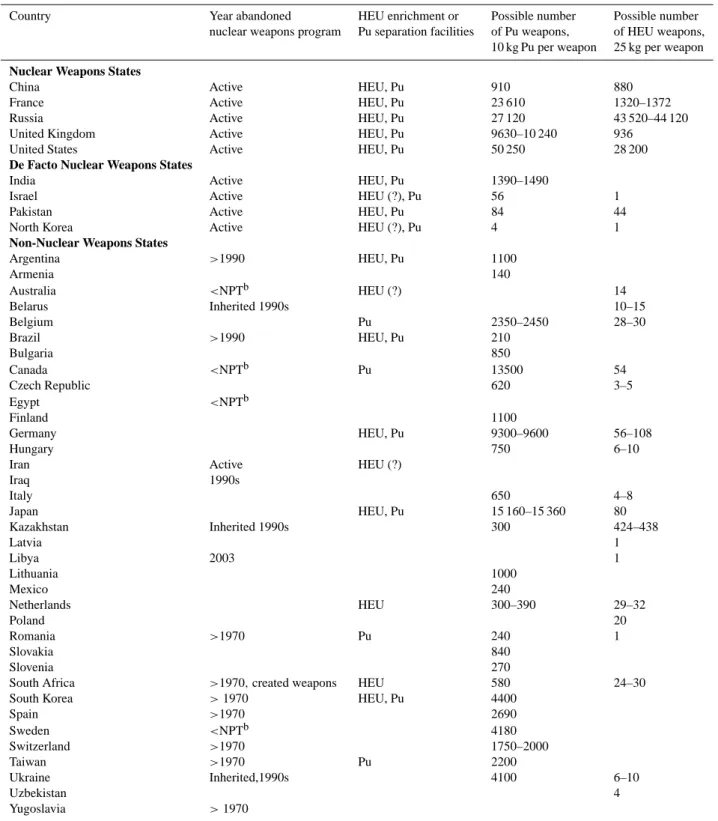
Table 2. The dates when various countries halted their nuclear weapons programs; whether they have or once had HEU enrichment facilities, or Pu separation facilities; and the numbers of nuclear weapons that might be constructed from Pu or HEU in their possession at the end of 2003 (Albright et al., 1997). For most countries, the Pu or HEU is in a civilian nuclear reactor programa.
Country Year abandoned HEU enrichment or Possible number Possible number nuclear weapons program Pu separation facilities of Pu weapons, of HEU weapons,
10 kg Pu per weapon 25 kg per weapon
Nuclear Weapons States
China Active HEU, Pu 910 880
France Active HEU, Pu 23 610 1320–1372
Russia Active HEU, Pu 27 120 43 520–44 120
United Kingdom Active HEU, Pu 9630–10 240 936
United States Active HEU, Pu 50 250 28 200
De Facto Nuclear Weapons States
India Active HEU, Pu 1390–1490
Israel Active HEU (?), Pu 56 1
Pakistan Active HEU, Pu 84 44
North Korea Active HEU (?), Pu 4 1
Non-Nuclear Weapons States
Argentina >1990 HEU, Pu 1100 Armenia 140 Australia <NPTb HEU (?) 14 Belarus Inherited 1990s 10–15 Belgium Pu 2350–2450 28–30 Brazil >1990 HEU, Pu 210 Bulgaria 850 Canada <NPTb Pu 13500 54 Czech Republic 620 3–5 Egypt <NPTb Finland 1100 Germany HEU, Pu 9300–9600 56–108 Hungary 750 6–10
Iran Active HEU (?)
Iraq 1990s Italy 650 4–8 Japan HEU, Pu 15 160–15 360 80 Kazakhstan Inherited 1990s 300 424–438 Latvia 1 Libya 2003 1 Lithuania 1000 Mexico 240 Netherlands HEU 300–390 29–32 Poland 20 Romania >1970 Pu 240 1 Slovakia 840 Slovenia 270
South Africa >1970, created weapons HEU 580 24–30
South Korea > 1970 HEU, Pu 4400
Spain >1970 2690 Sweden <NPTb 4180 Switzerland >1970 1750–2000 Taiwan >1970 Pu 2200 Ukraine Inherited,1990s 4100 6–10 Uzbekistan 4 Yugoslavia > 1970
aIncluding irradiated and non-irradiated plutonium. Including HEU at all enrichment levels. Including material owned by the country but not in its territory. We omitted237Np and
Am which can also be used in weapons.
countries operate plutonium and/or uranium enrichment fa-cilities, including Iran. Obtaining fissionable material, the most difficult step in constructing a weapon, is as straightfor-ward as operating a civilian power reactor system in tandem with a Pu reprocessing facility of appropriate sophistication. All of the necessary technology, equipment, and expertise are available through international markets, which are nomi-nally regulated to prevent proliferation. Nevertheless, as has become apparent over the past decade, nations wishing to build nuclear weapons seem quite capable of doing so de-spite international restrictions and treaties. In all, 19 coun-tries have had programs to develop nuclear weapons, notably Argentina, Brazil, North Korea, South Korea, and Taiwan (Albright et al., 1997). In 1992 the International Atomic En-ergy Agency safeguarded less than 1% of the world’s HEU and only about 35% of the world inventory of Pu (Albright et al., 1997). Today a similarly small fraction is safeguarded. The possible number of nuclear devices in Table 2 that could be constructed from existing inventories of Pu and HEU in various countries ranges from one to tens of thou-sands. We assumed in constructing Table 2, that 10 kg of Pu is needed for each warhead, but we did not distinguish Pu that has been separated from fuel rods from that which has not been separated, and we did not distinguish Pu which is enriched in the favored isotope,239Pu. Weapons constructed by the U.S. and Russia are thought to contain about 3–4 kg of Pu; it has also been suggested that Indian weapons aver-age 5 kg of Pu. For HEU, 25 kg per device was assumed to derive Table 2. HEU exists in various states of enrichment of
235U, and we do not specifically distinguish weapons-grade
material. However, once uranium is enriched to the level of HEU, most of the work needed to achieve weapons grade has already been done, and HEU itself can be used in weapons. There are 8 current states with nuclear weapons, 1 (North Korea) constructing weapons and one (Iran) believed to be actively seeking such devices. Another 32 states possess fis-sionable material from which weapons could be produced.
Many nuclear weapons are small in size and light in weight and could easily be transported in a car or van. The weapons dropped on Hiroshima and Nagasaki weighed 4040 kg and 4900 kg respectively (Gibson, 1996). Subsequent designs have reduced warhead weight-per-yield and size substan-tially. For example, 300 of the Intercontinental Ballistic Mis-sile warheads in the U.S. arsenal weigh only ∼100 kg each, while the remaining 850 warheads weigh less than 300 kg each (Gibson, 1996). U.S. submarine-based weapons are similarly light in weight. The U.S. also has about 480 non-strategic B61 bombs deployed in six European countries, with yields of 100–500 kt and weights of ∼300 kg (Gibson, 1996). The U.S. produced (and retired) 2000 W33 artillery shells, 20 cm in width and 94 cm in length weighing ∼110 kg with a yield of 5–10 kt (Gibson, 1996).
The number of nuclear weapons owned by various nations, how many could be successfully delivered, and where they would be delivered are the major uncertainties in the present
analysis. As pointed out by the National Academy of Sci-ences (2005) and Albright et al. (1997) better estimates of the numbers of weapons will only be obtained if nations agree to disclose such information. As discussed below there are many scenarios for how wars might be fought. In this pa-per we have focused on the delivery of about 50 low yield warheads on urban centers, because that is a rough estimate of the numbers currently existing in the smallest known nu-clear arsenals (Table 1). One may argue that the smallest nuclear states currently are not capable of delivering even 50 low yield weapons. However, history shows that once states develop nuclear weapons, they continue to develop more of them, with higher yields. Our idealized study involves about 0.3% of the world’s arsenal by number and only 0.03% by yield. If regional nuclear arms races continue to develop, the numbers of weapons and their yields can easily exceed the examples we discuss here.
3 Potential fatalities from a Hiroshima-sized explosion in a major city
To compute the number of fatalities or casualties from a nu-clear detonation, N , we use Eq. (1).
Nfatalities/casualties = 2π Z 0 R Z 0 rP (r, θ )α(r)dθ dr (1)
The integral is numerically evaluated over sectors of a city in which the population density, P , varies in space. The proba-bility of fatality or casualty, α depends on r, the distance from the detonation point, or “ground zero.” R is the maximum distance from ground zero for which the product of P and α yields more than one fatality or casualty in a grid cell. The probabilities for death or injury depend on the types of build-ings, the degree of exposure of the population, the time of day, weather, topography, and numerous other factors. How-ever, we assume α only depends on distance from ground zero.
Nuclear weapons cause direct destruction, death and in-juries mainly through the effects of prompt energetic gamma and neutron radiation, blast overpressure and winds, and thermal radiance from the fireball (thermal pulse). (The sub-sequent effects of exposure to radioactive fallout are dis-cussed in Sect. 5). While there have been attempts to esti-mate damage and casualties associated with nuclear detona-tions of various yields on the basis of the physical perturba-tions, there are numerous uncertainties in making such pro-jections. However, for the scenarios considered in this work the explosive yields correspond to those of the Hiroshima and Nagasaki atomic bombs, for which considerable data have been collected documenting deaths and injuries. While the detailed vulnerability of individuals in modern megacities is likely to be significantly different from that at Hiroshima
0 0.1 0.2 0.3 0.4 0.5 0.6 0.7 0.8 0.9 1 0 1 2 3 4 5
Distance from Ground Zero (km)
F ra c ti o n o f Po p u la ti o n K il le d Hiroshima deaths (OW) Nagasaki deaths Hiroshima Deaths (IS) Normal distribution, 1.15
Fig. 2. The fatality curves from Hiroshima ((OW)-Oughertson and Warren, 1956; (IS) Ishikawa and Swain, 1981) and Nagasaki (Oughertson and Warren, 1956), and a normal distribution fit to the Hiroshima data from Ishikawa and Swain (1981) with a standard deviation σ =1.15.
and Nagasaki, we propose that the overall casualty probabili-ties should be similar to first-order, particularly in the central zone of heavy destruction where most deaths occur. Accord-ingly, for the purpose of assessing potential fatalities in a fu-ture nuclear conflict or terrorist attack, we will rely on the outcomes of the atomic bombing of Japan in World War II.
Figure 2 shows the Hiroshima and Nagasaki fatality rates from two independent studies (Oughterson and Warren, 1956; Ishikawa and Swain, 1981). The fraction of people killed within Hiroshima and Nagasaki is similar, despite the fact that the energy released by the weapon dropped at Hi-roshima was 15±3 kt, while that at Nagasaki was 21±2 kt. The relatively higher rate of death in Hiroshima is probably due to the geography of the city. Nagasaki has more hills that shadowed areas from the blast and thermal radiation. The firestorm in Hiroshima was also more violent due to the dry conditions and flat terrain, which promoted widespread igni-tion (Ishikawa and Swain, 1981). Figure 3 illustrates the to-tal casualty probabilities in Hiroshima (Ishikawa and Swain, 1981). Casualties include fatalities and injuries, counting ei-ther only serious injuries that are life-threatening in the short run, or all injuries including those minor injuries that are not immediately life-threatening but could become disabling.
We have fit normal distributions to the probability data in Figs. 2 and 3 using a standard form: α(r)= exp(−r2/2σ2).
Here, α is the relative probability of fatalities or casualties at a given range, r, from ground zero, and σ is the effective scaling distance, or distribution width, for the effects of in-terest. Values of σ derived from the data in Figs. 2 and 3 are summarized in Table 3. We used the data from Ishikawa and Swain (1981) to calibrate the casualty distributions because
these data refer to the period a year following the explosions when the most serious injuries would have been resolved, and outcomes at each level of effect would be clear. The de-rived distributions may, nonetheless, represent a conservative estimate of fatalities in the sense that medical attention fol-lowing the Japanese wartime atomic bombing may have been more accessible than would be the case following an attack on a modern megacity, especially in the developing world. Modern medical treatment might prove effective for at least some of the types injuries that could not be treated during WWII. However, the availability of medical treatment will depend on the numbers of casualties, the damage to the med-ical infrastructure, and the ability of outside medial experts to enter the combatant countries (e.g. Leaning, 1986).
The Hiroshima and Nagasaki explosions were airbursts. Airbursts do not require sophisticated methods of delivery, a light aircraft, or pressure switch is sufficient. Ground bursts can be delivered by surface vehicles, or from the air. For a ground burst of the same yield, the thermal radiation at a given intensity covers only about 50% of the area of an airburst, because the fractional conversion of yield to ra-diant energy changes from 0.35 for an airburst to 0.18 for a ground burst (Glasstone and Dolan, 1977). In addition, the areas affected by overpressure also vary between air and ground bursts. For example, the area within the 10 pound-per-square-inch (psi) contour for a ground burst is about 50% of that for an airburst, while the area within the 2 psi contour for a ground burst is about 38% of that for an airburst (Glas-stone and Dolan, 1977). To adjust the probability curves for computing fatalities and casualties from ground bursts, we divide the appropriate σ in Table 3 by a factor of√2. This
0 0.1 0.2 0.3 0.4 0.5 0.6 0.7 0.8 0.9 1 0 1 2 3 4 5
Distance from Ground zero (km)
Pr o b a b il ity o f c a s u a lti e s Hiroshima Casualties (major) Hiroshima Casualties minor Normal distribution, 1.46 Normal distribution, 1.87
Fig. 3. The casualties in Hiroshima (Ishikawa and Swain, 1981), as well as normal distribution fits to these data with σ =1.46 and 1.87. Casualties are defined either as the sum of fatalities plus all major injuries, or fatalities plus all injuries, even relatively minor ones.
Table 3. The characteristic widths, σ , of the fatality and casualty distributions obtained by fitting data in Figs. 2 and 3.
Parameter Width of normal distribution
Hiroshima fatalities (Ougherson and Warren, 1956) 1.0 Hiroshima fatalities (Ishikawa and Swain, 1981) 1.15 Hiroshima fatalities + serious injuries (Ishikawa and Swain, 1981) 1.46 Hiroshima fatalities + all injuries (Ishikawa and Swain, 1981) 1.87 Hiroshima fatalities + injuries from Ishikawa and Swain (1981) 2.05
effectively reduces the impacted area by 50% relative to an airburst of the same yield, roughly compensating for the re-duced range of both overpressure and thermal radiation ef-fects.
The probability distributions derived above were com-bined with spatial distributions of population around specific target sites to determine total fatalities and injuries for partic-ular detonation scenarios. We chose target sites by first deter-mining the population within a 3 km radius about each grid cell in the LandScan for 2003 population data base (Land-Scan, 2003). The LandScan data base provides the 24-h av-erage ambient population. We then chose the most popu-lated of these regions subject to the constraint that the cen-tral cell was separated by at least 6 km from the center cell of the nearest alternative high population density group of cells. The population data are aggregated into cells that are 30 arc-seconds on a side – an area less than 1 km2 at the latitudes of interest. In these calculations, we did not consider the ac-cumulated casualties from multiple bursts in overlap zones
within 3 km of ground zero. In practice, for the most densely populated regions, fatalities from the blast and thermal radi-ation of a 15-kt explosion do not occur beyond about 5 km from ground zero, and minor injuries do not occur beyond about 9 km.
Table 4 presents fatalities and Table 5 casualties for air-bursts exploded at “optimum” height over the most densely populated, and second most densely populated, regions in a number of countries, as well as for a ground burst in the most densely populated region. These results could represent the consequences of a terrorist attack, or a limited nuclear strike or retaliation. Note that the casualties from the direct ef-fects alone using one weapon can number more than one mil-lion even though these scenarios assume low yield weapons. Compared to airbursts, explosions at the ground produce comparable, but somewhat lower, total fatalities – including deaths attributable to radioactive fallout as discussed below. Several previous researchers have investigated casualties in individual cities; for example McKinzie et al. (2001) use an
Table 4. Potential Fatalities From a Single 15-kt Detonation in a Megacity.
Country Airburst Total Airburst Total Ground Burst Blast/Fire Ground Burst Radiation Estimated Fatalities, Equivalent Number Fatalities: Fatalities: Fatalities: Fatalities: Previous Conflicts of Airbursts Highest Density City Second Highest Density City Highest Density City Highest Density City
Argentina 223 000 156 000 111 000 56 000 700a 1 Brazil 385 000 266 000 207 000 32 000 0 1 China 760 000 592 000 450 000 74 000 3 320 000b 6 Egypt 612 000 601 000 317 000 111 000 8500a 1 France 269 000 198 000 144 000 28 000 592 000b 3 India 571 000 469 000 419 000 62 000 3000a 1 Iran 287 000 274 000 155 000 38 000 450 000–730 000a 2–3 Israel 225 000 161 000 132 000 25 000 2800a 1 Japan 223 000 206 000 114 000 31 000 2 133 000b 14 Pakistan 503 000 487 000 249 000 103 000 3–8000a 1 Russia 299 000 237 000 152 000 35 000 17 700 000b > 50 UK 126 000 111 000 76 000 39 000 453 000b 5 U.S. 206 000 190 000 114 000 44 000 405 000b 3
a(Clodfelter, 1992). In the case of Iran, the 1980–1988 Iran-Iraq war was considered; for Egypt and Israel, the 1973 war; Argentina, the 1982 conflict with the UK; India and Pakistan, the 1971 war.
b(Ellis, 1993). Russian fatalities are derived from those for the USSR during WW-II.
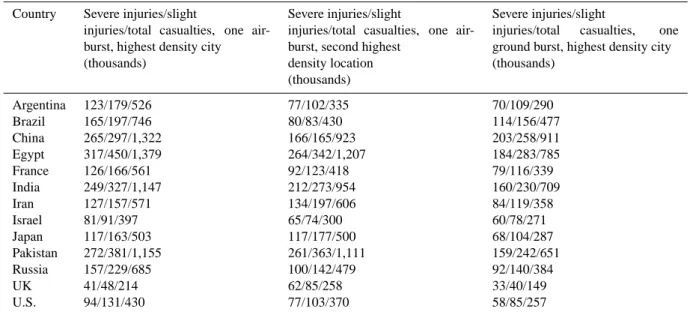
Table 5. Summary of casualties from one nuclear explosion of 15 kt yielda.
Country Severe injuries/slight
injuries/total casualties, one air-burst, highest density city (thousands)
Severe injuries/slight
injuries/total casualties, one air-burst, second highest
density location (thousands)
Severe injuries/slight
injuries/total casualties, one ground burst, highest density city (thousands) Argentina 123/179/526 77/102/335 70/109/290 Brazil 165/197/746 80/83/430 114/156/477 China 265/297/1,322 166/165/923 203/258/911 Egypt 317/450/1,379 264/342/1,207 184/283/785 France 126/166/561 92/123/418 79/116/339 India 249/327/1,147 212/273/954 160/230/709 Iran 127/157/571 134/197/606 84/119/358 Israel 81/91/397 65/74/300 60/78/271 Japan 117/163/503 117/177/500 68/104/287 Pakistan 272/381/1,155 261/363/1,111 159/242/651 Russia 157/229/685 100/142/479 92/140/384 UK 41/48/214 62/85/258 33/40/149 U.S. 94/131/430 77/103/370 58/85/257
aTotal casualties include fatalities plus all injuries. For the ground bursts casualties caused by radiation are not considered.
approach similar to ours for Pakistan and India. While a pre-cise comparison is not feasible, they estimate 2.9 million fa-talities and 7.7 million casualties if 10 cities in Pakistan and India were attacked with Hiroshima sized weapons. In our scenario we do not attack individual cities, but population concentrations. For our ten highest density regions in India and Pakistan we find 4.3 million fatalities and 8.9 million casualties.
The number of fatalities during WW-II in Hiroshima has been estimated at 140 000±10 000, and in Nagasaki, 70 000±10 000 (Ishikawa and Swain, 1981). Modern
megac-ities have higher population densmegac-ities than Hiroshima and Nagasaki, and consequently would suffer greater fatalities, as indicated in Table 4. Historical wars in most countries, in-cluding India, Pakistan, Israel, Egypt, Argentina, and Brazil, have caused fatalities (Table 4) of only a few percent of those that could be produced by a single airburst.
There are numerous uncertainties in computing fatalities and casualties. We believe that the uncertainties in our anal-ysis, such as using the casualty probability curves from Hi-roshima, and using the LandScan population database, are relatively small. For instance, in Table 4 the average ratio of
fatalities in the air and ground bursts is 1.85 for a factor of 2 change in σ2. Since the area within a given damage contour is proportional to σ2, one would expect the ratio to be 2 if the population density were uniform over the area. The ratio of 1.85, slightly less than 2, indicates that the population is con-centrated in the center of the area so that slightly less damage occurs as the zone of destruction expands. As noted in Ta-ble 3 two estimates of the Hiroshima fatalities give σ2values whose ratio is 1.3. Hence, had we chosen the casualty curve of Oughterson and Warren (1956) instead of Ishikawa and Swain (1981) we would have calculated fatalities that were about 30% lower than in Table 4. In order to investigate the sensitivity of our results to the population database we also investigated fatalities in China, India, Japan, Pakistan, and the USA using the population database from Columbia Uni-versity (CIESIN, 2004). This population database is on a coarser grid than LandScan, with a typical area per grid cell near 20 km2at the latitude of Pakistan. Hence, the popula-tion density does not vary over the typical scale of the nuclear damage area. The data we used were for 1995 from CIESIN, while LANDSCAN updates data to remain as current as pos-sible. In this case we found that with the CIESIN database fatalities were 20% greater for the USA but only 23% as large for China than with LANDSCAN. As discussed in the next section we also investigated the fatalities from attacks on the 50 most populated regions for several countries. In this case the two databases yield results within 10% for India and Japan. The CIESIN database yields 30% higher fatalities for the USA, but only 40% as high fatalities for China and about 50% for Pakistan. We believe that the CIESIN database is not on a fine enough scale to be reliable for these calcula-tions. As we discussed above a difference of about 10% is likely due to not being able to integrate the fatality curves over the population distribution. We expect, however, that the larger differences for China and Pakistan reflect the large increase in urban population that has occurred between the 1995 CIESIN database and the 2003 LandScan database. To summarize, the differences between LandScan and CIESEN are not random, but rather due to lower spatial resolution and older data in the CIESIN database, which is why we chose to use the LANDSCAN data. Likewise we chose the Ishikawa and Swain (1981) fatality curves because they were done at a later time when more data were available.
The greatest uncertainty in our fatality estimates, as noted in the introduction, is likely to lie in the targeting of the weapons, and in the types of weapons used. Table 4 shows that ground bursts are likely to produce about 75% as many fatalities as air bursts, but, as discussed later, also leave be-hind lingering radiation. We previously discussed the 33% fewer fatalities that occur if one targets the 10 largest cities in India and Pakistan rather than the ten most densely pop-ulated regions. Based on our discussions of the linear re-lation of damage area to σ2, and to the fact that the dam-age area varies linearly with yield, it follows that the fatal-ities will be roughly proportional to yield. The yield could
vary by a factor of 10 or more from our assumed 15-kt, de-pending on the sophistication of the weapons maker. There are numerous other uncertainties related to the use of the weapons. For example, the populations of some urban ar-eas vary greatly between day and night due to commuting patterns. Hence, casualties will depend on the time of day of the attack. The LandScan data base defines a 24-h aver-age population density, which therefore lies between the ex-treme possibilities. Casualties will also depend upon whether the urban areas have been evacuated in advance of the attack or whether bomb shelters exist. We have assumed there has been no evacuation, or effective use of shelters. Firstly, ur-gent evacuation of megacities has never been successfully at-tempted. Moreover, few of these cities have nuclear-capable shelters in any number. While some modern buildings are better designed to survive shock waves, and are less likely to ignite, we have implicitly assumed that all buildings would respond like those in Hiroshima during World War II. Some cities may have complex topography that may provide par-tial sheltering as in Nagasaki. As discussed in Sect. 4 some targets have several times higher populations densities and will therefore have higher fatalities than others. In this sec-tion of the paper we chose examples based on attacks on the most densely populated areas in numerous countries listed in Table 4. The effects of choosing alternative urban targets is discussed in Sect. 4.
4 Potential direct casualties in a regional war
Several groups, considering a range of exchange scenarios, estimated the direct casualties in a full-scale nuclear war prior to the collapse of the Soviet Union and the easing of tensions between the larger nuclear powers. Tens of thou-sands of weapons were available in the 1980s with most in the 100 kt to Mt yield range. Varying assumptions about tar-geting of the weapons, and the number of weapons used led to casualty estimates differing by more than a factor of ten. Another source of differences between casualty estimates is the scaling of casualty probabilities from low yield weapons, such as the one used in Hiroshima, to high yield weapons. Most researchers use blast damage to scale casualty prob-abilities. Others have used fire potential, which leads to a greater damage area and generally higher casualty figures by factors of 2.5–4 (Postol, 1986).
At the high end of casualty projections, the “Ambio” study (Middleton, 1982) assumed 14 747 detonations (173 in the Southern Hemisphere) totaling 5569 Mt. Although, as Ta-ble 1 indicates, such a conflict could still be fought today, many of the warheads would need to be taken from stor-age. The “Ambio” analysis assumed weapons exploded over nearly every city of modest size in the world (most of Africa, South America, and New Zealand were spared). Of the 1 300 000 000 people then living in urban areas of the North-ern Hemisphere, it was estimated that 750 000 000 would die
immediately, 340 000 000 would be seriously injured – and of those 200 000 000 would perish soon there after. Har-well (1984) considered an attack confined to the U.S. in-volving more than 3000 weapons and 1400 Mt yield, and found that 50 000 000–100 000 000 people might die from blast, thermal radiation, and fires. OTA (1979) summa-rized several U.S. government studies of a range of scenar-ios, including a full-scale attack on the U.S. against mili-tary and economic targets involving thousands of weapons releasing thousands of megatons of explosive energy. They suggested that casualties, primarily due to blast, would lie in the range of 20 000 000–160 000 000 people. The range of casualties was largely due to assumptions about evacu-ations of urban areas, and use of shelters. They also ex-amined a “counterforce attack,” in which military facilities were attacked while U.S. urban centers were not directly tar-geted. In this case, fatalities, due largely to fallout, were estimated to be 2 000 000–20 000 000 people. Daugherty et al. (1986) pointed out that many strategic targets lie near pop-ulation centers. They considered a counterforce attack on the U.S. with 3000 warheads and 1340 Mt yield, and deduced that 7 000 000–19 000 000 deaths might occur immediately from blast and fires in urban areas. Many more fatalities could also be associated with radioactive fallout.
In our computations we have assumed that the densest population centers in each country are targeted. There are many circumstances that could trigger a regional-scale nu-clear conflict, and many scenarios for the conduct of the en-suing war. For instance, analysts (Lavoy and Smith, 2003) suggest Pakistan and India could get into a nuclear war be-cause a conventional conflict threatened to overwhelm the strategic conventional forces or command and control struc-ture of either side. Alternatively they might launch a nuclear war to preempt a nuclear attack, real or imagined, by their ad-versary. Iran and Israel, and numerous other countries, might exchange nuclear weapons for similar reasons in the future. In our analysis we assumed that the densest population cen-ters in each country-usually in megacities-are attacked. Such an urban attack might be conducted to inflict maximum dam-age. It is likely that military targets would also be attacked. We have not attempted to locate specific military targets, and ignored casualties related to such targets, but note that many military targets are in cities. Hence the “small” wars assumed here are similar in principle, if not in scale, to the strategies for all out nuclear warfare and war fighting embraced by the superpowers in the mid-20th century in the context of “mu-tually assured destruction”.
Below we consider a nuclear war in which 50 weapons of 15 kt yield are detonated on two opposing nations. The to-tal yield in this case is 1.5 Mt, roughly 0.1% or less of the total yields proposed in previous scenarios for a full-scale nuclear war as discussed above. Such a scenario is consis-tent with the poconsis-tential arsenals of the smallest recognized nuclear powers, India and Pakistan. One may argue that this scenario is currently implausible because India and Pakistan
would need to have their entire arsenals assembled, and a high success rate of delivery to cause 50 nuclear explosions in each territory. However, other nuclear powers have many more weapons and sophisticated delivery systems and could launch such an attack. Moreover, once states begin to as-semble nuclear weapons they tend to continue to build their arsenals. For example, India may be moving toward an arse-nal comparable to that of China, Britain and France (Norris and Kristensen, 2005d). North Korea has reactors, which if completed and made fully operational, could produce enough fissionable material to produce 50 warheads per year (Norris and Kristensen, 2005b). Whether Pakistan is planning such a reactor is uncertain, but India has recently signed a treaty with the U.S. allowing the continued, and unmonitored, pro-duction of fissionable materials. Numerous countries listed in Table 2 have the uranium and/or plutonium to make very large numbers of weapons. Hence we consider an attack involving two countries using 50 low-yield weapons to be within the range of the smallest nuclear powers today, and potentially attainable by many countries in the near future.
Tables 6 and 7 present our estimates of the fatalities and casualties due to targeting 50 15-kt weapons on the leading population centers in a number of countries. The total fatal-ities in Table 6 range from 2 600 000–16 700 000. An attack on India, for example, would lead to many more fatalities than a similar attack on Pakistan because of India’s greater number of large population centers.
In most of our simulations targets cluster within the megacities located in the combatant countries. For example, Fig. 4, shows the locations of the 28 targets in Japan that fall within the Tokyo-Yokohama region for an attack on Japan using 15-kt yield weapons targeted at the 50 densest popula-tion centers. In many countries, half the fatalities occur in a single megacity in our scenario, as summarized in Fig. 5.
Figure 6 shows that fatalities are relatively uniformly spread over the 50 targets in most countries, so that fatali-ties are not strongly dependent on the details of the choice of targets. For instance, in India and for China, 19 explosions account for roughly half the total airburst fatalities from a 50 weapon attack.
The fatalities in Table 6 for a 50-weapon attack on the United States are comparable to those previously estimated for a limited or counterforce attack involving 3000 weapons and 1300 Mt (OTA, 1979; Daugherty et al., 1986). Scaled against total weapon yield, the fatalities per kiloton are 100 times greater in the small weapon scenario, even when full scale urban targeting has been considered in past scenarios (Harwell, 1984). The high fatality rate of low yield weapons is not due to any non-linear phenomena. While the use of thousands of high-yield weapons would certainly lead to more casualties than might occur in a small attack or ex-change with low-yield weapons, the number of casualties is not reduced in proportion to the total yield because of ineffi-cient use of the huge arsenals of high yield weapons. For ex-ample, even today Russia and the USA maintain much larger
Table 6. Fatality estimates for 50 15-kt detonations in urban zones.
Country Blast and Fire Fatalities: Blast and Fire Fatalities: Radiation Fatalities:
Airbursts Ground Bursts Ground Bursts
Argentina 4 337 000 2 394 000 810 000 Brazil 7 962 000 4 370 000 1 834 000 China 16 716 000 9 306 000 2 554 000 Egypt 7 834 000 4 384 000 1 656 000 France 3 509 000 1 879 000 923 000 India 12 424 000 6 494 000 2 539 000 Iran 7 431 000 4 231 000 1 371 000 Israel 2 594 000 1 538 000 323 000 Japan 5 890 000 3 023 000 1 766 000 Pakistan 9 171 000 5 112 000 1 525 000 Russia 6 273 000 3 543 000 1 299 000 UK 2 891 000 1 565 000 792 000 U.S. 4 056 000 2 203 000 872 000
Table 7. Summary of casualties from 50 weapons with 15 kt yielda.
Country Severe injuries/slight injuries/total casualties, Severe injuries/slight injuries/total casualties, 50 airburst weapons (thousands ) 50 ground burst weapons (thousands )
Argentina 1846/2233/8415 1242/1736/5371 Brazil 3522/4445/15 929 2283/3267/9920 China 6955/8560/32 230 4755/6550/20 611 Egypt 3146/3623/14 604 2219/3011/9614 France 1570/1907/6986 1037/1472/4388 India 6069/7853/26 347 3731/5552/15 776 Iran 2890/3316/13 637 2064/2772/9067 Israel 868/918/4380 693/863/3094 Japan 2991/3953/12 834 1797/2716/7536 Pakistan 3830/4562/17 563 2597/3613/11 321 Russia 2468/2897/11 638 1762/2362/7667 UK 1287/1621/5799 845/1199/3608 U.S. 1825/2305/8186 1176/1691/5070
aTotal casualties include fatalities plus all injuries. For the ground bursts radiation caused casualties are not considered.
arsenals than are needed to strike all significant military tar-gets as well as every moderate to large city in the adversary country. Many weapons are aimed at the same target, or aimed at missile silos or submarines in unpopulated regions. For high-yield weapons in the Mt range, much of the area in-side the destruction zone would be sparsely populated- even in large cities- as the population density decreases rapidly to-ward the perimeter. Therefore, based on the present results, relatively small numbers of low yield weapons targeted at densely populated urban centers may lead to similar casual-ties as in a full-scale counterforce war.
Table 6 also shows that a regional exchange between In-dia and Pakistan, in which each side used 50 weapons, could lead to more than 21 million fatalities, which is equivalent to about half of the global fatalities in WW-II. Only a small
number of weapons are needed to produce the same fatalities in a given country as occurred among that country’s citizens during WW-II, or in other major historical wars. For exam-ple, three weapons of 15-kt yield exploding in the U.S. could lead to more U.S. fatalities than occurred during all of WW-II.
The uncertainties discussed for individual targets in Sect. 3 also apply to a regional scale war. Generally we believe the greatest uncertainties have to do with targeting issues, such as the time of day of the attack and whether cities have been evacuated before an attack. For a regional scale war the num-bers and yields of weapons that are actually exploded, and the targets chosen is a significant uncertainty. As illustrated in Fig. 6 the numbers of fatalities varies almost linearly with the numbers of weapons used near the 50th target. In general
50
Fig. 4. Targeted areas in the Tokyo/Yokohama, Japanese megacity complex are identified for the scenario used in the present analysis. The axes are latitude and longitude. Of the 50 hypothetical Japanese targets, 28 are located in this urban complex. Circles of 2-km radius define the areas around target points where fires are likely. The blue shades indicate fatalities per grid cell from an airburst. No fatalities occur in the gray regions, which are shaded according to population per grid cell.
Fig. 5. Total fatalities predicted for specific megacities in several countries. The numbers on the bars represent the percentage of the country’s fatalities occurring in the megacity. Buenos Aires, Cairo, London, Moscow, New York, Paris, and Tokyo account for 46–59% of their national fatalities for the scenario treated.
52
Fig. 6. Potential fatalities caused by airbursts of 15-kt yield on each of 50 targets in the countries listed. These curves are well fit with simple analytic formulas. For example for China, Fatalities=703 442-124 303Ln(target number), for Pakistan Fatalities=528 435-11 6181Ln(target number), for the U.S. Fatalities=208 940-43 044Ln(target number).
these curves are well fit over the entire range with a relation-ship in which the number of fatalities is proportional to the natural log of the target number. Explicit equations are given in the Fig. 6 caption for several examples.
5 Radioactive fallout
In previous calculations for a full-scale nuclear war, radioac-tive fallout was a significant source of fatalities. For exam-ple, Harwell (1984) predicted about 25% of the United States land area would be exposed to a long-term fatal dose of radi-ation, resulting in 50 000 000 to 70 000 000 fatalities in addi-tion to those due to direct effects such as blast. The radioac-tivity is primarily associated with surface explosions, which are typically used to attack “hardened” or buried military tar-gets, such as missile silos. However, surface bursts generally cause fewer blast or fire fatalities. Harwell (1984), for exam-ple, found that when all of the urban explosions were surface bursts, the total number of fatalities was actually reduced by 10 000 000.
There have been numerous studies of early radioactive fallout from nuclear surface bursts, and potential exposure to energetic radiation, especially gamma rays, emitted by the residual radionuclides. Early fallout consists of the dust-borne radioactive byproducts deposited on the ground during
the first day or so after a nuclear surface explosion. Sur-face bursts raise large amounts of dust, which carries most of the short-lived radioactive isotopes released in fission deto-nations. Subsequent fallout patterns depend on the dust par-ticle size distribution, height of the stabilized debris cloud, and local weather, among other factors. Airbursts generally are assumed to produce no early fallout unless it is raining, as discussed below. In general, most of the lethal fallout from a small surface burst (e.g., 15 kt) is deposited within one to two hours of detonation, and within several tens of kilome-ters of ground zero. Moreover, the threat of fallout exposure within 2–3 km of such a burst is secondary to the hazards as-sociated with prompt radiation (emitted at the time of detona-tion), blast, and thermal radiation. Since these latter effects are directly accounted for by the casualty curves discussed above, we will not be concerned here with detailed model-ing of the fallout closer than one or two kilometers to ground zero (although the model discussed below will roughly ac-count for this fallout).
Given the complexity of the fallout problem, and sensi-tivity to parameters such as wind speed, rainfall and dust particle size that cannot be determined in advance, we uti-lize the simplified fallout model documented by Glasstone and Dolan (1977) to compute areas subject to given expo-sure levels downwind of a surface contact burst. This model was based upon experience from nuclear weapons tests.
100 1000 10000 100000 0 10 20 30 40 50 60 Downwind distance, km D os e (ra ds ) 48 hour unsheltered dose
Power law fit
0 0.2 0.4 0.6 0.8 1 1.2 1.4 1.6 1.8 2 100 1000 10000 100000 Dose, rads Cros s w ind w idt h, km
Width versus dose Power law fit
Fig. 7. (top): Potential unsheltered 48-h whole-body gamma ray dose downwind of a 15-kt ground burst based on the simplified fall-out model documented in Table 9.93 and Fig. 9.26 in Glasstone and Dolan (1977). These values do not include reductions for surface roughness, or for purposeful sheltering. The 48-h period of expo-sure is assumed to begin when fallout reaches the distance indicated, although roughly 80–90% of the total dose is received within the first 24 h. For an assumed 24 km/h steady wind with minimal verti-cal shear, the initial times range from about 10 min to 2 h after deto-nation. (bottom): Ground zero width of a given dose contour based on the same model (for example, the ground zero cross-sectional width of the area contour in which the 48-h unsheltered dose is at least 1000 rad is about 1 km); the maximum width occurs downwind of the burst at a distance determined by the wind speed at ground zero but varies little from the ground zero width. For each set of data, a power law fit is shown.
In applying the model, Table 9.93 and Fig. 9.26 of Glas-stone and Dolan (1977) are used to characterize the dose rate, and integrated dose, downwind of a 15-kt fission ground burst. The results are summarized in Fig. 7 in terms of the potential external gamma ray dose that would be received after 48 h of continuous exposure over a perfectly flat sur-face as a function of distance from the detonation. The de-rived doses must be corrected for terrain and sheltering as discussed below. Typically, 50–60% of the total fission ra-dioactivity produced by a surface burst is deposited as early fallout, and this factor is incorporated in the model (Glas-stone and Dolan, 1977; Shapiro et al., 1986).
The model (Glasstone and Dolan, 1977) assumes there is a steady 24-km/h wind with minimal wind shear. We take the wind to blow directly toward the east, as prevailing wester-lies although in reality the winds could blow in any direction, and in some countries we consider prevail toward the west. The delay in fallout exposure associated with transport from the detonation point is accounted for by estimating the arrival time using the derived distance and known wind speed. The fallout radiation dose rate decays in proportion to t−1.2, with time, t, measured in appropriate units (Glasstone and Dolan, 1977). Given an arrival time, and an exposure interval of 2 days, a dose rate “multiplying factor” can be obtained by time integration of the dose rate. The actual 48-h dose is then the product of the reference time dose rate and the multiply-ing factor.
Figure 7a shows the potential maximum 48-h whole-body dose as a function of downwind distance from a 15-kt burst obtained from the Glasstone and Dolan (1977) model. Fig-ure 7b gives the ground zero crosswind width of the contour delimiting that dose. The data in Figs. 7a and b have been fit with power law functions for convenience in our analy-sis. The 48-h unsheltered exposure at each distance directly downwind of a surface detonation can be reasonably esti-mated using the relation,
D = 266 000.L1.838 (2)
where D is the integrated dose in rad, and L is the distance from ground zero in km. Note that Eq. (2) can be inverted to give the maximum downwind extent for any specific dose, D. The simplified model of Glasstone and Dolan (1977) also predicts that, for a 15-kt fission explosion, the width of the dose contour is nearly independent of the range from the det-onation point. Hence, we further assume that for a particular dose, the contour width, W (km), remains constant over the range given by Eq. (2). The fit in Fig. 7b gives this width as,
W = 40.D0.5486. (3)
Based on the assumptions stated above, the derived exposure footprints for early fallout from a 15-kt surface burst consist of rectangular areas, L×W, defined through Eqs. (2) and (3), that extend to the east of the burst point.
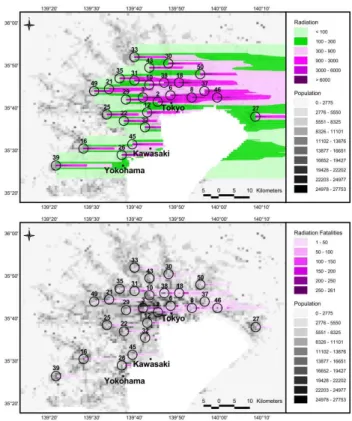
For the scenarios considered here, the population grid cells are generally comparable to or larger in width than the expo-sure contours that fall within the lethal range. Moreover, in multiple burst scenarios, the dose contours often overlap. In cases where we must estimate the affected population in sub-grid areas, we assume a uniform population density within affected grid cells, so that the exposed population is directly proportional to the fractional area. We also sum exposures from overlapping explosion contours. Figure 8a, for exam-ple, illustrates the 48-h exposures predicted for unsheltered individuals in the Tokyo-Yokohama megacity complex cor-responding to a 50-weapon attack on Japan. Note that there are many areas where a number of fallout patterns overlap in
such an attack, and the total exposure consists of the additive component exposures.
Following Daugherty et al. (1986), we assume that 50% of the population will have a sheltering factor of 3, and 50% a sheltering factor of 10. Hence, the true exposure, D′ is, D′=D/3 or D/10. The response of a population to a given acute (48-h) dose of whole-body radiation is uncertain. The dose that is lethal to 50% of the exposed individuals has been estimated in various studies to lie between 220 and 450 rad (Daugherty et al., 1986). We use 450 rad in the present anal-ysis. We further assume, based on Daugherty et al. (1986), that the fatality curve is linear with dose, and that the fatal-ity rate would be 100% at 600 rad, and 0% at 300 rad. Then the fraction of fatalities for a given acute exposure (above 300 rad) is:
αradiation fatality= (D′−300)/300; 0 < α < 1 (4)
The doses used in Eq. (4) are those modified for the effects of sheltering. Hence, the unsheltered dose rate that represents the threshold for lethality (from fallout alone) is 900 rad for 50% of the affected population, and 3000 rad for the other 50%.
Given these parameters the fallout from a 15-kt ground burst could be lethal to all the survivors of blast and fire within a zone extending roughly 8 km downwind, and 0.35 km wide. At distances greater than about 22 km from ground zero, there would be few fallout fatalities, although radiation sickness would affect a substantial number of in-dividuals exposed to radiation at 100–300 rad (with effects potentially exacerbated by other stresses, and the absence of an organized medical response). Between the epicenter of the explosion and 22 km, there would be zones of varying widths in which a fraction of the population suffers lethal exposure. For example, the dark purple areas illustrated in Fig. 8b for the Tokyo-Yokohama megacity attack scenario would be subject to numerous early fallout casualties.
There has been limited consideration in the literature of the effects of rainfall on radioactive fallout (Glasstone and Dolan, 1977). This is due in part to the fact that most high-yield weapons rise and stabilize in the atmosphere well above the region where rainfall develops. However, the stabilized height of a 15-kt airburst debris cloud is around 6000 m, which is within the middle troposphere (Glasstone and Dolan, 1977). The top of the Nagasaki mushroom cloud was estimated to be 4000–5000 m, with a base near 1200– 1300 m (Ishikawa and Swain, 1981). It follows that a 15-kt yield device initially deposits its radioactivity in the middle to lower troposphere. In this case, rapid removal is likely if the atmosphere is unstable and rainfall is occurring in the region. For this reason, atmospheric nuclear tests were det-onated in remote locations, in part to avoid local rainfall ef-fects (Glasstone and Dolan, 1977). Precipitation might scav-enge radioactive debris from the plume of an airburst at the same rate as dry sedimentation removes radioactivity from a ground-burst cloud. Moreover, rainfall could potentially
Fig. 8. (top): Map of estimated radiation doses (rads) for unshel-tered individuals in the Tokyo-Yokohama megacity. The axes refer to latitude and longitude. The black circles locate ∼2-km radius zones of destruction by fire around each target. (bottom): Locations where most of the fatalities due to early fallout would occur (the darker purple contours indicating very high fatality rates per grid cell, as discussed in the text). The background shading depicts the population per grid cell, with the darker grey representing the high-est density. Both the radiation cells and the radiation fatality grid cells are 1/25 the area of a population grid cell.
deposit twice as much radioactivity locally following an air-burst as a ground air-burst in dry weather, since in the latter case only about half the radioactivity is in the form of particles large enough to be deposited as early fallout. As discussed later the mass fires likely to occur after a nuclear explosion are capable of generating pyro-convection and possible as-sociated rainfall. However, it takes several hours after the explosion for these clouds to develop, by which time the nu-clear debris cloud will have blown away. Hence preexisting natural rainfall in the area of the explosion is the source of greatest concern for short-term radioactivity from an airburst. For the scenarios considered here, Tables 4 and 6 provide estimates of the fatalities due to the early fallout from single and multiple ground bursts without rainfall. While the radia-tion casualties are substantial in the cases treated, the total of blast, fire and radiation fatalities for ground bursts are found to be somewhat lower in general than the direct fatalities of an airburst of equivalent yield. Rainfall has the potential to increase radiation fatalities significantly.
Delayed, as opposed to early, radioactive fallout generally occurs within the first day or two after a nuclear explosion, and far downwind of ground zero. Global-scale fallout is associated mainly with high yield weapons whose radioac-tivity is deposited initially in the stratosphere, and is then slowly removed over the globe. Intermediate fallout is as-sociated with radioactive debris that remains trapped in the troposphere, and which is deposited regionally. About 500 nuclear weapons were exploded in the atmosphere world-wide prior to the nuclear test ban treaty, with a total yield expended of more than 400 Mt. Of greater relevance here, 100 airburst weapons with an average yield of 10 kt were detonated over the Nevada test site (NTS). About 61 of these devices had a high enough yield to produce measurable ra-dioactivity beyond the NTS (Bouville et al., 2002). The tests were deliberately conducted in locally dry conditions, so that the debris would remain aloft as long as possible, decaying and dispersing before returning to the surface. Occasionally hot spots, such as in northern New York State, occurred as a result of rainfall scavenging. In the U.S., the overall cu-mulative external population exposure associated with the 100 small weapons exploded at the NTS was comparable to that connected with the global fallout from the 400 Mt of large weapon tests (Bouville et al., 2002). The smaller bursts were more effective per unit fission yield because the shorter-lived fission radioisotopes were much more rapidly deposited (Bouville et al., 2002). The radioactive debris from the larger weapons was injected into the stratosphere, where it decayed significantly before reaching the ground. In counties down-wind of the NTS, average exposures of the order of 300 mrad have been estimated (Bouville et al., 2002), which is com-parable to the average annual radiation dose from natural ra-dioactivity.
In a regional-scale nuclear war, radiation doses over large areas would most likely exceed doses experienced during the NTS series. For one thing, the detonations would occur si-multaneously rather than over a decade of time, and would be deposited in the same restricted area. Moreover, local rainfall is more probable in the regions considered here, and could significantly exacerbate the local and regional depo-sition of radioactivity. The fallout simulation illustrated in Fig. 8a shows, for example, that most of the greater Tokyo area, and extending more than 100 km downwind, is subject to unprotected 48-h doses of 50 to 200 rad. In the same zone, the cumulative dose between 1 day and six months would be roughly half the values for 48-h – still a very substan-tial exposure equivalent to perhaps a thousand times back-ground. Under such circumstances, it is likely that only a small fraction of the population would remain within the ur-ban complex, being limited mainly to those directly engaged in disaster relief and civil defense activities.
While regional and global fallout are not likely to cause substantial fatalities following a war between states with small arsenals (Glasstone and Dolan, 1977), it is much more likely that large urban areas around target points would be
permanently abandoned, especially following ground bursts– or airbursts under rainy conditions. A nuclear explosion re-leases many short and long-lived radionuclides, amounting to roughly 30 000 MCi per kiloton of fission yield at one minute after detonation (Glasstone and Dolan, 1977). Thus, the evacuation of large regions would be necessary immedi-ately after a nearby surface burst. However, the deposition of long-lived radioisotopes, as occurred after the Chernobyl nuclear reactor accident in April 1986, would make early re-covery and re-colonization untenable in contaminated zones. Chernobyl released about 2.5 MCi of137Cs and 0.27 MCi of
90Sr, (Nuclear Energy Agency, 2002). In contrast, 50
nu-clear explosions of 15 kt fission yield would be expected to release about 0.2 MCi of 137Cs and 0.14 MCi of 90Sr, both with half-lives close to 30 yr. Notably, the local de-position following Chernobyl was attenuated owing to the small particle sizes released by the reactor, and most of the activity dissipated over long distances, whereas early ra-dioactive fallout would concentrate activity locally. Nev-ertheless, shortly after the Chernobyl accident, a region of 2800 km2 was evacuated, which exceeds the total area af-fected by blast in the nuclear scenarios considered here. Sev-eral other radioactive “hotspots” were located within a few hundred kilometers of Chernobyl where rainfall deposition occurred. In total, 3100 km2was contaminated by137Cs at levels above 40 Ci/km2, 7000 km2at levels between 16 and 40 Ci/km2, and 103 000 km2 between 1 and 5 Ci/km2 (Nu-clear Energy Agency, 2002). Eventually the Soviet Union adopted a ground-contamination upper-limit of 40 Ci/km2 of137Cs for permanent resettlement of population, and 15– 40 Ci/km2for temporary relocation. In this latter zone, con-sumption of contaminated food remains strictly controlled; the 193 000 people living here in 1995 received an annual dose below 500 mrads (where 300 mrads is the average an-nual dose received from natural background radioactivity) (Nuclear Energy Agency, 2002). Sixteen years after the ac-cident, 4000 km2 of agricultural land remained abandoned, including the entire area within 30 km of the reactor. Follow-ing the attack scenarios considered here, slightly smaller to-tal areas might be abandoned or strictly controlled, but these areas would be within, or adjacent to, current megacity cen-ters. Accordingly, the population and economic assets af-fected would dwarf the Chernobyl values.
The uncertainty in computing the radioactivity deposited from the explosion of 50 weapons with 15 kt yield lies in variables such as the local wind speed, and whether it was raining during the explosion. However, the greatest uncer-tainty is due to targeting issues, such as whether ground bursts are used. Fatalities due to fallout exposure depend on how well sheltered the population is, and how quickly it can evacuate the region.