HAL Id: inserm-01154781
https://www.hal.inserm.fr/inserm-01154781
Submitted on 23 May 2015HAL is a multi-disciplinary open access archive for the deposit and dissemination of sci-entific research documents, whether they are pub-lished or not. The documents may come from teaching and research institutions in France or abroad, or from public or private research centers.
L’archive ouverte pluridisciplinaire HAL, est destinée au dépôt et à la diffusion de documents scientifiques de niveau recherche, publiés ou non, émanant des établissements d’enseignement et de recherche français ou étrangers, des laboratoires publics ou privés.
Distributed under a Creative Commons Attribution| 4.0 International License
Complex dynamics for the study of neural activity in
the human brain
Aurélie Garnier, Clément Huneau, Alexandre Vidal, Fabrice Wendling, Habib
Benali
To cite this version:
Aurélie Garnier, Clément Huneau, Alexandre Vidal, Fabrice Wendling, Habib Benali. Complex dy-namics for the study of neural activity in the human brain. Journées RITS 2015, Mar 2015, Dourdan, France. pp 102-103. �inserm-01154781�
Actes des Journées Recherche en Imagerie et Technologies pour la Santé - RITS 2015 102
Complex dynamics for the study of neural activity in the human brain
A. Garnier
1∗, C. Huneau
1,2, A. Vidal
3, F. Wendling
4, H. Benali
11 Sorbonne Universit´es, UPMC Univ Paris 06, INSERM UMR S 1146, CNRS UMR 7371, Laboratoire d’Imagerie Biom´edicale (LIB),
F-75013, Paris, France.
2 Univ Paris Diderot, Sorbonne Cit´e, INSERM UMR S 1161, F-75010, Paris, France.
3 Universit´e d’ ´Evry-Val-d’Essonne, CNRS UMR 8071, Laboratoire de Math´ematiques et Mod´elisation d’ ´Evry (LaMME), F-91000, ´Evry,
France.
4 Universit´e de Rennes, INSERM U1099, Laboratoire du Traitement du Signal et de l’Image (LTSI), F-35000, Rennes, France. ∗ [email protected].
Abstract - Neural mass modeling is a part of computa-tional neuroscience that was developed to study the gene-ral behavior of interacting neuronal populations. This type of mesoscopic model is able to generate output si-gnals that are comparable with experimental data such as electroencephalograms. Classically, neural mass models consider two interconnected populations. One interaction have been modeled in two differents ways. In this work we propose and analyze a neural mass model embedding both approaches and compare the generated time series to real data.
Index Terms - Modeling, Simulation.
I. INTRODUCTION
Computational neuroscience aims at developing new mo-dels and methods to improve our understanding of com-plex relations between structure and function in the human brain. Specifically, mathematical models have been deve-loped to reproduce the complexity of neuronal population activities as accurately as possible and analyzed to iden-tify underlying dynamical mechanisms. The neural mass models, built by considering the essential interactions at a mesoscopic scale, allow us to study the global behavior of neuronal population activities and interaction mechanisms.
II. NEURAL MASS MODEL
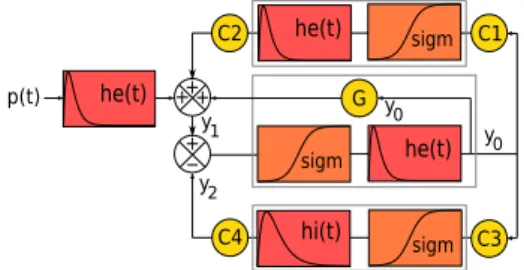
The neural mass models (NMM) classically consider in-teractions between a main population of excitatory pyra-midal cells and an inhibitory population of interneurons. These interactions are excitatory and inhibitory feedbacks on the main population. The inhibitory feedback is indirect through the interneurons, the excitatory feedback can be either indirect involving a secondary pyramidal cell popu-lation or direct. The model presented here consider all these feedbacks (Figure 1). As in the Jansen-Rit model ([4]), the state variables are the main population excitatory (y1) and inhibitory (y2) inputs and its output (y0). Classi-cally a NMM receives an inputp(t) representative of the impact of long-range neural population activities.
sigm he(t) hi(t) p(t) he(t) + y2 y0 y1 sigm he(t) C2 C1 C4 C3 G + + -sigm y0 +
Figure 1: Diagram of the NMM with double excitatory feedbacks. he(t) (hi(t)): Action potentials→ excitatory (resp. inhibitory) post-synaptic potential [1].sigm: avera-ge membrane potential→ average pulse density [2]. Ci (i∈ [[1, 4]]): coupling gains (Ci = αiC, C: maximal num-ber of synaptic connections between two populations) [3]. G: direct feedback coupling gain. p(t): excitatory input.
Following Van Rotterdam work [1], we obtain the follow-ing dynamics: y0′′= A a sigm(y1− y2)− 2 a y0′− a2y0 (1a) y1′′= A a C2sigm(C1y0) + A a G sigm(y1− y2) − 2 a y′1− a2y1+ A a p(t) (1b) y2′′= B b C4sigm(C3y0)− 2 b y′2− b2y2 (1c) wheresigm(x) = 2 e0 1+er (v0−x).
III. DYNAMICAL ANALYSIS
Four parameters of interest are considered for the dynami-cal analysis of system (1):p, the single input of the model, C, not quantifiable experimentally and α2andG, since di-rect and indidi-rect excitatory feedbacks play a fundamental role in neural activity.
This analysis allows us to establish that the model can ge-nerate five distinct behaviors (Figure 2(a)) which distribu-tion in the rectangle[G, α2]∈ [0, 80] × [0, 1] is displayed in Figure 2(b).
103 Actes des Journées Recherche en Imagerie et Technologies pour la Santé - RITS 2015 G a d e c b 0 80 70 60 50 40 30 20 10 0 1 0.9 0.8 0.7 0.6 0.5 0.4 0.3 0.2 0.1 (a) (b) α2
Figure 2: (a) Time series representative of the behaviors of the model identified by specific names and colored flags. Yellow: Noise Modulated Oscillations (NMO). Pur-ple: Noise Induced Spiking (NIS). Orange: Noise In-duced Spiking with Over Threshold Oscillations (NIS-OTO). Blue: Noise Induced Thresholded Amplitude Mo-dulation (NITAM). Green: Noise Induced Spiking with Sub-Threshold Oscillations (NIS-STO). (b) Partition of (G, α2) parameter space gathering in each region the behaviors that can be generated for(p, C)∈ [0, 1000] × [0, 400] [5].
IV. COMPARISON WITH REAL DATA Using model (1), we have generated time series sharing the essential properties of Hippocampal discharges (HD) occuring in experimental data recorded in epileptic mice (experimental protocole described in [6]). HD are char-acterized by two typical features: sparse large amplitude oscillations (as the NIS behavior) and rhythmic discharges ressembling to NIS-STO behavior. We have computed both time series spectrograms (Figure 3) showing that the oscil-lation frequencies are similar in each regime.
2 4 6 8 10 12 14 16 18 0 5 10 15 20 1mV 2s 2 4 6 8 10 12 14 16 18 0 5 10 15 20 2s 5(au)
(a) Real data
(b) Simulated data
NIS NIS-STO
Figure 3: Real (a) and simulated (b) times series and their spectrograms [7].
V. CONCLUSION
We propose a new neural mass model embedding both types of excitatory feedbacks separately used in the litera-ture. We identify the panel of behaviors that the model can generate and study how the “balance” between direct and indirect excitatory feedbacks impacts the dynamical beha-vior. We show that the model is able to generate time series
in silicomimicking experimental data.
ACKNOWLEDGMENTS
This work was performed within the Labex SMART (ANR-11-LABX-65) supported by French state funds managed by the ANR within the Investissements d’Avenir programme under reference ANR-11-IDEX-0004-02. Cl´ement Huneau holds a grant from “Fondation Leducq Transatlantic Network of Excellence on pathogenesis of small vessel disease of the brain”.
REFERENCES
[1] A. Van Rotterdam, F. H. Lopes da Silva, J. Van den Ende, M. Viergever, A. Hermans, A model of the
spatial-temporal characteristics of the alpha rhythm, Bull.
Math. Biol., 1982, Vol. 44, pp. 283-305.
[2] W. Freeman, Mass action in the nervous system, Aca-demic Press, New York, 1975.
[3] V. Braitenberg, and A. Sch¨uz, Cortex: Statistics and
Geometry of Neuronal Connectivity, Springer, 2nd
edi-tion, 1991.
[4] B.H. Jansen, and V.G. Rit, Electroencephalogram and
visual evoked potential generation in a
mathemati-cal model of coupled cortimathemati-cal columns., Biol. Cybern.,
1995, Vol. 73, pp. 357-366.
[5] A. Garnier, A. Vidal, C. Huneau, H. Benali, A neural
mass model with direct and indirect excitatory feedback loops: identification of bifurcations and temporal
dy-namics, Neural Comput. (In press).
[6] C. Huneau, P. Benquet, G. Dieuset, A. Biraben, B. Martin, and F. Wendling, Shape features of epileptic
spikes are a marker of epileptogenesis in mice.,
Epile-psia, 2013, Vol.54, pp. 2219-2227.
[7] A. Garnier, C. Huneau, A. Vidal, F. Wendling, H. Be-nali, Identification of dynamical behaviors in epileptic
discharges using a neural mass model with double
ex-citatory feedback, Proceedings of ICCSA 2014,
Nor-mandie University, Le Havre, France, 2014, pp.
205-210.
![Figure 3: Real (a) and simulated (b) times series and their spectrograms [7].](https://thumb-eu.123doks.com/thumbv2/123doknet/14338503.498911/3.892.73.403.781.1070/figure-real-simulated-b-times-series-spectrograms.webp)
