HAL Id: hal-02324676
https://hal.archives-ouvertes.fr/hal-02324676
Submitted on 26 May 2020
HAL is a multi-disciplinary open access
archive for the deposit and dissemination of
sci-entific research documents, whether they are
pub-lished or not. The documents may come from
teaching and research institutions in France or
abroad, or from public or private research centers.
L’archive ouverte pluridisciplinaire HAL, est
destinée au dépôt et à la diffusion de documents
scientifiques de niveau recherche, publiés ou non,
émanant des établissements d’enseignement et de
recherche français ou étrangers, des laboratoires
publics ou privés.
Multi-Agent System for Smart-Grid Control with
Commitment Mismatch and Congestion
Jean-Baptiste Blanc-Rouchossé, Anne Blavette, Hamid Ben Ahmed, Guy
Camilleri, Marie-Pierre Gleizes
To cite this version:
Jean-Baptiste Blanc-Rouchossé, Anne Blavette, Hamid Ben Ahmed, Guy Camilleri, Marie-Pierre
Gleizes. Multi-Agent System for Smart-Grid Control with Commitment Mismatch and Congestion.
IEEE PES Innovative Smart Grid Technologies (ISGT-Europe 2019), IEEE, Sep 2019, Bucarest,
Ro-mania. �10.1109/ISGTEurope.2019.8905760�. �hal-02324676�
Multi-Agent System for Smart-Grid Control with
Commitment Mismatch and Congestion
J-B. Blanc–Rouchoss´e
IRIT/SATIE
University of Toulouse/ENS-Rennes Toulouse/Rennes, France [email protected]
A. Blavette, H. Ben Ahmed
SATIE ENS-Rennes Rennes, France {anne.blavette, benahmed}@ens-rennes.fr
G. Camilleri, M-P. Gleizes
IRIT University of Toulouse Toulouse, France {Guy.Camilleri, Marie-Pierre.Gleizes}@irit.frAbstract—Distribution networks must become smarter. Indeed they may otherwise become subject to issues such as line congestion due to the imminent deployment of electric vehicles at a large scale. Hence, it is necessary that these electric vehicles play a role in mitigating this type of issue. The objective of this paper is to present a cooperative multi-agent system limiting these problems using an electric vehicle fleet as distributed electricity storage units.
Index Terms—Multi-Agent System, Smart Distribution System, Electric Vehicle, Vehicle-to-Grid (V2G), Balance Responsible Party, Line Congestion.
I. INTRODUCTION
The grid connection to the distribution network of an ever increasing number of electric vehicles (EVs) and of distributed power sources, such as photovoltaic (PV) panels, may raise issues on the power system, both at a local (e.g. over- or under-voltage, line congestion) and at a global level (e.g. consumption/production imbalance). In order to mitigate these issues, and thus maintain the safe and reliable operation of the entire power system, it is crucial that the distribution network become smarter and active. This implies to control the power consumption of flexible loads such as electric vehicles. This particular type of loads can also be used as storage units, which can either absorb energy from, or inject energy into, the grid. Last but not least, EVs being usually mobile (and thus disconnected) only few hours a week, they may be used for ancillary services the rest of time.
As mentioned earlier, the power consumption/production imbalance constitutes one of the issues which could be miti-gated by these ancillary services. Such imbalances are mana-ged by Balance Responsible Parties (BRPs). Their imbalances are calculated over a set of loads and power sources, called a Balance Perimeter (BP), and over an imbalance settlement period (soon to be harmonised to 15 min in Europe [ [7]]). They correspond to the difference between their day-ahead commitment in terms of power consumption/production and their actual consumption/production. Should the actual pro-duction be greater, or the actual consumption be lower, than expected, the Transmission System Operator (TSO) pays the energy mismatch to the BRP. In the opposite case, the BRP must pay for this energy mismatch to the TSO.
Line congestion is also an issue which may arise due to an excessive level of current injected into a line. Some papers already addressed these problems. For example, Tulabing et al. [1] define a hybrid centralized/decentralized control scheme called localized demand control. This control mitigates grid congestion using EVs. On the other hand, Sossan et al. [2] proposes a real time control of a battery energy storage system to compensate the mismatch between the actual aggregated consumption and the planned consumption. While these papers focus on one of the objectives, the proposed system in this paper is supposed to handle both of them.
In order to provide a scalable system in terms of grid size and number of devices, an adaptive multi-agent system approach is proposed in this paper. Indeed, this approach is characterized by a high level of scalability. It has been used by Perles et al. [3] for state estimation in electrical distribution networks.
This paper proposes an adaptive multi-agent system mana-ging the EVs charmana-ging. This paper shows how this system can handle antagonist issues encountered in the distribu-tion network: consumpdistribu-tion/producdistribu-tion mismatch between the consumption/production in a BRP perimeter and its day ahead commitment, while also taking into account that an EV must be sufficiently charged at its departure time. This paper is organized as follows: first, the considered power system is described. Second, the challenges tackled in this paper are introduced. Then, the proposed multi-agent system, called ADEMIS, is detailed. Finally, the case studies are presented followed by an analysis of obtained results.
II. POWER SYSTEM MODELING
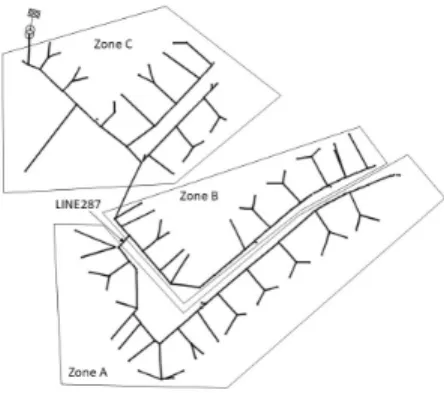
The electric grid model considered in this paper is based on the publicly available “European Low Voltage Test Feeder” electrical network model [4] shown in Fig. 1. This network represents a 3-phase, low voltage (230/400 V) distribution grid composed of 55 loads, each seemingly representing a single household. It includes several feeders connected to a 11 kV/416 V substation. Consumption times series over a single day, and averaged over one minute, are also provided as part of this model. The electric grid has been decomposed into three geographical zones. It has been simulated with power system simulator PowerFactory.
The considered EV fleet is composed of 18 EVs, each one connected to a bus to which a load is already connected. An EV is a flexible load: its consumption can be adjusted and may also be negative (i.e. it injects energy into the grid). For now, no other flexible load or static battery have been considered.
All EV batteries are characterized by the same capacity Ebatcap= 30 kW h and maximum charging or discharging power Pmax= 7 kW . The battery state is represented by the energy
stored at instant k Ebat(k). No charge/discharge energy losses
have been considered here. The battery State of Energy (SoE), defined by SoE(k) = Ebat(k)
Ebatcap , is modeled using (1), with ∆t
the simulation time step, and Pev(k) the EV charging power
absorbed from the power grid at instant k. This charging power Pev(k) is negative if the battery is discharging.
SoE(k) = SoE(k − 1) +∆t · Pev(k)
Ebatcap (1) Each EV has an arrival and a departure time supposed to be known. Moreover, the battery of each EV must be charged at a minimal SoE at departure time (SoEmin). It has been
arbitrarily set to SoEmin = 0.7. From this constraint, the
uniform charging power Pu(k) can be defined by (2), where
tr(k) is the remaining time before departure. It corresponds to the necessary charging power to have a sufficiently charged battery when EV leaves, charging it at constant power between instant k and departure time. This basic strategy is used as a reference to analyze the obtained results. This strategy has been proposed in [5].
Pu(k) =
(SoEmin− SoE(k)) · Ebat
tr(k) (2)
Rooftop photovoltaic (PV) panels are supposed to be installed with 18 loads. The energy efficiency of these pa-nels is considered constant and equal to ηP V = 0.15. The
total surface of each PV installation is arbitrarily set to S = 10 m2. The produced power PP V(k) is obtained by
PP V(k) = ηP V · S · Irr(k), where Irr(k) is the irradiance
at instant k. The irradiance data used for the simulation is from the National Renewable Energy Laboratory database [6], and corresponds to irradiance data of October 1, 2011. All
Fig. 1. Graphical representation of the European low voltage test feeder
PV panels receive the same irradiance: this is a worst case scenario. Indeed, in this paper, no smoothing effect due to the geographic distribution of these PV panels is considered. Production peaks and throughs of each PV panel are thus cumulative.
III. CHALLENGES
Electric line congestion may occur if the current flowing through this piece of electrical equipment exceeds a pre-defined rated value. It is a phenomenon which must be avoided as it may have a potentially harmful impact on the line material and endanger the grid reliability. However, such a situation is usually prevented in transmission networks by careful planning and real-time operational management, while in distribution networks, it is prevented by the sizing, and potential upgrading, of this type of grids.
However, Distribution System Operators (DSOs) seek now to postpone, or even to avoid, whenever possible, the need for such costly upgrading measures. Hence, they target an increased usage of their existent electrical infrastructures while still continuing to satisfy their corresponding constraints. This implies that the distribution grids are expected to be opera-ted closer and closer to their technical limits. Hence, under these conditions, line congestion issues may occur also in distribution networks. Therefore, this phenomenon should be considered in the real-time management strategies which are expected to be deployed by DSOs, and it has thus been taken into account in this paper.
Imbalance over the BP can also constitute one challenge, even in the ideal case where forecasts were perfect. Pho-tovoltaic electricity generation forecasts are indeed usually provided as a constant power averaged over one hour for geo-graphical areas with distributed PV panels (such as residential areas). However, the imbalance settlement period is shorter, and soon to be equal to 15 min all over Europe [7]. Hence, it is likely that a difference exists between the one hour-averaged PV power level and its 15 min-averaged counterpart, thus leading to an imbalance which has to be corrected in real-time.
IV. SYSTEM AGENTIFICATION
In order to manage the EV fleet in a way to solve the BRP imbalance and congestion issues, the Adaptive Multi-Agent System (AMAS) approach has been adopted.
A. Introduction to AMAS
An agent is an autonomous entity in an environment. It executes a cycle in a loop: it perceives its environment, makes a decision on the action to execute and executes this action [8]. It has a partial knowledge of its environment and some individual goals to achieve. In an AMAS, an agent interacts with its neighborhood in a cooperative manner, helping others agents to satisfy their goals. All these interactions are intended to generate a desired emerging collective phenomenon, which is unknown to the agents, but solely to the AMAS designer [9].
B. Agentification Compliant with the AMAS Approach In the ADEMIS system (ADaptive Energy Management In Smart grids), each physical component of the power grid is a cooperative agent. Each agent has its objective and its set of actions. At every cycle, a cooperative agent decides to act in order to pursue its own goal or to help another agent of its neighborhood. To do so, it compares its state with the state of others agents based on the criticality measure which represents the dissatisfaction of an agent regarding the achievement of its local goal. All criticalities are defined between 0 and 1.
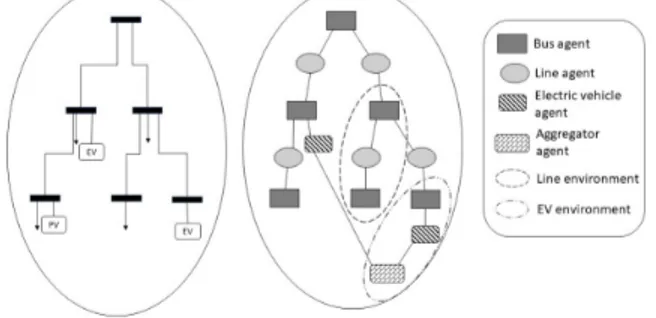
Fig. 2 illustrates the agentification of a simple electric system. Four types of agent are considered in the ADEMIS system: line agent, bus agent, BRP agent and EV agent. These agents are described in the following paragraphs.
1) Line Agent: It is intended to limit the congestion of its assigned electrical line by requesting cooperative actions from EV agents. Its neighborhood is composed of the two bus agents associated to the buses the line is connected to. First, it perceives the current in the line and calculates the corresponding effective criticality Crl(k) defined by (3),
where I(k) is the current in the line and Ithis an
arbitrarily-selected threshold. The current Imax is the maximum allowed
current in the line set arbitrarily to 95 % of the rated current. The existence of such a security margin prevents congestion from occuring in the case where an current peak presenting an amplitude of up to 5% appears suddenly. Then the line agent acts sending requests to its neighborhood. These requests are propagated into the AMAS through line and bus agents until being received by agents able to physically act on the power grid: EV agents. However, if the current line is low, it is necessary to differentiate if this is due to the low uncontrolled consumption of entities connected to the power grid (inflexible loads) or to the cooperating EVs. Indeed, in the second case, it is necessary to maintain the cooperation of the EV agents. In order to solve this problem, anticipated criticality concept has been defined. The anticipated criticality Cra,l(k)
represents the criticality with a lower dynamic. It is defined by (4), where Kl is a parameter to control its dynamics.
This anticipated criticality is supposed to converge towards the effective criticality.
Crl(k) = (I(k) − Ith)/(Imax− Ith), if I(k) ≥ Ith (3)
Cra,l(k) = Cra,l(k − 1) + Kl· (Crl(k) − Cra,l(k − 1)) (4)
Fig. 2. Example of a simple electrical system and its corresponding AMAS.
2) Bus agent: In the presented system, the role of the bus agent consists only in transferring requests sent by line agents. The neighborhood of the bus agent is line and EV agents associated to the lines and EVs connected to this bus.
3) BRP agent: It ensures that the consumption/production of the BP at the end of the commitment period is as close as possible from the commitment. Only one BRP, and thus only one BRP agent, has been considered in the system. This implies that all the consumers and producers considered in this study belong to the same BP. The BRP agent neighbors are all the EV agents in the system. Its criticality is defined by (5), where trperiod(k) is the remaining time before the
end of the current commitment period, while trperiod(k) ≥
3 min at the end of the period, and KBRP a parameter.
The variable ∆E(k), defined by (6), is the current energy mismatch between the energy consumed during the current period, starting at instant kstart, and the energy that should
have been consumed during the same period with the constant commitment power level Pcom. The power PBP(i) is the total
power consumed in the BP at instant i. CrBRP(k) = |∆E(k)| trperiod(k) · KBRP (5) ∆E(k) = k X i=kstart (PBP(i) − Pcom) · ∆t (6)
4) Electric vehicle agent: It manages the EV consumption Pev(k) (positive if the EV is charging, or negative if it is
discharging). It attempts to make the battery SoE reach its requested SoEmin at departure time. Its neighbors are the BRP agent and the agent of the bus to which its assigned EV is connected. Its criticality is defined as (7).
CrEV(k) =
(SoEmin− SoE(k)) · Ebat
Pmax· tr(k)
(7) If the criticality of the EV agent is greater than the maxi-mum criticality in its neighborhood, the battery is charged at power Pu(k) as defined in (2). Otherwise, it selects the most
critical request and cooperates such as Pev(k) = Pu(k) ±
(Crmax(k) − Crmax,2(k)) · Pmax. Criticalities Crmax(k) and
Crmax,2(k) are respectively the highest criticality and the
second highest criticality among antagonist requests compared to the most critical request. Two requests are antagonist when they require opposite actions from an agent. For instance, in this paper, an EV agent may be requested to decrease its power consumption by a neighboring agent while being simultaneously requested to increase it by another. The EV agent select the action to adopt (either increase or decrease the EV power consumption) corresponding to the most critical request: the two terms of the equation are added when the EV increases its consumption. The second term is subtracted to the first one in the case when the EV decreases its consumption.
V. CASE STUDIES
To evaluate the proposed system, a scenario where different problems are encountered is proposed: BRP imbalance, line congestion and vehicle charging constraints. The simulation scenario starts at 6 pm and ends at 7 pm. It is composed of 4 commitment periods of 15 minutes.
A. Electric Vehicles Arrival and Departure Times
EV characteristics have been arbitrarily chosen in order to create a relevant scenario demonstrating the valid behavior of the AMAS in the case where antagonist situations arise. Among the 18 EVs considered, 9 EVs are connected in zone A (Fig. 1): 7 of them arrive between 6 pm and 6:03 pm with an initial, arbitrarily selected, SoE between 0.25 and 0.4. Nine EVs are in zones B and C. Seven of them arrive at 6:15 pm with an initial SoE equal to 0.3. The 4 others EV, 2 in zone A and 2 in zone C are already connected at 6 pm. The EVs in zone A (resp. zone C) are leaving at 6:15 pm (resp. 6:30 pm) and have an initial SoE of 0.7 and 0.68 (resp. 0.7 and 0.7). Since these EVs are leaving during the considered period, they are used to check the behaviour of the system with departing shortly EVs. Fig. 3 shows a timeline indicating the arrival and departure time of EVs.
B. Commitment Temporal Settings
As explained in Section III, the BRP took a commitment towards the TSO. The commitments for the proposed sce-nario have been defined considering that consumption and PV production forecasts are perfect over 1 hour. As for the commitments, they are taken by the BRP for each of the 15 minute periods and are equal to the one hour averaged forecasts. Hence, there are deviations between the forecasts and the real consumption/production, even if the forecasts are assumed perfect.
C. Antagonist Issues
In the considered scenario, between 6:15 pm and 7:00 pm, 14 EVs are connected to the network and consume 1 kW. Between 6:00 pm and 6:15 pm, only 8 EVs are charging, 7 of them at 1 kW and 1 at 2.3 kW. Thus, the average consumption between 6:00 pm and 6:15 pm is lower than between 6:00 pm and 7:00 pm. Yet the average consumption between 6:00 pm and 7:00 pm is used to calculate the commitment. The BP is under-consuming compared to the commitment between 6:00 pm and 6:15 pm. To compensate this global under-consumption, available EVs should increase their charging power to increase the BP consumption. However, in the proposed scenario, among the 8 EVs charging between 6:00 pm and 6:15 pm, 7 of them are in zone A: the current in the departure line of the zone A (LINE287, Fig. 1) is relatively high. Moreover, inflexible loads connected in zone A have a consumption peak during this same period. The current limit in this line Imax = 40 A has been set arbitrarily
in order to have an over-current during these consumption peaks. A line congestion appears in LINE287 due to a local
Fig. 3. Electric vehicles arrival (↓) and departure (↑) times
TABLE I
ENERGY MISMATCH RATIO COMPARED TO THE BASIC CHARGING STRATEGY Kbrp 1 kW 2 kW Kl 0.002 0.005 0.010 0.005 6:00 - 6:15 pm 3.3 % 2.9 % 2.7 % 6.2 % 6:15 - 6:30 pm 1.5 % 0.0 % 1.8 % 0.8 % 6:30 - 6:45 pm 4.0 % 0.6 % 0.3 % 3.4 % 6:45 - 7:00 pm 19.0 % 12.5 % 12.5 % 21.4 %
over-consumption: EVs should decrease their consumption to reduce the current. Finally, 2 EVs in zone A have to leave at 6:15 pm: they have to charge in order to respect their SoE constraint.
VI. RESULTS
To analyze the proposed ADEMIS system, the results are compared with those obtained when the naive, non-cooperative, strategy is used and which will be referred to as ”basic charging strategy”. This simulation consists in considering that each EV is charged at uniform charging power P ev(k) = Pu(k) where Pu(k) is described in (2).
For each simulation, EVs leaving during the considered simulation period left with a SoE higher than SoEmin= 0.7.
The energy mismatches at the end of each 15 min commit-ment period with the basic charging strategy are equal to −0.790 kW h, 0.453 kW h, 0.321 kW h and 0.014 kW h. They will serve as comparison for the results using our ADEMIS system.
A. Parameters Analysis
For these studies, parameter KBRP used in the BRP agent
criticality has been taken to KBRP = 1 kW . Simulations have
been realized for multiple values of Kl, which is a parameter
included in the definition of the line agent anticipated critica-lity, as defined in (4).
Table I shows the ratios between energy mismatches at the end of each commitment period obtained with each considered study to the ones of the basic charging scenario. It shows that the ADEMIS system can reduce energy mismatches significantly. Also, it must be noted that this trend is generally relatively independent of parameter Kl. Regarding the last
period considered (6:45-7:00 pm), the energy mismatch ratio is greater than in the other periods. This is due to the fact that the energy mismatch at the end of this period is already weak with the basic charging strategy. However, Fig. 4 shows that this parameter has an important effect on the current. Indeed, when Klincreases, the line anticipated criticality dynamic increases
and EV agents respond to the request faster, as shown in Fig. 4. Hence, after a congestion is detected (i.e. the current is greater than its allowed value), the cooperation between the EVs solves this issue faster as parameter Kl increases.
However, it can be noticed that oscillations appear 6:30 pm. With a smaller Kl, there is no oscillation, but the current takes
longer time to decrease.
Four EVs left during the simulation period: EV2, EV6, EV42 having an initial SoE equal to 0.7 and EV47 having an
initial SoE equal to 0.68. For each simulation, EV2 and EV6 left with a SoE 0.72: they continued charging, even though they were sufficiently charged, in order to increase the BP consumption. The vehicles EV42 and EV47 left with a SoE equal to 0.7. Indeed, these EVs are in zone A, thus having the additional responsability to reduce the line congestion in LINE287 which also belongs to this zone. Hence, their recharge was performed only to satisfy their SoE constraint at departure time.
Finally, a simulation has been realized with Kl = 0.005
and KBRP = 2 kW to analyze the influence of parameter
KBRP. This parameter influences mainly the energy mismatch
reduction performances of the ADEMIS system. Indeed, when KBRP increases, the energy mismatch reduction for each
period increases (Table I). However, in this former simulation, the electric current in LINE287 exceeds its allowed value of 40 A for almost 3 seconds.
B. Electric Vehicle Agent Analysis
Fig. 5 shows the charging power of several vehicles for the first period, i.e. between 6:00 pm and 6:15 pm, with KBRP = 1 kW and Kl = 0.005. Since EV6 is not in zone
A, it cannot participate to the current reduction in LINE287 when the congestion event occurs. It only can cooperate with the BRP agent which is in an under-consumption state at this time. This is in line with its own recharge objective to reach SoEmin at its departure time. Thus, EV6 recharges at a higher power level than the uniform charging power in order to reduce the under-consumption issue. On the contrary, EV24 is connected in zone A. Hence, it cooperates by reducing its consumption in order to reduce the electric current level on LINE287. Finally, EV47, which is also connected in zone A, reduces its consumption as well. However, this EV leaves at 6:15 pm and still needs to charge to attain its objective. Hence, its contribution in solving the congestion issue is necessarily smaller than the one of EV24. Moreover, it further increases its consumption before the end of the period in order to satisfy its SoE constraint (SoE = 0.7) at its departure time.
VII. CONCLUSION
An adaptive multi-agent system, called ADEMIS, has been proposed to manage intelligently the recharge of an EV fleet in order to solve some technical problems: congestion in electric
Fig. 4. Current in LINE287 (kA) between 6:00 pm and 7:00 pm
Fig. 5. Electric vehicles charging power between 6:00 pm and 6:15 pm
lines, BRP energy mismatch, while ensuring the vehicles are sufficiently charged at their departure times. The implemented system has been shown to solve these problems thanks to a careful tuning of the agents parameters. The proposed solution is modular and may easily be applied to other electrical network models and generalized to other flexible loads.
In future work, additional aspects will be taken into account, such as bus voltage management and EV battery aging. Also, larger electrical network models will be considered in order to demonstrate the genericity and the scalability of the proposed system.
ACKNOWLEDGMENT
This project is funded by the French Environment and Energy Management Agency (ADEME).
REFERENCES
[1] R. Tulabing, J. James, B. Mitchell, H. Park, J.Boys, Z. Salcic, G. Covic , ”Mitigation of Local Grid Congestion Due to Electric Vehicles Through Localized Demand Control,” 2018 IEEE Innovative Smart Grid Tech-nologies - Asia (ISGT Asia), Singapore, 2018, pp. 254-259.
[2] F. Sossan, E. Namor, R. Cherkaoui, M. Paolone. Achieving the Dispa-tchability of Distribution Feeders through Prosumers Data Driven Fore-casting and Model Predictive Control of Electrochemical Storage. IEEE Transactions on Sustainable Energy 7, n 4 (octobre 2016): 176277. [3] A. Perles, G. Camilleri, M. P. Gleizes, O. Chilard, D. Croteau.
Princi-ple and Evaluation of a Self-Adaptive Multi-Agent System for State Estimation of Electrical Distribution Network. In: World Congress on Sustainable Technologies (WCST 2016), p. 17-22, 2016.
[4] IEEE Distribution Test Feeders, May 2019. http://sites.ieee.org/pes-testfeeders/
[5] M. Gardlo, L. Buzna, R. Carvalho, R. Gibbens and F. Kelly, ”Collective Effects and Performance of Algorithmic Electric Vehicle Charging Strategies,” 2018 IEEE Workshop on Complexity in Engineering (COM-PENG), Florence, Italy, 2018, pp. 1-7.
[6] Sengupta, M.; Andreas, A. (2010). Oahu Solar Measurement Grid (1-YearArchive): 1-Second Solar Irradiance; Oahu, Hawaii (Data); NREL Report No.DA-5500-56506. http://dx.doi.org/10.5439/1052451. [7] Proposal for a regulation of the European Parliament and of the Council
on the internal market for electricity (recast) COM/2016/0861 final -2016/0379 (COD)
[8] M. H. Moradi, S. Razini, and S. Mahdi Hosseinian, State of art of multiagent systems in power engineering: A review, Renew. Sustain. Energy Rev., vol. 58, pp. 814-824, 2016.
[9] Serugendo, G. D. M., Gleizes, M. P., Karageorgos, A. (Eds.). (2011). Self-organising software: From natural to artificial adaptation. Springer Science & Business Media