It Takes Two: Instrumenting the Interaction between
In-Memory Databases and Solid-State Drives
Alberto Lerner
1Jaewook Kwak
2Sangjin Lee
2Kibin Park
2Yong Ho Song
2,3Philippe Cudré-Mauroux
1 1XI Lab – University of Fribourg, Switzerland2ENC Lab – Hanyang University, Korea
3
Samsung Electronics, Korea
ABSTRACT
In-memory databases rely on non-volatile storage devices for services such as durability and recovery. SSDs can provide the high-performance these services require. When perfor-mance problems occur, however, SSDs offer no mechanism to help analyze them. The only alternative is to instrument the database side of the problem and conjecture about what might be the cause of performance degradation.
In this paper, we show that SSDs can in fact produce per-formance profiling information. We extend the Cosmos+ OpenSSD, a full-fledged SSD with open-source firmware, to track performance information on a per-IO-request granular-ity. We use such information, for instance, to analyze the in-teraction between a modern transaction log and checkpoint workloads, offering explanations to problems that were quite obscure before. We believe that an SSD providing such level of instrumentation is an essential tool towards co-designing a new class of high-performance storage/database stack.
1.
INTRODUCTION
In-memory databases have a simple interface to storage. They use a transaction log for durability and checkpoints for fast recovery. The transaction log, in particular, is the central bottleneck of an in-memory database [24]. Transac-tions need to wait while their changes become durable. To reduce the wait, some recent systems adopt parallel logging by allowing multiple threads to issue log writes simultane-ously [29, 40]. This increases the workload’s parallelism, giv-ing more opportunities for an SSD to deliver performance. Checkpoints are also critical; they are needed to accelerate the time it takes to reboot a crashed system. Recent check-pointing techniques not only adopt increased parallelism, but also increase the size of the writes request they use, compared to transaction logs [29, 30, 40].
These changes may have brought performance improve-ments but the intrinsic reasons why are unclear. Current
This article is published under a Creative Commons Attribution License (http://creativecommons.org/licenses/by/3.0/), which permits distribution and reproduction in any medium as well allowing derivative works, pro-vided that you attribute the original work to the author(s) and CIDR 2020. 10th Annual Conference on Innovative Data Systems Research (CIDR ‘20) January 12-15, 2020, Amsterdam, Netherlands.
SSDs do not provide any visibility into their internal pro-cesses that could explain why the tradeoffs were beneficial. In the absence of concrete information, system designers use intuition and empiricism instead. For instance, it is under-stood that the two in-memory workloads above – different block sizes and parallelism degrees – interfere with one an-other. The interference causes the large-block workload to get better response times than the small-block one [34]. This may explain why transaction log writes can become very er-ratic when a checkpoint workload against the same SSD is not carefully throttled [40]. Interferences also prevent the device from achieving full bandwidth when servicing both workloads, even if it does so when servicing either of them separately. We can only speculate about the root causes of such performance losses.
Many works try to address this lack of transparency. Some works propose ways of benchmarking SSDs [6, 8, 9, 35], oth-ers try to extract models for their behavior [11, 14, 19, 20, 33, 38], yet others offer sophisticated SSD simulators [12, 23, 34, 39, 42]. There are even works that try to reverse-engineer an actual SSD controller in the search for perfor-mance clues [41]. To the best of our knowledge, no SSD exists that exposes performance profiling information.
In this paper, we present an instrumentation approach that can be used to clarify many issues that occur when try-ing to understand and optimize IO workloads. Our approach is based on three mechanisms. First, we track each request inside the SSD and annotate it with timestamps that reflect its progress. Second, we keep counters in strategic places on the device that capture how available its resources are at a given point in time. Third, we keep records holding the information above in a designated area on the SSD and provide user commands to control how the area is used and when to transfer that information for analysis.
We implement our approach on the Cosmos+ OpenSSD [22], a full-fledged device whose controller is built on a System-on-a-Chip (SoC) FPGA. The Cosmos+’s firmware, Host-Interface Controller (HIC), and storage controller are open-source. We make all our firmware changes available as well1.
These mechanisms allow us to study workloads that are commonly generated by in-memory databases. We found that these workloads, when applied against SSDs, introduce several acute problems, including: (a) some Flash Transla-tion Layer (FTL) mechanisms are not efficient – for instance
1https://github.com/eXascaleInfolab/2020 cidr
… … … Channel Device Workload Outstanding Write Requests Blocks/ Pages Prior Requests Completion ✓ ✓ Request/ Pages … Package “Way” … … …
Figure 1: The device decides to which physical location to send each page in a request.
Host Command
Slice Command
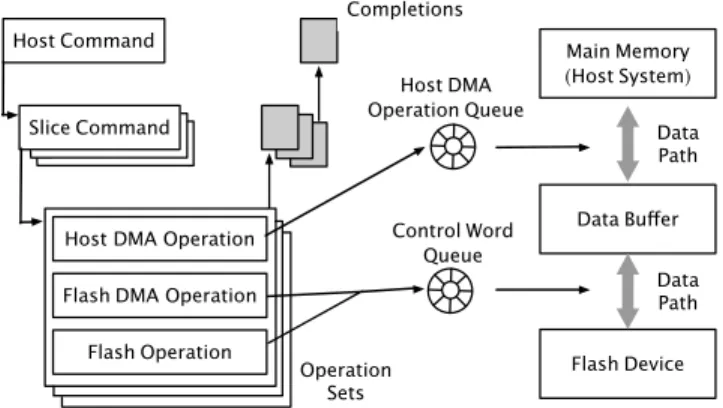
Host DMA Operation Flash DMA Operation Flash Operation Main Memory (Host System) Flash Device Data Buffer Completions Host DMA Operation Queue Control Word Queue Data Path Data Path Operation Sets
Figure 2: A command (e.g., a write request) may generate a number of operations and data transfers.
applying garbage collection and wear leveling to a circular file such as the transaction log may be unnecessary; (b) the log and the checkpoint interfere with one another – but in ways that were impossible to understand in a closed-source device.
Instrumenting the SSD allows us to find root causes for each of those problems. Explaining the problems is only the initial benefit of having an instrumented SSD. Again, to the best of our knowledge, ours is the first work addressing the performance profiling issue by having the device itself record progress information on a per-IO granularity.
The rest of this paper is organized as follows. We briefly introduce SSD architectures in Section 2 and then discuss each of our contributions, which are as follows:
• We propose a systematic approach to place meters and counters inside an SSD (Section 3);
• We discuss techniques to collect and expose the data the instrumentation produces with little impact on perfor-mance (Section 4);
• We show how the data can help in the performance anal-ysis of different in-memory workloads (Section 5); • We discuss a research agenda motivated by the insights
we gained from the instrumentation data (Section 6). We conclude the paper in Section 7.
2.
BACKGROUND
The first aspect to note about an SSD is that it is, by design, a parallel device [2]. The main components of SSDs, NAND-flash packages (chips), are parallel themselves. Each package combines several dies, each of which containing one or more planes. To simplify, we call a die-plan a way. A way has access to a disjoint set of blocks of pages and can independently service one page or block operation at a time. There is latency in setting up an operation. To hide such latency, the device tries to issue several operations in paral-lel – in a carefully interleaved fashion – each to a different way. While one operation is being set up, the previous may have started executing, and the one before that could be ready to produce results. If carefully scheduled, a series of operations can produce a continuous stream of results. We call a channel the architectural feature that groups ways so they can be scheduled as we describe above. A device can contain any number of channels that can themselves work in parallel, as Figure 1 shows. Request interleaving and chan-nel parallelism are the reasons why SSDs can deliver on the
order of GB’s per second performance while packages them-selves offer only tens of MB’s per second.
For the same reasons, SSDs are capable of servicing several requests at a time. Figure 1 also shows that an application may issue new requests without waiting for the result of the previous one. The maximum number of outstanding requests in a workload is referred to as its queue depth.
Managing such parallelism entails quite a bit of bookkeep-ing [26]. An SSD breaks down host commands (e.g., write requests) in page-sized command units, called slices. In turn, each such command generates an operation set. This latter takes care of the transfer of the request data to a staging buffer area in the device, and subsequently of moving the data again, this time into the area where it will reside. The data transfer tasks are queued for execution in different ar-eas of the device. The device needs to keep track of all the command’s components before announcing its comple-tion. Figure 2 shows the workflow of how an SSD may break down a command and handle the resulting operations.
A critical process inside SSDs is called garbage collection. This process entails keeping track of blocks with invalid (i.e., no longer used) pages. When an empty block is needed, the garbage collector selects the block with the fewer valid en-tries, moves them out, and erases the block. This process is necessary because NAND-flash can only erase entire blocks at a time. We will see in Section 5 how garbage collection can be responsible for introducing very high latency varia-tions to write requests.
It takes nothing short than a computer to perform what we describe above. A modern SSD is indeed a complete, autonomous embedded system – so far one without any per-formance introspection means.
3.
INSTRUMENTING REQUESTS
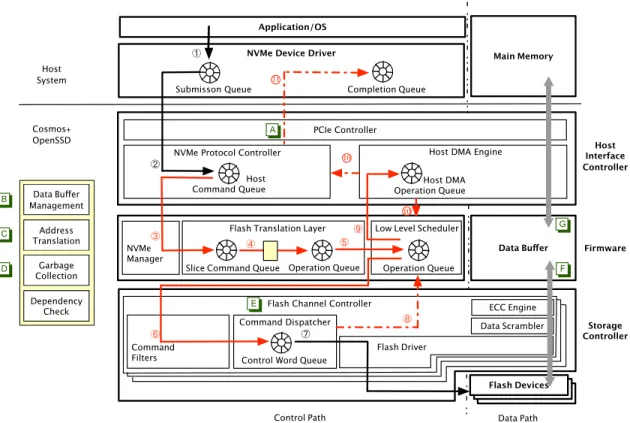
To understand the performance profile of an SSD we look at the path a request takes inside the device, which is long. Figure 3 depicts such a path in more detail. We altered the way the Cosmos+ works so that it annotates, for each IO request, the path it takes inside the device and the time it takes to do so. We call the resulting device the Instrumented Cosmos+.
A write request goes through the following steps: (1) the IO request (host command) is issued by the application and eventually reaches the device driver; (2) the NVMe Protocol Controller issues a DMA operation to bring the host
com-Application/OS
NVMe Device Driver Main Memory
PCIe Controller
Host DMA Engine
NVMe Manager
Flash Translation Layer Low Level Scheduler
Data Buffer Command Filters Flash Driver ECC Engine Data Scrambler Flash Devices
Slice Command Queue Operation Queue Operation Queue
Firmware Host DMA Operation Queue Host Interface Controller Host Command Queue NVMe Protocol Controller
Completion Queue Submisson Queue
Command Dispatcher
Control Word Queue
Storage Controller
Flash Channel Controller
Data Path Control Path Host System Cosmos+ OpenSSD 11 ! " # $ % & ' ( ) 10 10 Data Buffer Management Address Translation Garbage Collection Dependency Check
!
"!
#!
$!
%!
&!
'!
(Figure 3: Internal architecture of the Cosmos+ along with the timestamping and counter stations that we added on its instrumented version. The solid arrows represent the submission steps while the dashed arrows show the completion ones. The arrows in red represent timestamping steps. The squares in green are counter stations. We consider the example of a buffered write. Buffering a write means that the page being written will be held at the device’s data buffer instead of being written to flash; what is written to flash is the contents of the buffer page that is displaced to make space for the new request. We chose this mode because this is the most commonly implemented write mode in SSDs. Our approach applies just as well to other write modes.
mand into the device (as the PCIe controller’s role is sim-ply to packetize / depacketize messages between the host system and the NVMe Protocol Controller); (3) the FTL transforms the host command into slice commands (as the NVMe manager simply provides the command fetch path to the FTL); (4) the FTL determines the physical page to use and whether garbage collection is needed to make a page available (this is a complex step, which we break down in the yellow box on the left); (5) the FTL transforms the slice command into an operation set; (6) the Low-Level Sched-uler decides which channel/way should perform the request and transfers the operation accordingly; (7) assuming the request is a write, the Storage Controller issues a DMA op-eration to bring the page from the buffer (which was previ-ously brought from the host); (8) the Command Dispatcher notifies the scheduler of the completion of the flash opera-tion; (9) the Low-Level Scheduler issues a DMA operation to bring the page corresponding to the slice; (10) the Host DMA Engine notifies the scheduler and NVMe controller of the DMA completion; and (11) when all steps of the com-mand are done, the NVMe Protocol Controller notifies the NVMe driver of the write completion.
In the Instrumented Cosmos+, we record a timestamp every time a request goes through one of the steps between (3) and (11). The timestamps have nanosecond precision. This allows us to precisely determine how long is the wait on many of the queues in the system.
Besides the time the request takes, it is also useful to con-sider whether certain areas in the device are busy or not at a particular time. The Instrumented Cosmos+ also main-tains a number of internal counters for that reason. The counters are as follows: (A) number of completed IOPS; (B) buffer hit count; (C) read-modify-write request count; (D) block erase count; (E) several channel utilization metrics; (F) intra-device throughput; and (G) host-device through-put. These counters are incremented as a side-effect of ser-vicing requests. We describe next how this data is generated, where it is stored, and how it is accessed.
4.
INSTRUMENTATION DATA
The Instrumented Cosmos+ collects performance data in the form of records. We call these records performance event records (PEVs). There are different PEV types for different kinds of performance events as Table 1 shows. For instance, the execution of an IO request will generate a number of IO_TIMESTAMP records, one for each step we detailed in Fig-ure 3. As another example, our instrumentation generates one PERFORMANCE_INDEX record per second, with the values of the several performance counters placed on the device.
We store the PEVs in an Instrumentation Cache Area in the device’s Data Buffer (DRAM). This cache is filled in a circular fashion and is sized to hold at least 10 seconds worth of records. We found that this window of time rep-resented a good compromise. If we used a bigger area, we
PEV Record Type Freq. Record Attributes
IO TIMESTAMP ts location in the device, originating NVMe command, target logical address, channel/way (if assigned), and timestamp
GC TIMESTAMP ts FTL task, originating NVMe command, target logical address, channel/way, and timestamp
PERFORMANCE INDEX 1 sec contents of the performance counters at the device level and timestamp PERFORMANCE INDEX PER CH 1 sec contents of the performance counters at the channel level and timestamp
Table 1: Performance event record types and their descriptions. would take away too much from the Data Buffer, on which
the device depends for performance. If we used a smaller area, we would not have information enough to capture how a problem starts, escalates, and propagates through the de-vice.
We added a few device-specific NVMe commands to ma-nipulate the instrumentation cache:
• Transfer the instrumentation cache contents to the host. This command copies all the PEVs out of the device at once for analysis. We assume that the device is in a quies-cent mode, so that the transfer does not disturb an active workload.
• Set a freezing trigger. This command forces the collec-tion of instrumentacollec-tion data to stop if a certain condicollec-tion is met. By specifying a stopping criterion, we prevent the data on the instrumentation cache to be overrun. It is useful in scenarios where we would like to experiment for more than 10 seconds and are not sure which, if any, performance problem might occur.
The instrumentation mechanisms we introduce required adding approximately 1500 lines of code in the Cosmos+ OpenSSD’s firmware. These changes covered the creation of the instrumentation cache, the creation of the instrumenta-tion commands, and the generainstrumenta-tion of PEV records.
We were particularly careful to minimize the performance impact of the instrumentation features. The main concern was avoiding memory contention on the data buffer, as we can generate peaks of millions of PEVs per second to that area. This concern proved to be valid. Currently, we are able to collect instrumentation data using only half of the 8 available channels on the Cosmos+ at once. This means that the device runs at half its potential speed – but turning the instrumentation on or off does not alter the performance. We discuss several techniques we are attempting to overcome this limitation in Section 6.
5.
EXPERIMENTS
Our main (initial) goal is to characterize the sort of perfor-mance problems that occur on different kinds of in-memory databases workloads. We use the Instrumented Cosmos+ to record the workloads. We then extract and analyze the PEV data to find and explain performance issues.
5.1
Setup
The scenarios we pick appear in Table 2. Our choices reflect the evolution of in-memory DBs towards using work-loads with increasing queue depths. This is arguably a con-sequence of designing transaction logs and checkpoints that work better in machines with higher degrees of parallelism. The scenarios we adopt are as follows. In the classic method, we use a transaction logging mechanism such as ARIES [25], which allows for only one outstanding IO at a time. A number of techniques exist for scaling ARIES-style
Method Queue Depth
Block Size (1-1) Classic ARIES WAL 1 16K
IPP 1 128K
(1-N) CALC ARIES WAL 1 16K Parallel CP 8 128K (M-N) SILO/CPR Parallel Log 64 16K
Parallel CP 8 128K Table 2: Different approaches to implement durability and recovery, along with the workload characteristics we used. logging [17]. We pair this workload with that of a check-point that causes minimal interruption to logging such as the Iterative Ping-Pong (IPP) method from Cao et al. [7]. Because both these workloads have a queue depth of 1, we call the method (1-1). In the CALC method, we reproduce the workload introduced by Ren et al. [30]. The logging in this workload presents, like ARIES, a queue depth 1. The checkpointing, however, has a queue depth of 8. This allows to simulate a checkpoint on a multi-core machine typically used by in-memory databases. We call this method (1-N). In the Silo/CPR method, we reproduce workloads like the ones described in Zheng et al. [40] and Prasad et al. [29]. Both workloads have a larger queue depth, 64 for the trans-action log and 8 for the checkpoint, which is why we refer to this method as (M-N). We also ran (1-0), (M-0), (0-1), and (0-N) workloads, i.e., running workloads that only write to the transaction log with 1 and 64 queue depths, and similarly for the checkpoint workload, with 1 and 8 queue depths. These latter workloads serve as baselines.
The workloads were synthetically generated using iome-ter2, an IO generation tool. We execute each workload
against a raw partition on the device. The advantage of using a synthetic workload is that it only contains patterns that we can control. This allows us to learn how to use the data the Instrumented Cosmos+ generates.
5.2
Time Variance Analysis
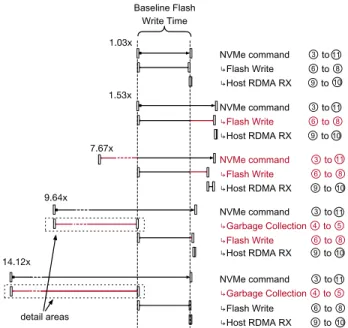
The data generated by the Instrumented Cosmos+ exhibit a large variance in IO request response times. We show in Figure 4 a representative sample of write operations that presented delays. We use as a baseline the time it takes to perform the core of the operation: the NAND-Flash program (write). The top-most write in the figure comes from a (1-0) workload and shows that a full write command can, when undisturbed, be dominated by the flash write time. The other writes in the figure show that it is not always the case. When the time deviates from the baseline, we mark the command step to blame in red.
The surprise here is to observe that garbage collection is not always the culprit. The second and third writes in
2
Figure 4 exhibit longer times than those from the baseline. These flash writes could not be serviced immediately by their designated ways. We note that the third write in Figure 4 also experienced a wait before even designating a way for the write. When the device is busy, the firmware may not tend to the FTL and the Low-Level Scheduler as fast as requests arrive.
Our experiments also show that garbage collection delays come in two varieties. We present the breakdown of each in Figure 5. In the first case, the block selected to be erased no longer contains valid pages. The time to garbage collect the block is close to the baseline block erase time. In the other case, however, the valid pages need to be copied back out of the block before it can be erased. As Figure 5 shows, this slows down the garbage collection proportionally to the number of valid pages in the block.
Garbage collection could have been faster in that case. Both the transaction log and the checkpoints are circular structures, although each with a different time to complete a cycle. Mixing pages with different lifetimes within the same block can cause longer garbage collection times [18]. In our experiments this was one of the causes of interference.
5.3
Interference Analysis
Each workload we tested utilizes the device’s resources in a different way. The (1-1) workload has low resource consumption. The requests in this workload often proceed free of interference. In contrast, the requests in the (M-N) workload go through markedly more queuing waits, as shown in Figure 6. We normalize the response times according to the baseline flash write, with 1±0.3 being the ideal range. For now, we focus on the IO requests that completed within 1.5× the baseline.
Many more requests in the (1-1) workload finish within that time than in the (M-N) one. That is what the dominant peak in the chart represents. We also see two smaller peaks surrounding it, due to small variances in the flash write times. Curiously, the first two peaks consist of only transac-tion log writes. The third peak mixes those and checkpoint writes – which are much larger writes than the former.
The instrumentation data can explain why such different IO requests take the same time. During our tests, we con-figured the Cosmos+ to have 4 channels, each with 8 ways. This setup supports 32 flash operations in parallel, provided they get properly scheduled. We look into two random IO requests on the third peak, one against the transaction log and one against the checkpoint. Figure 7 shows how the flash writes of each of the IO requests were scheduled. The log write was serviced with just one flash write, to channel 2/way 3. The checkpoint write was distributed across the four channels, using two ways in each. At the time, there were resources enough to perform all these flash writes in parallel. Both the IO requests took approximately the same time.
The question arises as to how interference among oper-ations occurs. We selected a checkpoint write that took around twice the time as the perfectly scheduled one men-tioned above. Figure 8 shows that 1 out of its 8 flash writes could not be scheduled immediately. Eventually, that write went to channel 3/way 6. The instrumentation the device collects allows us to pinpoint that a flash erase interfered with that operation. The erase was due to a log write that required garbage collection. Without the instrumentation
!"#$%&'(()*+%%%%%%%,%-' ./0)12%345-$%%%%%%%%%%%%%6%-'%7 .8'1-%9:#;%9<%%%%%%=%-' !"#$%&'(()*+%%%%%%%,%-' ./0)12%345-$%%%%%%%%%%%%%6%-'%7 .8'1-%9:#;%9<%%%%%%=%-' !"#$%&'(()*+%%%%%%%%,%-' ./0)12%345-$%%%%%%%%%%%%%%6%-'%7 .8'1-%9:#;%9<%%%%%%%=%-' .>)4?)@$%A'00$&-5'*%B%-'%C 1.03x 1.53x 14.12x !"#$%&'(()*+%%%%%%%%,%-' ./0)12%345-$%%%%%%%%%%%%%%6%-'%7 .8'1-%9:#;%9<%%%%%%%=%-' 7.67x !"#$%&'(()*+%%%%%%%%,%-' ./0)12%345-$%%%%%%%%%%%%%%6%-'%7 .8'1-%9:#;%9<%%%%%%%=%-' 9.64x .>)4?)@$%A'00$&-5'*%B%-'%C D)1$05*$%/0)12 345-$%E5($ +$-)50%)4$)1 FF FG FF FG FF FG FF FG FF FG
Figure 4: A sample of log writes’ latencies across the work-loads, and the reason they deviate from the baseline (in red) and by how much. Garbage collection is the root cause of delays for the last two requests only. The details of the steps in those two cases (detail areas) are given in Figure 5.
!"#$"%&'()**&+,-).'/',)'0 12"*-3'4"%&'()56 12"*-3'4"%&'()56 12"*-3'4"%&'()56 12"*-3'4"%&'()56 12"*-3'4"%&'()56 17879':#";& !"#$"%&'()**&+,-).'/',)'0 17879':#";& <";&*-.&'=*";> :#";&'?-@& 1.69x 1.10x
Figure 5: The breakdown of garbage collecting a block in the two cases indicated in Figure 4. The baseline is the time it takes to erase a block. Note that in the second case some valid pages were relocated prior to erasing the block.
0 20 40 60 80 100 120 0.6 0.8 1 1.2 1.4 main peak secondary peaks # of IO r equest (x1000)
normalized response time
1-1 1-N M-N
Figure 6: Response time distribution for requests from the three workloads. A response time of 1±0.3 means the re-quest finished without interference of any sort.
data, we could not separate operations that are waiting for available slots from those waiting on garbage collection.
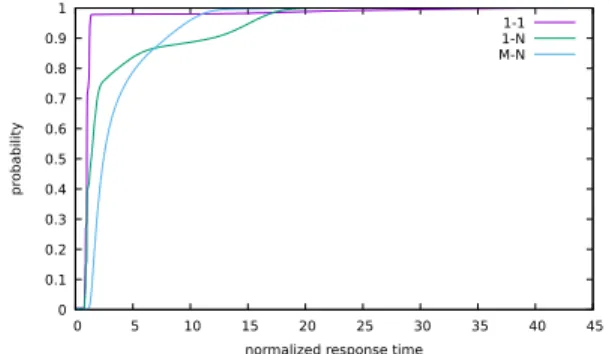
Another relevant aspect of interference within the work-loads appears when we analyze their tail behavior. Figure 9 shows the cumulative distribution function for each of the workloads. The (1-1) workload may have a large number of fast IOs since that workload does not fully utilize the de-vice’s resources. It also has the largest response time tail among all the workloads. The instrumentation data we col-lect allows us to infer the reasons for this behavior. Figure 10 shows the distribution of valid copies in each workload, that is, the number of records relocated due to garbage collec-tion. We can see that the (1-1) workload presented a larger number of valid copies in general.
We note that our goal here is not to determine which work-load is best, mainly because we study workwork-load simulations. The objective is to find how instrumentation data can give a database or FTL designer better visibility into when and how the loss of performance occurs in the device.
5.4
Instrumentation Data Size
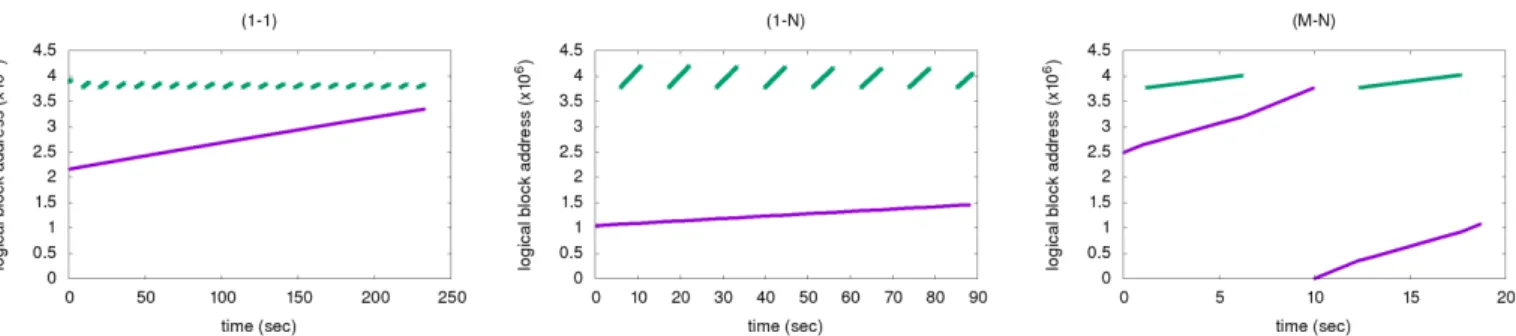
Each workload we study generates instrumentation data at a different pace. The more parallel the workload, the faster its request stream. For this reason, the (M-N) work-load can circle the instrumentation cache far faster than the (1-1) can. Figure 11 illustrates the time windows for which the device can keep instrumentation. The charts show the logical block addresses to which a workload writes as time progresses. We can observe that the device separated the log (purple) and the checkpoint (green) in disjoint areas. We can also see that the checkpoints were being rewritten from scratch at each time, whereas the log writes were circu-lar. The device can store from 6 minutes down to 18 seconds worth of instrumentation data, depending on the workload. One question was whether there was enough information in case of fast workloads. Figure 11 shows the device can fit almost two entire checkpoint cycles for the (M-N) case. That proved enough to perform interference analysis, as discussed in Section 5.3.
6.
RESEARCH AGENDA
We believe that the Instrumented Cosmos+ is a powerful tool to design and evaluate in-memory database systems. We continue to improve its instrumentation options. Also, at least two other possibilities arise from this effort. First, at times we wished the device not only produced perfor-mance data but also processed it internally – and reacted based upon its findings. Second, as the device acquires data processing capabilities, it could offer those to the database system running atop of it. We describe these fronts next.
6.1
Improved Instrumentation
The number and layouts of PEV records presented in Sec-tion 3 continues to evolve. On several occasions, we missed additional information to characterize a problem scenario further. For instance, when garbage collection delays a write because of the copying of valid pages, we may want more in-formation about those pages: when were they written, to which workload they belong, etc. Adding simple details to a PEV – enough to identify the logical blocks address of the page being copied back during post-processing – would help. Another area of investigation is triggering, the ability to stop data collection and to freeze the instrumentation data
!"#$$%&'() !"#$$%&'(* !"#$$%&'(+ !"#$$%&'(, &-.'/0 !"%!12-3$4'/0 5# 6'( ) 5# 6'( 7
Figure 7: Distribution of flash writes for a log and a check-point IO requests. Both can have the same duration if all the flash writes in each request are scheduled in parallel.
!"#$$%&'() !"#$$%&'(* !"#$$%&'(+ !"#$$%&'(, !"%!-./0$1'23 4# 5'( ) 4# 5'( 6 .%$70$8'9&#:"';%<=%:1 /$8/0$8'%;#:%
Figure 8: A delay in a checkpoint IO request. One flash write cannot be scheduled because of an ongoing garbage collection, triggered by a different request.
0 0.1 0.2 0.3 0.4 0.5 0.6 0.7 0.8 0.9 1 0 5 10 15 20 25 30 35 40 45 pr obability
normalized response time
1-1 1-N M-N
Figure 9: Cumulative distribution function for the response times in the three workloads.
0 500 1000 1500 2000 2500 3000 3500 0 5 10 15 20 25 30 35 40 45 # of r equest
# valid copies prior to an erase 1-1 1-N
Figure 10: Distribution of IO request per number of valid copies they triggered. There were no valid copies for the (M-N) workload during the instrumentation period.
when a problematic scenario arises. We initially thought that we could build triggers based on threshold durations: if a request took longer than usual in a given step, that was a sign of a problem. We discovered that large variations in the times are normal. We are currently focusing our attention on contextual triggering instead. We consider both the duration taken on a step and the instantaneous activity level that the counters show.
We would also like to allow instrumenting the Cosmos+ in an 8-channel configuration. Currently, this causes a 40% performance degradation due to the DRAM contention cre-ated by the instrumentation cache. We are looking into two
Figure 11: “Tip” of the log and checkpoint writing timelines (purple and green lines, respectively) for the different workloads. The instrumentation buffer fills faster with more parallel workloads.
options. The first one would be to instrument only a sample of the workloads. This option is useful whenever it suffices to get an approximate view of the performance issues arising in a given workload. The second option is to selectively turn some instrumentation points off. This option can help when studying problems in specific areas of the device.
6.2
Real-Time Signal Generation
When post-processing the instrumentation data, at times we wished the device took different scheduling decisions. For instance, if there is a queue up of requests, e.g., due to garbage collection activities, how should the device prior-itize the pending requests? Should transaction log writes always take priority over checkpoint writes? Usually, yes – but not always. The optimal decision depends on the re-cent write rate for each of the streams. It also depends on recovery-time thresholds in the database and how close or not the checkpoint can meet them at a given moment. Fair scheduling schemes, e.g., as Tavakkol et al. [36] suggest, and multi-streams schemes, e.g., as Kang et al. [18] propose, do not take such contextual information into consideration.
One can argue that the database can decide on how to throttle the streams without the device’s help. The database knows about recovery thresholds and it can measure the re-sponse times for log and checkpoint writes as they complete. The problems in such scheduling are at least two fold. First, the database cannot tell why a given write took longer than usual. It has no information on the source of interference and therefore may treat all slow writes as equally problem-atic. Second, the database needs to wait for writes to finish to make future decisions. This may compromise its ability to produce the maximum queue depth possible, which is essen-tial for heavy parallel SSDs to maintain peak performance.
To support this kind of collaborative scheduling we are building a few new capabilities into the device. The FTL can now take hints on how to reorder pending operations. These hints can come from either the database or from within the device. Internal hints are obtained by processing the PEV records inside the device as they are generated. Such an ability to process data inside the device has been explored by other works [10, 16, 21]. The peculiarity here is that the device is processing workload metadata – the generation of which the device controls – rather than the workload itself.
6.3
DB-SSD Co-design
The exciting possibility about the Instrumented Cosmos+ is that it can more actively participate in some of database’s tasks. This is not a new idea [31] and has evolved into
a discipline called Near-Data Processing (NDP) [3]. Only recently has there been a class of storage devices powerful enough to take extra tasks [15, 32, 37]. The Cosmos+ has such capacity left, and we are actively looking into ways to support such database-device integration.
The first step to NDP is to have FTLs cede some control of its allocation decisions to applications. There is an ongoing effort to allow this via an OpenChannel SSDs Interface [4]. This interface allows an application to be fully responsible for managing flash memory, effectively taking over the role of an FTL, as suggested by Ouyang et al. [27]. There is a growing body of work, however, that strikes a balance between a fully closed and a fully open FTL. Bonnet et al. [5] argue that SSDs can provide certain guarantees atop which to build database services. Picolini at al. [28] discuss a framework called Ox to customize FTLs functionalities.
The second step towards moving database tasks to a stor-age device is to provide a programming model. One such model was proposed in the past by Acharya et al. [1]. The model was recently revisited by Gu et al. where the authors encapsulate application tasks in SSDlets [13]. While that abstraction is useful, the framework does not address how SSDlets interact with the device’s state. It also implies that all custom functionality is implemented via software. We are investigating how to better integrate application and device logic, and are also looking into allowing application logic to be implemented by reconfigurable hardware (FPGAs).
7.
CONCLUSION
In this paper, we introduced the Instrumented Cosmos+, the first SSD to provide performance profiling capabilities. We analyzed how the two components of in-memory data-bases workloads interact: the transaction log and the check-point. The instrumentation produced by the device allowed us to explain performance problems that were completely opaque before. While instrumenting a device is just a first step toward better integrating in-memory databases and fast storage devices, we are excited by the prospects that this work creates. We continue to explore such an integration as we believe it could be a key ingredient in a whole new generation of database systems and SSDs.
ACKNOWLEDGMENT
This project has received funding from the European Re-search Council (ERC) under the European Unions Horizon 2020 research and innovation programme (grant agreement 683253/GraphInt).
REFERENCES
[1] A. Acharya, M. Uysal, and J. Saltz. Active disks: Programming model, algorithms and evaluation. ASPLOS ’98, 1998.
[2] N. Agrawal, V. Prabhakaran, T. Wobber, J. Davis, M. Manasse, and R. Panigrahy. Design tradeoffs for ssd performance. USENIX ’08.
[3] R. Balasubramonian, J. Chang, T. Manning, J. H. Moreno, R. Murphy, R. Nair, and S. Swanson. Near-data processing: Insights from a micro-46 workshop. IEEE Micro, 34(4), 2014.
[4] M. Bjørling, J. Gonzalez, and P. Bonnet. Lightnvm: The linux open-channel SSD subsystem. FAST’17, 2017. [5] P. Bonnet and L. Bouganim. Flash device support for
database management. CIDR ’11.
[6] L. Bouganim, B. J´onsson, and P. Bonnet. uflip: Understanding flash io patterns. CIDR ’09.
[7] T. Cao, M. Salles, B. Sowell, Y. Yue, A. Demers, J. Gehrke, and W. White. Fast checkpoint recovery algorithms for frequently consistent applications. SIGMOD ’11.
[8] F. Chen, B. Hou, and R. Lee. Internal parallelism of flash memory-based solid-state drives. Trans. Storage, 12(3), 2016.
[9] C. Dirik and B. Jacob. The performance of pc solid-state disks (ssds) as a function of bandwidth, concurrency, device architecture, and system organization. ISCA ’09.
[10] J. Do, Y.-S. Kee, J. M. Patel, C. Park, K. Park, and D. J. DeWitt. Query processing on smart ssds: Opportunities and challenges. SIGMOD ’13, 2013.
[11] A. Fevgas, L. Akritidis, P. Bozanis, and Y. Manolopoulos. Indexing in flash storage devices: a survey on challenges, current approaches, and future trends. The VLDB Journal, Aug 2019.
[12] D. Gouk, M. Kwon, J. Zhang, S. Koh, W. Choi, N. S. Kim, M. Kandemir, and M. Jung. Amber*: Enabling precise full-system simulation with detailed modeling of all ssd resources. MICRO’18, 2018.
[13] B. Gu, A. S. Yoon, D. Bae, I. Jo, J. Lee, J. Yoon, J. Kang, M. Kwon, C. Yoon, S. Cho, J. Jeong, and D. Chang. Biscuit: A framework for near-data processing of big data workloads. ISCA’16, 2016.
[14] J. He, S. Kannan, A. Arpaci-Dusseau, and
R. Arpaci-Dusseau. The unwritten contract of solid state drives. EuroSys ’17.
[15] Z. Istv´an, D. Sidler, and G. Alonso. Caribou: Intelligent distributed storage. Proc. VLDB Endow., 10(11), 2017. [16] I. Jo, D. Bae, A. Yoon, J. Kang, S. Cho, D. Lee, and
J. Jeong. Yoursql: A high-performance database system leveraging in-storage computing. Proc. VLDB Endow., 9(12), 2016.
[17] R. Johnson, I. Pandis, R. Stoica, M. Athanassoulis, and A. Ailamaki. Aether: A scalable approach to logging. Proc. VLDB Endow., 3(1-2), 2010.
[18] J. Kang, J. Hyun, H. Maeng, and S. Cho. The multi-streamed solid-state drive. HotStorage ’14. [19] J. Kim, P. Park, J. Ahn, J. Kim, J. Kim, and J. Kim.
Ssdcheck: Timely and accurate prediction of irregular behaviors in black-box ssds. MICRO ’18.
[20] J. Kim, K. Salem, and K. Daudjee. Write amplification: An analysis of in-memory database durability techniques. IMDM ’15, 2015.
[21] S. Kim, H. Oh, C. Park, S. Cho, S. Lee, and B. Moon. In-storage processing of database scans and joins. Information Sciences, 327, 2016.
[22] J. Kwak, S. Lee, K. Park, J. Jeong, and Y. H. Song. Cosmos+ openssd: Rapid prototype for flash storage
systems. ACM Transactions on Storage (to appear). [23] H. Li, M. Hao, M. Tong, S. Sundararaman, M. Bjørling,
and H. Gunawi. The CASE of FEMU: Cheap, accurate, scalable and extensible flash emulator. FAST ’18.
[24] N. Malviya, A. Weisberg, S. Madden, and M. Stonebraker. Rethinking main memory oltp recovery. ICDE ’14. [25] C. Mohan, D. Haderle, B. Lindsay, H. Pirahesh, and
P. Schwarz. Aries: a transaction recovery method supporting fine-granularity locking and partial rollbacks using write-ahead logging. ACM Transactions on Database Systems (TODS), 17(1), 1992.
[26] E. H. Nam, B. S. J. Kim, H. Eom, and S. L. Min. Ozone (o3): An out-of-order flash memory controller architecture. IEEE Transactions on Computers, 60(5), 2011.
[27] J. Ouyang, S. Lin, S. Jiang, Z. Hou, Y. Wang, and Y. Wang. Sdf: Software-defined flash for web-scale internet storage systems. ASPLOS ’14.
[28] I. Picoli, P. T¨oz¨un, A. Wasowski, and P. Bonnet. Programming storage controllers with ox. NVMW ’19, 2019.
[29] G. Prasaad, B. Chandramouli, and D. Kossmann. Concurrent prefix recovery: Performing cpr on a database. SIGMOD ’19.
[30] K. Ren, T. Diamond, D. Abadi, and A. Thomson.
Low-overhead asynchronous checkpointing in main-memory database systems. SIGMOD ’16.
[31] E. Riedel, C. Faloutsos, G. A. Gibson, and D. Nagle. Active disks for large-scale data processing. Computer, 34(6), 2001. [32] S. Seshadri, M. Gahagan, S. Bhaskaran, T. Bunker, A. De,
Y. Jin, Y. Liu, and S. Swanson. Willow: A user-programmable SSD. OSDI’14, 2014. [33] R. Stoica and A. Ailamaki. Improving flash write
performance by using update frequency. Proc. VLDB Endow., 6(9), 2013.
[34] A. Tavakkol, J. G´omez-Luna, M. Sadrosadati, S. Ghose, and O. Mutlu. Mqsim: A framework for enabling realistic studies of modern multi-queue SSD devices. FAST ’18. [35] A. Tavakkol, P. Mehrvarzy, M. Arjomand, and
H. Sarbazi-Azad. Performance evaluation of dynamic page allocation strategies in ssds. ACM Trans. Model. Perform. Eval. Comput. Syst., 1(2), 2016.
[36] A. Tavakkol, M. Sadrosadati, S. Ghose, J. Kim, Y. Luo,
Y. Wang, N. Mansouri Ghiasi, L. Orosa, J. G´omez-Luna,
and O. Mutlu. Flin: Enabling fairness and enhancing performance in modern nvme solid state drives. ISCA ’18. [37] L. Woods, Z. Istv´an, and G. Alonso. Ibex: An intelligent
storage engine with support for advanced sql offloading. Proc. VLDB Endow., 7(11), 2014.
[38] K. Wu, A. Arpaci-Dusseau, and R. Arpaci-Dusseau. Towards an unwritten contract of intel optane SSD. HotStorage ’19, 2019.
[39] J. Yoo, Y. Won, J. Hwang, S. Kang, J. Choil, S. Yoon, and J. Cha. Vssim: Virtual machine based ssd simulator. MSST’13, 2013.
[40] W. Zheng, S. Tu, E. Kohler, and B. Liskov. Fast databases with fast durability and recovery through multicore parallelism. OSDI ’14.
[41] A. Zuck, P. G¨uhring, T. Zhang, D. Porter, and D. Tsafrir. Why and how to increase ssd performance transparency. HotOS ’19.
[42] L. Zuolo, C. Zambelli, R. Micheloni, M. Indaco, S. D. Carlo, P. Prinetto, D. Bertozzi, and P. Olivo. Ssdexplorer: A virtual platform for performance/reliability-oriented fine-grained design space exploration of solid state drives. IEEE Transactions on Computer-Aided Design of Integrated Circuits and Systems, 34(10), 2015.