Can Silhouette Execution mitigate VM Boot
Storms?
by
Syed Aunn Hasan Raza
S.B., Computer Science and Engineering, M.I.T., May 2010
Submitted to the Department of Electrical Engineering and Computer
Science
in partial fulfillment of the requirements for the degree of
Master of Engineering in Electrical Engineering and Computer Science
at the
MASSACHUSETTS INSTITUTE OF TECHNOLOGY
September 2011
c
Massachusetts Institute of Technology 2011. All rights reserved.
Author . . . .
Department of Electrical Engineering and Computer Science
September 1, 2011
Certified by . . . .
Dr. Saman P. Amarasinghe
Professor
Thesis Supervisor
Accepted by . . . .
Dr. Christopher J. Terman
Chairman, Masters of Engineering Thesis Committee
Can Silhouette Execution mitigate VM Boot Storms?
by
Syed Aunn Hasan Raza
Submitted to the Department of Electrical Engineering and Computer Science on September 1, 2011, in partial fulfillment of the
requirements for the degree of
Master of Engineering in Electrical Engineering and Computer Science
Abstract
Server virtualization enables data centers to run many VMs on individual hosts – this reduces costs, simplifies administration and facilitates management. Improvement in hardware and virtualization technology, coupled with the use of virtualization for desktop machines with modest steady-state resource utilization, is expected to allow individual hosts to run thousands of VMs at the same time. Such high VM densities per host would allow data centers to reap unprecedented cost-savings in the future.
Unfortunately, unusually high CPU and memory pressure generated when many VMs boot up concurrently can cripple hosts that can otherwise run many VMs. Over provisioning hardware to avoid prohibitively high boot latencies that result from these – often daily – boot storms is clearly expensive.
The aim of this thesis is to investigate whether a hypervisor could theoretically exploit the overlap in the instruction streams of concurrently booting VMs to reduce CPU pressure in boot storms. This idea, which we name silhouette execution, would allow hypervisors to use the CPU in a scalable way, much like transparent page sharing allows a hypervisor to use its limited memory in a scalable fashion.
To evaluate silhouette execution, we studied user-space instruction streams from a few Linux services using dynamic instrumentation. We statistically profiled the extent of nondeterminism in program execution, and compiled the reasons behind any execution differences. Though there is significant overlap in the user-mode instruction streams of Linux services, our simple simulations show that silhouette execution would increase CPU pressure by 13% for 100 VMs and 6% for 1000 VMs. To remedy this, we present a few strategies for reducing synthetic differences in execution in user-space programs. Our simulations show that silhouette execution can reduce CPU pressure on a host by a factor of 8× for 100 VMs and a factor of 19× for 1000 VMs once these strategies are used. We believe that the insights provided in this thesis on controlling execution differences in concurrently booting VMs via dynamic instrumentation are a prelude to a successful future implementation of silhouette execution.
Thesis Supervisor: Dr. Saman P. Amarasinghe Title: Professor
Acknowledgments
I would like to thank Professor Saman Amarasinghe for his huge role in both this project and my wonderful undergraduate experience at MIT. Saman was my professor for 6.005 (Spring 2008), 6.197/6.172 (Fall 2009) and 6.035 (Spring 2009). These three exciting semesters convinced me of his unparalleled genius and inspired my interest in computer systems. Over the past year, as I have experienced the highs and lows of research, I have really benefited from Saman’s infinite insight, encouragement and patience.
As an M-Eng student, I have been blessed to work with two truly inspirational and gifted people from the COMMIT group: Marek Olszewski and Qin Zhao. Their expertise and brilliance is probably only eclipsed by their humility and helpfulness. I have learned more from Marek and Qin than I probably realize, and their knowledge of operating systems and dynamic instrumentation is invaluable and, frankly, immensely intimidating. I hope to emulate (or even approximate) their excellence some day.
This past year, I have also had the opportunity to work with Professor Srini Devadas, Professor Fraans Kaashoek, and Professor Dina Katabi as a TA for 6.005 and 6.033. It has been an extraordinarily rewarding experience, and I have learned tremendously from simply interacting with these peerless individuals. Professor Dina Katabi was especially kind to me for letting me work in G916 over the past few months.
I would like to thank Abdul Munir, whom I have known since my first day at MIT; I simply don’t deserve the unflinchingly loyal and supportive friend I have found in him. I am also indebted to Osama Badar, Usman Masood, Brian Joseph, and Nabeel Ahmed for their unrelenting support and encouragement; this past year would have been especially boring without our never-ending arguments and unproductive ‘all-nighters’. I also owe a debt of gratitude to my partners-in-crime Prannay Budhraja, Ankit Gordhandas, Daniel Firestone, Maciej Pacula, who have been great friends and collaborators over the past few years.
I am humbled by the countless sacrifices made by my family in order for me to be where I am today. My father has been the single biggest inspiration and support in my life since childhood. He epitomizes, for me, the meaning of selflessness and resilience. This thesis, my work and few achievements were enabled by – and dedicated to – him, my mother and my two siblings Ali and Zahra. Ali has been a calming influence during my years at MIT; the strangest (and most unproductive) obsessions unite us, ranging from Chinese Wuxia fiction to, more recently, The Game of Thrones. Zahra’s high-school math problems have been a welcome distraction over the past year; they have also allowed me to appear smarter than I truly am.
Finally, I would like to thank my wife Amina for her unwavering love and support throughout my stay at MIT, for improving and enriching my life every single day since I have known her, and for knowing me better than even I know myself. Through her, I have also met two exceptional individuals, Drs. Fatima and Anwer Basha, whom I have already learnt a lot from.
“It is impossible to live without failing at something, unless you live so cautiously that you might as well not have lived at all – in which case, you fail by default.”
Contents
1 Introduction 13
1.1 Motivation . . . 13
1.2 Goal of Thesis . . . 16
1.3 Contributions . . . 17
1.4 Importance of Deterministic Execution . . . 18
1.5 Thesis Organization . . . 20
2 Execution Profile of Linux Services 21 2.1 The Linux Boot Process . . . 21
2.2 Data Collection Scheme . . . 25
2.2.1 Measuring Nondeterminism in a Simple C Program . . . 26
2.2.2 Quantifying Nondeterminism . . . 31
2.3 Results for Linux services . . . 33
2.4 Summary . . . 37
3 Sources of Nondeterminism in Linux services 39 3.1 Linux Security Features . . . 39
3.2 Randomization Schemes . . . 41
3.3 Process Identification Layer . . . 42
3.4 Time . . . 44
3.5 File I/O . . . 45
3.6 Network I/O . . . 46
3.8 Signals . . . 49
3.9 Concurrency . . . 49
3.10 Architecture Specific Instructions . . . 50
3.11 Procfs: The /proc/ directory . . . 50
3.12 Summary . . . 51
4 Silhouette Execution 53 4.1 What is Silhouette execution? . . . 53
4.2 Silhouette Execution for Linux Services . . . 54
4.2.1 Precise Silhouetting . . . 57
4.2.2 Optimistic Silhouetting (excluding control flow) . . . 58
4.2.3 Optimistic Silhouetting (including control flow) . . . 59
4.3 Evaluation Scheme . . . 61
4.3.1 Computed Metrics . . . 63
4.3.2 Caveats . . . 64
4.3.3 Initial Results . . . 69
4.4 Improving Silhouette Execution . . . 73
4.4.1 Modified Data Collection Scheme . . . 73
4.4.2 Reducing Execution Differences across Instances . . . 73
4.5 Evaluation of Improved Silhouette Execution . . . 84
4.5.1 acpid . . . 86
4.5.2 anacron . . . 89
4.5.3 cron . . . 92
4.5.4 cupsd . . . 95
4.5.5 ntpd . . . 98
4.6 Limitations of Deterministic Execution . . . 99
4.7 Summary . . . 102
5 Conclusion 103 5.1 Future Work . . . 104
List of Figures
1-1 Transparent Page Sharing . . . 14
1-2 Ballooning and Hypervisor Swapping . . . 14
2-1 CPU utilization profile for a sample Ubuntu VM during boot and post-boot. . . 23
2-2 Disk utilization and throughput profile for a sample Ubuntu VM during boot and post-boot. . . 24
2-3 A summary of the actions performed by init for a booting VM . . . 25
2-4 Steps involved in measuring execution nondeterminism . . . 26
2-5 A “Hello, world!” program in C. . . 27
2-6 Excerpts from the log files generated by the execution tracing layer . 28 2-7 Excerpts from the side-by-side diff files generated by the analysis script 29 2-8 Visualization of “Hello, world!” program execution . . . 31
2-9 The cascade and propagation effects in measuring nondeterminism. . 32
2-10 Visualization of ntpd program execution (14 iterations) . . . 35
2-11 Visualization of execution differences in cron (20 iterations). . . 36
4-1 Silhouette execution is analogous to Page Sharing. . . 55
4-2 Modeling CPU overhead from precise silhouetting . . . 65
4-3 Modeling CPU overhead from optimistic silhouetting (excluding con-trol flow) . . . 66
4-4 Modeling CPU overhead from optimistic silhouetting (excluding con-trol flow) . . . 67
4-6 Virtualizing the process ID layer using Pin . . . 78 4-7 Reordering I/O events using Pin . . . 81 4-8 Improvements in A after controlling nondeterminism in Linux services. 85 4-9 For acpid, A as a function of N (highly conservative ~K) . . . 86 4-10 For acpid, A as a function of N (moderately conservative ~K) . . . . 88 4-11 For anacron, A as a function of N (highly conservative ~K) . . . 89 4-12 For anacron, A as a function of N (moderately conservative ~K) . . . 91 4-13 For cron, A as a function of N (highly conservative ~K) . . . 92 4-14 For cron, A as a function of N (moderately conservative ~K) . . . 94 4-15 For cupsd, A as a function of N (highly conservative ~K) . . . 95 4-16 For cupsd, A as a function of N (moderately conservative ~K) . . . . 97 4-17 For ntpd, A as a function of N (highly conservative ~K) . . . 98 4-18 For ntpd, A as a function of N (moderately conservative ~K) . . . 100
List of Tables
2.1 Nondeterminism profile of “Hello, world!” program (ASLR disabled) . 30
2.2 Nondeterminism profile of Linux services and daemons (ASLR
dis-abled).
The average reported here is weighted-average computed based on the number of instructions executed by each program. The period over which the programs were profiled was selected to be representative of their execution typically till the login screen is shown. Typically, the programs ran for 3-5 true (i.e without instrumentation overhead) minutes. . . 33
2.3 Measuring burstiness of nondeterminism in Linux services.
The table shows the maximum number of consecutive instructions that conflict in their side-effects or control-flow as a fraction of the total in-structions of a program. These numbers are only a small fraction of the 12% conflicting instructions in a program (see Table 2.2), which establishes that execution differences are short-lived in our sample pro-grams. . . 37
4.1 Preliminary Results from Modeling Precise Silhouetting. A, the advantage ratio is calculated by TO
TS. TO is the total instructions
that would be executed in the status quo whereas TS is the total
in-structions that would be executed under precise silhouetting. ~K (not shown in the table), represents overhead constants and was selected conservatively to be (20, 1000, 20). M is the number of system calls and memory operations made by the leader before the first active fork-point; F is the number of latent fork-points before the first active fork-point. p = 100P/I is the prefix ratio of the execution. . . 70 4.2 Preliminary Results for Optimistic Silhouetting (Excluding Control
Flow).
A, the advantage ratio is calculated by TO
TS. The variables TO, TS, M ,
F are the same as before (see Table 4.1). d = 100D/I is the portion of the execution before the first control-flow divergence. . . 71 4.3 Preliminary Results for Optimistic Silhouetting (Including Control Flow).
We exclude acpid because it had no control flow differences. A, the advantage ratio is calculated by TO
TS. The variables TO, TS, M , F are
the same as before (see Table 4.2). d = D/I is the portion of the execution before the first control-flow divergence. C and LC represent
the number of control-flow divergences and their average length re-spectively. d = 100D/I the portion of the execution before permanent execution divergence. . . 72 4.4 Improvements in A for Linux services when N = 1000 and ~K is picked
conservatively i.e. ~K = (20, 1000, 20, 40, 1000). . . 84 4.5 Improvements in A for Linux services when N = 1000 and ~K is picked
Chapter 1
Introduction
1.1
Motivation
Large organizations increasingly use virtualization to consolidate server applications in data centers, reduce operating costs, simplify administrative tasks and improve
performance scalability. As a key enabling technology behind Cloud Computing,
virtualization is shaping how computers will be used in the future.
An important reason for the success of server virtualization is that it resolves the tension between typically conflicting goals of high isolation and effective resource utilization. Ideally, organizations would assign dedicated machines for individual server applications to isolate them. However, this approach is inefficient because each application tends to utilize only a modest fraction of the underlying hardware. With the development of virtualization technology, applications can be assigned dedicated virtual machines (VMs), while many such VMs can be hosted on the same physical host for high resource utilization.
The ability to host many VMs on the same physical machine is so important to the success of server virtualization that many companies aggressively try to increase VM density per host by designing hypervisors for scalability. For instance, transparent page sharing, ballooning and hypervisor swapping (see Figures 1-1 and 1-2) allow a host to use memory overcommit i.e. run VMs with combined memory requirements that exceed the total underlying physical memory available [18].
Host Physical Memory
VM 1 VM 2 VM 3
Guest Virtual Memory
Guest Physical Memory
Host Physical Memory
VM 1 VM 2 VM 3
Guest Virtual Memory
Guest Physical Memory
Before Page Sharing:
During idle CPU cycles, the VMM compares hashes of allocated pages to identify the pages with identical content, and then refactors them as shared, read-only pages.
After Page Sharing:
Figure 1-1: Transparent Page Sharing
Guest Memory Balloon Guest Memory Balloon Guest Memory Balloon Virtual Disk Virtual Disk INFLATE DEFLATE
may page out
may page in
The VMM controls a balloon module running in the guest, and directs it to allocate guest pages and pin them in physical memory. These balloon pages can be reclaimed by the VMM. Inflating the balloon can simulate increased memory pressure in the guest, forcing it to use its own memory management routines and possibly page data out to its virtual disk.
If ballooning does not help the host reduce memory pressure, it can use hypervisor swapping and transfer some guest memory from physical memory to a swap file.
Apart from improvements in virtualization technology, two additional trends are expected to boost the attainable VM density per host in the future:
• improvements in hardware available i.e. hosts with more available memory and processor cores [3], and
• the anticipated use of Virtual Desktop Infrastructures (VDIs) [17].
In a Virtual Desktop Infrastructure (or a VDI), user desktops are hosted in VMs that reside in a data center. Users – typically company employees – access their virtual desktops via a remote display protocol. VDIs provide simplicity in administration and management: applications on these VMs can be centrally added, deleted, upgraded and patched. Organizations are increasingly investing in VDIs to reap the same benefits that are offered by server virtualization.
VDI deployments promise even higher VM densities per host than those achieved via server virtualization because desktop virtual machines typically require consid-erably less resources than server virtual machines. Because of VDIs, hundreds or thousands of identical VMs already are – or soon will be – hosted on individual hosts within data centers. This is possible because of the low steady-state CPU usage of a single virtual desktop and the aggressive use of memory overcommit.
While the steady-state behavior of desktop VMs allows many of them to be hosted on a single machine, correlated spikes in the CPU/memory usage of many VMs can suddenly cripple host machines. For instance, a boot storm [3, 5, 8, 14, 16] can occur after some software is installed or updated, requiring hundreds or thousands of identical VMs to reboot at the same time. Boot storms can be particularly frequent in VDIs because users typically show up to work at roughly the same time in the
morning each day. Concurrently booting VMs create unusually high I/O traffic,
generate numerous disk and memory allocation requests, and can saturate the host CPU. Without any idle CPU cycles, the host cannot use transparent page sharing, which also increases memory pressure. Many data centers thus simply cannot sustain a high VM density per host during boot storms without incurring prohibitively high boot latencies that result from saturated CPUs and stressed hardware.
To mitigate boot storms, data centers usually boot VMs in a staggered fashion, or invest in specialized, expensive and/or extra-provisioned hardware [4, 5]. Anecdotal evidence suggests that VDI users sometimes leave their desktop computers running overnight to prevent morning boot storms; this practice represents an unnecessary addition to already exorbitant data center energy bills [13]. While data deduplication [2] can mitigate the stress on the storage layer in a boot storm, lowered memory latency can in turn overwhelm the CPU, fiber channel, bus infrastructure or controller resources and simply turn them into bottlenecks instead [9].
With the spread of virtualization, we believe that it is important to address the boot storm problem in a way that does not skirt around the issue and enables data centers to sustain a high VM density per host even during boot storms. Page sharing is effective in general because many VMs access similar pages during execution. Inspired by this idea, we pose a few simple questions: if many identical VMs concurrently boot up on the same host, do they execute the same set of instructions? Even if there are some differences in the instructions executed, are they caused by controllable sources of nondeterminism? Ultimately, if there is a way to ensure that concurrently booting VMs execute mostly the same set of instructions, one way to retain a high VM density per host in boot storms may be remarkable simple in essence: the hypervisor could identify the overlap in the instruction streams of the VMs to avoid repetitive execution and reduce CPU pressure. Just like page sharing (i.e. eliminating page duplication) allows hosts to use memory resources in a scalable fashion in the steady-state, perhaps silhouette execution (i.e. eliminating instruction duplication) will allow hosts to use CPUs in a more scalable fashion during boot storms.
1.2
Goal of Thesis
This thesis aims to address the following questions:
1. When identical VMs boot up at the same time, how similar are the sets of instructions executed? What is the statistical profile of any differences in the executed instructions?
2. What are the source(s) of any differences in the multiple instruction streams of concurrently booting VMs?
3. Are there ways to minimize the execution differences (or nondeterminism) across multiple booting VMs?
The answers to these questions are clearly crucial in determining the feasibility of silhouette execution as a possible solution to the boot storm problem.
1.3
Contributions
For this work, we used Pin [6], a dynamic instrumentation framework, to study user-mode instruction streams from a few Linux services at boot-time. Specifically, we:
1. quantify nondeterminism in Linux services, and show that it is bursty and rare; 2. document the sources of nondeterminism in Linux services – both obvious and
obscure;
3. mathematically model the effectiveness of silhouette execution in user-space. Using simulations, we provide conservative estimates for the possible change in the number of instructions executed in user-space by a host CPU when many VMs boot up with silhouette execution than without it;
4. propose several simple techniques (e.g. I/O and signal alignment, process ID virtualization) to reduce the overhead in silhouette execution from controllable nondeterminism.
Through our simple models, we estimate that silhouette execution increases the number of instructions executed in user-space by 13% for 100 VMs and 6% for 1000 VMs over the status-quo. However, after we use our proposed strategies to reduce synthetic execution differences between VMs in our simulations, silhouette execution reduces the number of instructions executed by a factor of 8× for 100 VMs and 19× for 1000 VMs over the status-quo.
Strategies to achieve deterministic execution have been proposed at the operating system layer [1] before, but they require modifications to Linux. Nondeterminism in multi-threaded programs can be reduced via record-and-replay approaches [12] or deterministic logical clocks [11]. Our study has different goals from from either ap-proach: we wish to avoid changing existing software (to ease adoption); we also wish to make several distinct – and potentially different – executions overlap as much as possible, rather than replay one execution over and over. In our case, we do not know a priori whether two executions will behave identically or not. That the behavior of system calls or signals in Linux can lead to different results or side-effects across multiple executions of an application is well known: what is not documented is the application context in which these sources of nondeterminism originate, which we had to investigate to identify ways to improve silhouette execution.
To the best of our knowledge,
• this is the first attempt to study the statistical profile and context of execution nondeterminism across multiple instances of Linux services during boot; • exploiting overlap in instruction streams to reduce CPU pressure (i.e. silhouette
execution) is a novel design idea, and we are the first to introduce it and model its effectiveness.
Ultimately, we hope that the insights in our work will be the foundation for an implementation of silhouette execution, and in turn, a long-term solution to the VM boot storm problem.
1.4
Importance of Deterministic Execution
While our study of nondeterminism was driven by a very specific goal, deterministic execution can be beneficial in a variety of scenarios. The motivations for deterministic multithreading listed in [11, 12] apply to our work as well.
Silhouette Execution
Controlling nondeterminism in the execution of concurrently booting VMs greatly improves silhouette execution, because the hypervisor can hypothetically exploit the greater overlap or redundancy across distinct instruction streams to use the CPU in a scalable way during boot storms.
Transparent Page Sharing
Idle CPU cycles in the hypervisor are necessary for transparent page sharing to be effective in the background. Thus, reducing CPU pressure through determinism and silhouette execution clearly facilitates transparent page sharing during boot storms. More generally, removing synthetic differences due to controllable nondeterminism in the execution of concurrently running VMs can improve transparent page sharing as well, because the contents of data accessed/written are more likely to be similar when minor differences due to e.g. process IDs, timestamps or execution statistics across VMs are eliminated.
Mainstream Computing, Security and Performance
If distinct executions of the same program can be expected to execute similar sets of instructions, then significant deviations can be used to detect security attacks. Run-time detection of security attacks through the identification of anomalous executions is the focus of mainstream computing [15], and deterministic execution obviously helps in reducing false positives. Anomalous executions can also be flagged for performance debugging.
Testing
Deterministic execution in general facilitates testing, because outputs and internal state can be checked at certain points with respect to expected values. Sometimes, a particularly strong test case may be necessary for safety-critical systems: a program must execute the exact same instructions across different executions (for the same inputs).
Debugging
Erroneous behavior can be more easily reproduced via deterministic execution, which helps with debugging. Deterministic execution has much lower storage overhead than traditional record-and-replay approaches.
1.5
Thesis Organization
In what follows, Chapter 2 presents an overview of the Linux boot process, along with the dynamic instrumentation techniques we used to profile nondeterminism in Linux services. Chapter 3 presents a summary of the sources of nondeterminism discovered in this work. Chapter 4 introduces silhouette execution, outlines the simple simulations we used to model and evaluate its feasibility in user-space, and presents simple design strategies to improve its effectiveness. Finally, Chapter 5 concludes this thesis and discusses future work.
Chapter 2
Execution Profile of Linux Services
This chapter provides some background on the Linux startup process (Section 2.1). It then describes how we collected user-level instruction streams from some Linux services via dynamic instrumentation to measure nondeterminism in the Linux boot process (Section 2.2). Finally, it summarizes our results on the statistical nature of nondeterminism in Linux services (Section 2.3).2.1
The Linux Boot Process
When a computer boots up:
1. The BIOS (Basic Input/Output System) gets control and performs startup tasks for the specific hardware platform.
2. Next, the BIOS reads and executes code from a designated boot device that contains part of a Linux boot loader. Typically, this smaller part (or phase 1) loads the bulk of the boot loader code (phase 2).
3. The boot loader may present the user with options for which operating system to load (if there are multiple available options). In any case, the boot loader loads and decompresses the operating system into memory; it sets up system hardware and memory paging; finally, it transfers control to the kernel’s start kernel() function.
4. The start kernel() function performs the majority of system setup (including interrupts, remaining memory management, device initialization) before spawn-ing the idle process, the scheduler and the user-space init process.
5. The scheduler effectively takes control of system management, and kernel stays idle from now on unless externally called.
6. The init process executes scripts that set up all non-operating system services and structures in order to allow a user environment to be created, and then presents the user with a login screen.
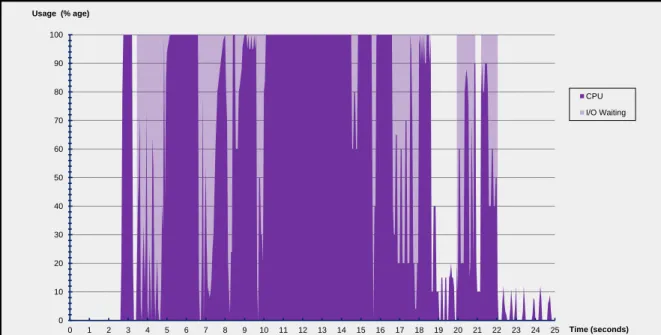
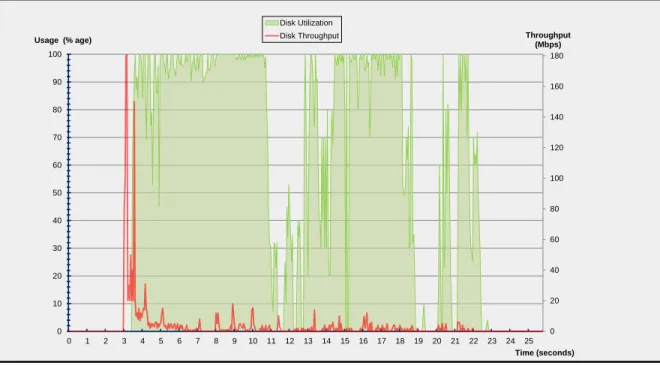
Figures 2-1 and 2-2 illustrate the CPU usage and disk activity of an Ubuntu 10.10 VM that takes about 22 seconds to complete the sixth step of the boot process (i.e. spawn the init process to set up the user environment). The Linux kernel version is 2.6.35-27-generic and the VM is configured with a single core processor with 2048 Mb RAM. Generated using the Bootchart utility [7], the figures illustrate that the booting process involves high memory and CPU overhead (Figures 2-1a and 2-2a); they also illustrate the well-known fact that memory and CPU overhead typically diminishes greatly after the boot process is completed and the machine reaches its steady-state (Figures 2-1b and 2-2b). This disparity in CPU/memory usage is the source of the boot storm problem; a single host can handle many VMs in steady-state usage but gets crippled when the same VMs boot up concurrently.
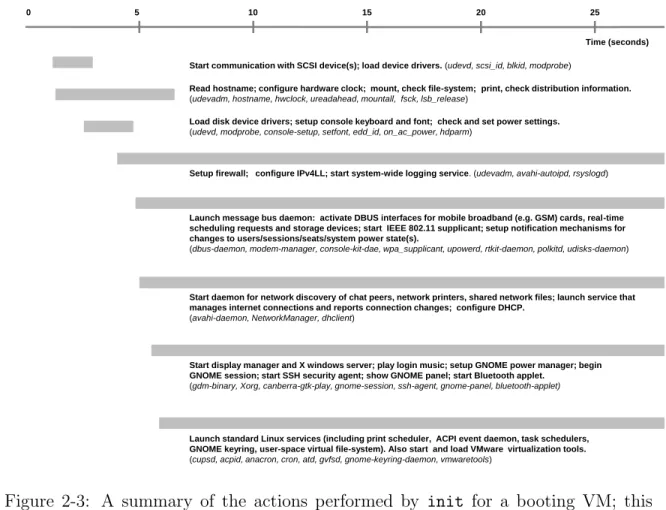
In the last step of the booting process (step 6), init typically runs many scripts located in specific directories (such as /etc/rc or /etc/init.d/). While different Linux distributions typically have their own variants of init binaries (e.g. SysV, systemd or Upstart), the init process always directly or indirectly launches several services and daemons to initialize the user desktop environment. Figure 2-3 provides a summary of the specific actions performed by init (through the subprocesses or daemons it launches) for the same Ubuntu VM used for Figures 2-1 and 2-2. The init process actually launched 361 children processes (directly and indirectly) over the 25 second period summarized by Figure 2-3. Most of them were ephemeral processes; several processes were repeatedly launched in different contexts (e.g. getty or grep).
0 10 20 30 40 50 60 70 80 90 100 0 1 2 3 4 5 6 7 8 9 10 11 12 13 14 15 16 17 18 19 20 21 22 23 24 25 CPU I/O Waiting Usage (% age) Time (seconds)
(a) CPU utilization immediately after init is started.
0 10 20 30 40 50 60 70 80 90 100 300 301 302 303 304 305 306 307 308 309 310 311 312 313 314 315 316 317 318 319 320 321 322 323 324 325 CPU I/O Waiting Usage (% age) Time (seconds)
(b) CPU utilization 5 minutes after init is started.
Figure 2-1: CPU utilization profile for a sample Ubuntu VM during boot and post-boot.
0 20 40 60 80 100 120 140 160 180 0 10 20 30 40 50 60 70 80 90 100 0 1 2 3 4 5 6 7 8 9 10 11 12 13 14 15 16 17 18 19 20 21 22 23 24 25 Throughput (Mbps) Disk Utilization Disk Throughput Usage (% age) Time (seconds)
(a) Disk utilization and throughput immediately after init is started.
0 0.5 1 1.5 2 2.5 3 3.5 4 4.5 5 0 10 20 30 40 50 60 70 80 90 100 300 301 302 303 304 305 306 307 308 309 310 311 312 313 314 315 316 317 318 319 320 321 322 323 324 325 Throughput (Mbps) Disk Utilization Disk Throughput Usage (% age) Time (seconds)
(b) Disk utilization and throughput 5 minutes after init is started.
Figure 2-2: Disk utilization and throughput profile for a sample Ubuntu VM during boot and post-boot.
Start communication with SCSI device(s); load device drivers. (udevd, scsi_id, blkid, modprobe)
Read hostname; configure hardware clock; mount, check file-system; print, check distribution information.
(udevadm, hostname, hwclock, ureadahead, mountall, fsck, lsb_release)
Load disk device drivers; setup console keyboard and font; check and set power settings.
(udevd, modprobe, console-setup, setfont, edd_id, on_ac_power, hdparm)
Setup firewall; configure IPv4LL; start system-wide logging service. (udevadm, avahi-autoipd, rsyslogd) Launch message bus daemon: activate DBUS interfaces for mobile broadband (e.g. GSM) cards, real-time scheduling requests and storage devices; start IEEE 802.11 supplicant; setup notification mechanisms for changes to users/sessions/seats/system power state(s).
(dbus-daemon, modem-manager, console-kit-dae, wpa_supplicant, upowerd, rtkit-daemon, polkitd, udisks-daemon)
Start daemon for network discovery of chat peers, network printers, shared network files; launch service that manages internet connections and reports connection changes; configure DHCP.
(avahi-daemon, NetworkManager, dhclient)
Start display manager and X windows server; play login music; setup GNOME power manager; begin GNOME session; start SSH security agent; show GNOME panel; start Bluetooth applet.
(gdm-binary, Xorg, canberra-gtk-play, gnome-session, ssh-agent, gnome-panel, bluetooth-applet)
Launch standard Linux services (including print scheduler, ACPI event daemon, task schedulers, GNOME keyring, user-space virtual file-system). Also start and load VMware virtualization tools.
(cupsd, acpid, anacron, cron, atd, gvfsd, gnome-keyring-daemon, vmwaretools)
0 5 10 15 20 25 Time (seconds)
Figure 2-3: A summary of the actions performed by init for a booting VM; this figure has the same time line (0-25 seconds) as Figures 2-1a and 2-2a.
The processes singled out in Figure 2-3 are the ones that either stayed alive through most of the boot process till the end, performed important boot actions, or spawned many sub-processes themselves.
2.2
Data Collection Scheme
Pin and DynamoRio are runtime frameworks that enable inspection and arbitrary transformation of user-mode application code as it executes. We used both Pin and DynamoRio to study the behavior of Linux services independently; this allowed us to verify the accuracy of our results. However, we relied on Pin more than DynamoRio because it gets injected into application code earlier than DynamoRio and therefore provides greater instruction coverage for our purpose. Figure 2-4 shows the simple steps involved in collecting data on nondeterminism using dynamic instrumentation.
Instance 1
Execution logs (each file is usually of size between 1-5 gigabytes)
Execution Tracing Layer (Pin or DynamoRio Tool)
Instance 2 Instance N
Analysis Script
The analysis script uses the Linux diff utility to perform a pairwise comparison on the execution logs collected.
Visualization Script
The visualization script parses the output of the analysis script, collects statistics on the differences between logs, and graphs these differences.
Figure 2-4: Steps involved in measuring execution nondeterminism.
The next section explains each of these steps in detail, using a simple “Hello, world!” program as an illustrative example.
2.2.1
Measuring Nondeterminism in a Simple C Program
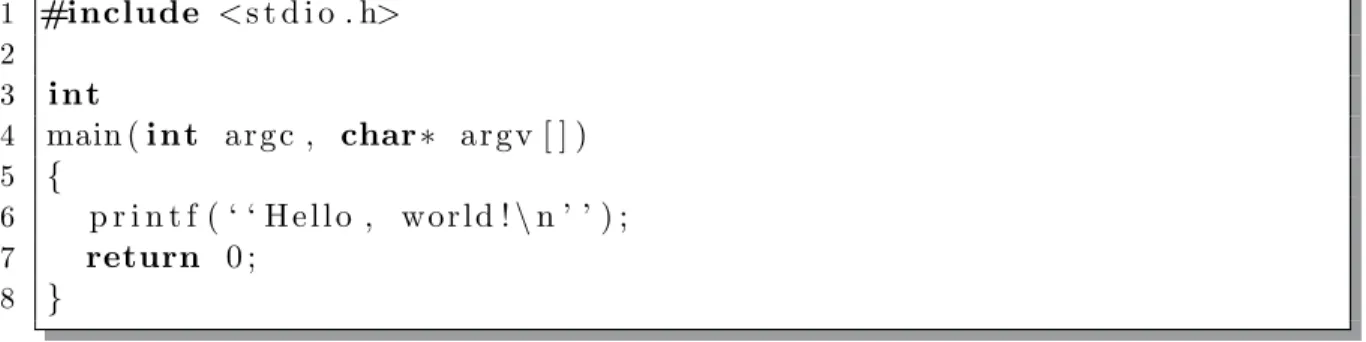
This section outlines the data collection scheme described in Figure 2-4 in detail with the help of an example: the simple “Hello, world!” program outlined in Figure 2-5. For this example, we disabled ASLR (Address Space Layout Randomization) on the Ubuntu VM described in section 2.1 by using sysctl kernel randomize va space=0.
Execution Tracing Layer
As shown in Figure 2-4, the first step in data collection involves running the target program a few times across identical VMs. Ideally, these different executions are scheduled concurrently or as close as possible in time to model the boot storm scenario
1 #include <s t d i o . h> 2 3 i n t 4 main ( i n t a r g c , char ∗ a r g v [ ] ) 5 { 6 p r i n t f ( ‘ ‘ H e l l o , w o r l d ! \ n ’ ’ ) ; 7 return 0 ; 8 }
Figure 2-5: A “Hello, world!” program in C.
accurately. As part of the execution tracing layer, we wrote a Pin tool that:
1. logs each x86 instruction executed by the target process, along with the new values of any affected registers,
2. records values written to or read from memory,
3. intercepts all signals received, and records the instruction counts corresponding to the timing of any signals, and
4. monitors all system calls made by the target process, and logs any corresponding side-effects to memory or registers.
For simplicity, our Pin tool traces the main process or thread for an application and does not follow any child processes or threads that it spawns. This prevents us from including the user-mode instructions executed from child processes in our traces, but we get sufficiently high coverage to get a good understanding of the target program’s behavior. We treat spawned child processes as part of the outside world, and trace their interactions with the original process (e.g. via signals or pipes).
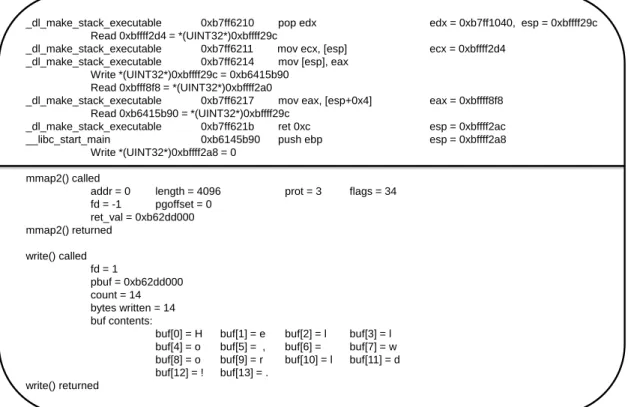
Implementation of the execution tracing layer required a close examination of the Linux system call interface; we had to identify the side-effects of each system call. Figure 2-6 shows an excerpt from a trace generated by our Pin tool while running the “Hello, World” program. Our tool records every instruction executed in user-space by the process for the target application once Pin gets control; this allows us to include program initialization and library code in our analysis.
_dl_make_stack_executable 0xb7ff6210 pop edx edx = 0xb7ff1040, esp = 0xbffff29c Read 0xbffff2d4 = *(UINT32*)0xbffff29c
_dl_make_stack_executable 0xb7ff6211 mov ecx, [esp] ecx = 0xbffff2d4 _dl_make_stack_executable 0xb7ff6214 mov [esp], eax
Write *(UINT32*)0xbffff29c = 0xb6415b90 Read 0xbfff8f8 = *(UINT32*)0xbffff2a0
_dl_make_stack_executable 0xb7ff6217 mov eax, [esp+0x4] eax = 0xbffff8f8 Read 0xb6415b90 = *(UINT32*)0xbffff29c
_dl_make_stack_executable 0xb7ff621b ret 0xc esp = 0xbffff2ac __libc_start_main 0xb6145b90 push ebp esp = 0xbffff2a8
Write *(UINT32*)0xbffff2a8 = 0 mmap2() called
addr = 0 length = 4096 prot = 3 flags = 34 fd = -1 pgoffset = 0 ret_val = 0xb62dd000 mmap2() returned write() called fd = 1 pbuf = 0xb62dd000 count = 14 bytes written = 14 buf contents:
buf[0] = H buf[1] = e buf[2] = l buf[3] = l buf[4] = o buf[5] = , buf[6] = buf[7] = w buf[8] = o buf[9] = r buf[10] = l buf[11] = d buf[12] = ! buf[13] = .
write() returned
Figure 2-6: Excerpts from the log files generated by the execution tracing layer. The top half shows x86 instructions executed in user-space by the “Hello, world!” process, including instruction addresses, limited symbolic information, affected register values and memory addresses. The lower half shows part of the system call log.
Analysis Script
The analysis script uses the Linux diff utility to perform pairwise comparisons of the log files generated by multiple executions of the target application. Using the suppress-common, side-by-side and minimal flags, the analysis script produces two output files:
1. A delta file that contains only instructions that were either conflicting between the two logs or missing in one log, and
2. A union file that contains all instructions executed in the two logs, but distin-guishes instructions included in the delta file from others.
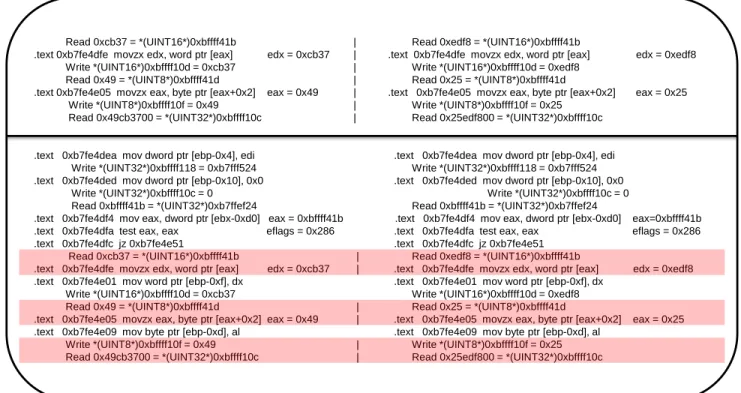
Figure 2-7 shows an excerpt from the union and delta files generated for the “Hello, world!” program. Given several traces, the delta and union files can be constructed from the two executions that are the most different or have the median difference.
Read 0xcb37 = *(UINT16*)0xbffff41b | Read 0xedf8 = *(UINT16*)0xbffff41b
.text 0xb7fe4dfe movzx edx, word ptr [eax] edx = 0xcb37 | .text 0xb7fe4dfe movzx edx, word ptr [eax] edx = 0xedf8 Write *(UINT16*)0xbffff10d = 0xcb37 | Write *(UINT16*)0xbffff10d = 0xedf8
Read 0x49 = *(UINT8*)0xbffff41d | Read 0x25 = *(UINT8*)0xbffff41d
.text 0xb7fe4e05 movzx eax, byte ptr [eax+0x2] eax = 0x49 | .text 0xb7fe4e05 movzx eax, byte ptr [eax+0x2] eax = 0x25 Write *(UINT8*)0xbffff10f = 0x49 | Write *(UINT8*)0xbffff10f = 0x25
Read 0x49cb3700 = *(UINT32*)0xbffff10c | Read 0x25edf800 = *(UINT32*)0xbffff10c .text 0xb7fe4dea mov dword ptr [ebp-0x4], edi .text 0xb7fe4dea mov dword ptr [ebp-0x4], edi Write *(UINT32*)0xbffff118 = 0xb7fff524 Write *(UINT32*)0xbffff118 = 0xb7fff524 .text 0xb7fe4ded mov dword ptr [ebp-0x10], 0x0 .text 0xb7fe4ded mov dword ptr [ebp-0x10], 0x0 Write *(UINT32*)0xbffff10c = 0 Write *(UINT32*)0xbffff10c = 0 Read 0xbffff41b = *(UINT32*)0xb7ffef24 Read 0xbffff41b = *(UINT32*)0xb7ffef24
.text 0xb7fe4df4 mov eax, dword ptr [ebx-0xd0] eax = 0xbffff41b .text 0xb7fe4df4 mov eax, dword ptr [ebx-0xd0] eax=0xbffff41b .text 0xb7fe4dfa test eax, eax eflags = 0x286 .text 0xb7fe4dfa test eax, eax eflags = 0x286 .text 0xb7fe4dfc jz 0xb7fe4e51 .text 0xb7fe4dfc jz 0xb7fe4e51
Read 0xcb37 = *(UINT16*)0xbffff41b | Read 0xedf8 = *(UINT16*)0xbffff41b
.text 0xb7fe4dfe movzx edx, word ptr [eax] edx = 0xcb37 | .text 0xb7fe4dfe movzx edx, word ptr [eax] edx = 0xedf8 .text 0xb7fe4e01 mov word ptr [ebp-0xf], dx .text 0xb7fe4e01 mov word ptr [ebp-0xf], dx
Write *(UINT16*)0xbffff10d = 0xcb37 Write *(UINT16*)0xbffff10d = 0xedf8 Read 0x49 = *(UINT8*)0xbffff41d | Read 0x25 = *(UINT8*)0xbffff41d
.text 0xb7fe4e05 movzx eax, byte ptr [eax+0x2] eax = 0x49 | .text 0xb7fe4e05 movzx eax, byte ptr [eax+0x2] eax = 0x25 .text 0xb7fe4e09 mov byte ptr [ebp-0xd], al .text 0xb7fe4e09 mov byte ptr [ebp-0xd], al
Write *(UINT8*)0xbffff10f = 0x49 | Write *(UINT8*)0xbffff10f = 0x25 Read 0x49cb3700 = *(UINT32*)0xbffff10c | Read 0x25edf800 = *(UINT32*)0xbffff10c
Figure 2-7: Excerpts from the diff files generated by the analysis script. The top half shows instructions from the delta file; these all have different side-effects in the two logs (as indicated by the |). The bottom half shows instructions from the union file. Conflicting instructions are highlighted; others are found in both logs.
The much smaller size of the delta file makes it suitable for diagnosing sources of nondeterminism in an application.
Visualization Script
The visualization script reads the union file to compute statistics on the extent of any differences in the original logs, and generates diagrams to capture the different execution traces of the program.
In particular, it derives three key metrics after processing the union file:
1. Length of Common Prefix (P): This is the number of instructions common to both logs starting from the beginning and up to the point of first divergence. 2. Longest Common Substring (LS): This is the longest sequence of consecutive
3. Longest Common Subsequence (LCS): Intuitively, this is the “overlap” in the logs; it is the length of the longest sequence of identical instructions in both logs. Instructions in the LCS must be in the same order in both logs, but they are not required to be adjacent.
For instance, if the first instance of a program executes the instruction sequence I1 = [A, B, C, D, E, F ], and the second instance of the same program executes the
instruction sequence I2 = [A, B, X, D, E, F, Y ], then: the common prefix is [A, B];
the longest common substring is [D, E, F ], and the longest common subsequence is [A, B, D, E, F ].
In general, the longest common subsequence (LCS) of two traces is arguably the best indicator of the extent of determinism in two executions of a program; we thus use LCS and “Determinism” interchangeably from now on. The other two metrics are important for evaluating the feasibility of silhouette execution a solution to the boot storm problem. In general, we want the common prefix (P) and the longest common substring (LS) of the two logs to be as large as possible to ensure that concurrently booting VMs do not need to branch execution or communicate with each other too quickly (see Chapter 4).
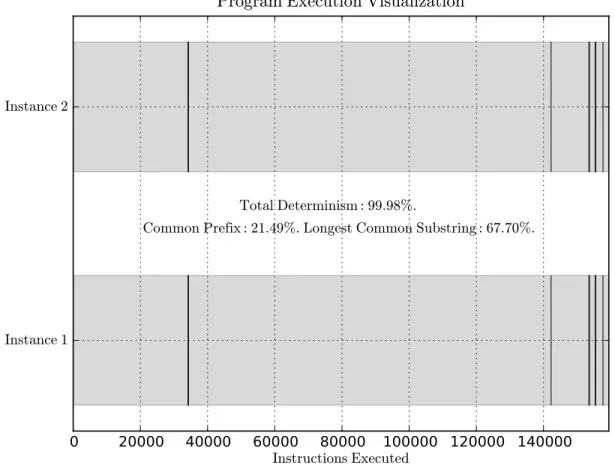
For the “Hello, world!” program, if ASLR is enabled, the two logs have very little overlap (< 1%), and the common prefix and longest common substring are on the order of 10 instructions. With ASLR disabled, one may expect the two traces to look identical (because of the simplicity of the program), but there is still some nondeterminism in the instruction sequences (see Table 2.1 and Figure 2-8).
Common Prefix 21.49 percent
Longest Common Substring 67.70 percent
Longest Common Subsequence 99.98 percent
Conflict Ratio (i.e. 1 − LCS) 0.02 percent
Conflicting Instructions 32
Figure 2-8 shows divergences in program execution over time. This representation allows us to visually inspect the union file and figure out the distribution and nature of conflicting instructions. For the “Hello, world!” program, we can see that while divergences were spread out near the beginning and end of the program, they were bursty and short-lived (as indicated by the thin black lines). This is a common trend, even for complex programs such as Linux services, as discussed in Section 2.3.
0
20000 40000 60000 80000 100000 120000 140000
Instructions Executed
Instance 1
Instance 2
Total Determinism : 99
.
98%
.
Common Prefix : 21
.
49%
.
Longest Common Substring : 67
.
70%
.
Program Execution Visualization
Figure 2-8: Visualization of “Hello, world!” program execution. The thin black lines represent conflicts between the two instances of the program.
2.2.2
Quantifying Nondeterminism
As mentioned in the previous section, we use the common prefix (P), the longest com-mon subsequence (LCS), the longest substring (LS) and the distribution of conflicting instructions in separate instruction streams to measure nondeterminism.
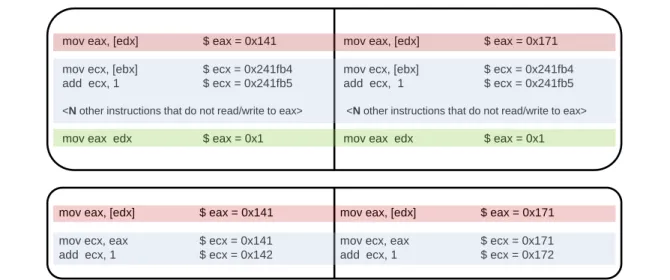
While the conflict ratio measured by our analysis script is usually quite small (e.g. 0.02% for “Hello, world!”), its importance and impact is disproportionately larger. As shown in Figure 2-9, the analysis script ignores the cascade effect and only considers instructions that originate or actively propagate nondeterminism in calculating the conflict ratio.
mov eax, [edx] $ eax = 0x141 mov eax, [edx] $ eax = 0x171 mov ecx, [ebx] $ ecx = 0x241fb4 mov ecx, [ebx] $ ecx = 0x241fb4 add ecx, 1 $ ecx = 0x241fb5 add ecx, 1 $ ecx = 0x241fb5
<N other instructions that do not read/write to eax> <N other instructions that do not read/write to eax>
mov eax edx $ eax = 0x1 mov eax edx $ eax = 0x1
mov eax, [edx] $ eax = 0x141 mov eax, [edx] $ eax = 0x171 mov ecx, eax $ ecx = 0x141 mov ecx, eax $ ecx = 0x171 add ecx, 1 $ ecx = 0x142 add ecx, 1 $ ecx = 0x172
Figure 2-9: The top image shows an example of the cascade effect: the red instruction represents a real conflict in eax. The light-blue instructions have the same side-effects across the two logs because they do not touch eax. Despite this, the value of eax is different in the blue instructions and converges only after it is written by the green instruction. The cascade effect refers to the nondeterministic register state that results in the light-blue instructions because of an earlier conflict, even though the instructions themselves are not reading or writing any nondeterministic values. If we included the cascade effect, the measured conflict ratio in this trace excerpt is (N + 3)/(N + 4) instead of the 1/(N + 4) we will report.
The bottom image shows an example of the propagation effect: the red instruction again represents a conflict in eax. The light-blue instructions do not generate any nondeterminism themselves, but they have conflicting side-effects because they read eax. In this case, we report a conflict ratio of 1.
Ignoring the cascade effect while including the propagation effect effectively simulates a form of taint analysis [10] on register and memory contents to measure the true impact of any nondeterminism in a program. Our approach automatically groups instructions that generate and propagate nondeterminism in the delta files, making
it easier for us to diagnose the sources of nondeterminism.
One element missing from our study of nondeterminism is that we do not account for timing-related nondeterminism directly. For instance, two programs that execute precisely the same set of instructions but take different amounts of time doing so (e.g. due to variable latency of blocking system calls) are fully deterministic according to our definition. We deliberately exclude timing considerations because it is acceptable for some VMs to lag behind others in the boot storm scenario, as long as the same instructions are executed. When timing-related nondeterminism affects program exe-cution e.g. through differences in signal delivery, I/O ordering or time-related system calls (see Chapter 3), it automatically gets factored in our analysis.
2.3
Results for Linux services
Table 2.2 shows the results from applying our data collection scheme on a set of Linux services and daemons that are typically launched at boot.
Application Prefix (P) Longest Substring (LS) Determinism (LCS)
acpid, 20 loop iterations 20.99% 66.84% 99.98%
anacron, 7 loop iterations 0.65% 87.27% 99.21%
cupsd, 10 loop iterations 0.44% 12.87% 85.08%
cron, 5 loop iterations 1.54% 57.11% 99.94%
ntpd, 30 loop iterations 2.46% 4.74% 81.66%
Weighted Average 0.84% 26.41% 87.89%
Table 2.2: Nondeterminism profile of Linux services and daemons (ASLR disabled). The average reported here is weighted-average computed based on the number of instructions executed by each program. The period over which the programs were profiled was selected to be representative of their execution typically till the login screen is shown. Typically, the programs ran for 3-5 true (i.e without instrumentation overhead) minutes.
We can immediately see that:
1. The common prefix (P) in our sample of Linux services is on average about 1%, which is quite small and indicates that nondeterminism typically surfaces relatively early in program execution.
2. The longest substring (LS), usually close to 26%, is substantially larger than the common prefix (P). This shows that execution typically does not permanently diverge after the initial differences.
3. The longest common subsequence (LCS) or general determinism is in general much higher – about 88% on average – which indicates that a large majority of instructions in the Linux services overlap across different executions.
Given the discussion in Section 2.2.2, a conflict ratio of about 12% on average hints that there is little but non-trivial nondeterminism in our sample programs, despite a very high average LCS.
The distribution of the 12% conflicting instructions is surprisingly similar across different programs. Figure 2-10, an execution profile of ntpd (for the first 14 out of 30 iterations) is representative of most execution traces. Generally, conflicting instruc-tions are spread throughout the traces but tend to occur more frequently towards the end. Nondeterminism does not seem to cause permanent execution divergences, even though there is significant control-flow divergence in some programs. In fact, execution seems to diverge and re-converge very frequently (i.e. nondeterminism is bursty). The execution profile of cron is somewhat unique because it has a higher LCS and LS than other traces. It is difficult to reconcile the low measured conflict ratio for cron (less than 2%), with the higher conflict ratio visually suggested by Fig-ure 2-11a. FigFig-ure 2-11b explains this discrepancy: it shows that while the absolute number of conflicting instructions is small, these conflicts occur in bursts and visually group together. While the bursty nature of nondeterminism is particularly prominent in Figure 2-11b, it is common to all the services we profiled. Table 2.3 shows that the longest control flow divergence or the longest string of consecutive conflicts is typically very small (i.e. << 1%) for most of our sample programs.
Figure 2-10: Visualization of ntpd program execution (14 iterations). The thin black lines represent conflicts between the two instances of the program, whereas the thin blue or red lines represent control flow divergences.
(a) The thin black lines represent conflicts between the two instances of the program.
24x Zoom
(b) Looking closely at the cron program execution reveals that conflicts occur in short bursts that visually group together.
Application Max. Consecutive Conflicts Max. Control Flow Divergence
acpid, 20 loop iterations 0.0000% 0.0019%
anacron, 7 loop iterations 0.0335% 0.0021%
cupsd, 10 loop iterations 0.0120% 1.8500%
cron, 5 loop iterations 0.0004% 0.0002%
ntpd, 30 loop iterations 0.0523% 0.3223%
Weighted Average 0.0185% 1.290%
Table 2.3: Measuring burstiness of nondeterminism in Linux services.
The table shows the maximum number of consecutive instructions that conflict in their side-effects or control-flow as a fraction of the total instructions of a program. These numbers are only a small fraction of the 12% conflicting instructions in a program (see Table 2.2), which establishes that execution differences are short-lived in our sample programs.
2.4
Summary
This chapter presented a brief overview of the Linux boot process, and demonstrated our methodology for both quantifying and measuring nondeterminism in programs using dynamic instrumentation. By analyzing user-mode instructions executed by Linux boot services and daemons, we offered evidence that Linux services execute highly overlapping instruction sequences across different runs. We also showed that any conflicts or nondeterminism in such services occurs in bursts; nondeterminism does not cause executions to permanently diverge; divergence and convergence occur very quickly and repeatedly in our traces.
Chapters 3 will offer insight into the sources of nondeterminism behind these statistics. Chapter 4 will look at the implications of our results for the feasibility of silhouette solution as a solution to the boot storm problem.
Chapter 3
Sources of Nondeterminism in
Linux services
In this chapter, we describe the sources of nondeterminism discovered using the data collection scheme described in Chapter 2. This study of nondeterminism reveals subtle interactions between user-mode applications, commonly used system libraries (e.g. the libc library), the Linux operating system and the external world. While our results are derived from analyzing a small set of complex programs, they include all sources of application-level nondeterminism that have been described in literature. Unlike existing work, however, we cover the various interfaces between user-mode programs and the Linux kernel in considerably more detail.
3.1
Linux Security Features
Address Space Layout Randomization (ASLR)
Address Space Layout Randomization (ASLR) involves random arrangement of key memory segments of an executing program. When ASLR is enabled, virtual addresses for the base executable, shared libraries, the heap, and the stack are different across multiple executions. ASLR hinders several kinds of security attacks in which attackers have to predict program addresses in order to redirect execution (e.g. return-to-libc attacks).
As mentioned earlier, two execution traces of even a simple program in C are almost entirely different when ASLR is enabled because of different instruction and memory addresses.
Canary Values and Stack Protection
Copying a canary – a dynamically chosen global value – onto the stack before each function call can help detect buffer overflow attacks, because an attack that overwrites the return address will also overwrite a copy of the canary. Before a ret, a simple comparison of the global (and unchanged) canary value with the (possibly changed) stack copy can prevent a buffer overflow attack.
In 32-bit Linux distributions, the C runtime library, libc, provides a canary value in gs:0x14. If Stack Smashing Protection (SSP) is enabled on compilation, gcc gen-erates instructions that use the canary value in gs:0x14 to detect buffer overflow attacks. Because Pin gets control of the application before libc initializes gs:0x14, multiple execution traces of a program will diverge when gs:0x14 is initialized and subsequently read. The manner in which the canary value in gs:0x14 is initialized depends on the libc version. If randomization is disabled, libc will store a fixed ter-minator canary value in gs:0x14; this does not lead to any nondeterminism. When randomization is enabled, however, some versions of libc store an unpredictable value in gs:0x14 by reading from /dev/urandom or by using the AT RANDOM bytes provided by the kernel (see Section 3.2).
Pointer Encryption
Many stateless APIs return data pointers to clients that the clients are supposed to supply as arguments to subsequent function calls. For instance, the setjmp and longjmp functions can be used to implement a try-catch block in C: setjmp uses a caller-provided, platform-specific jmp buf structure to store important register state that longjmp later reads to simulate a return from setjmp. Since the jmp buf instance is accessible to clients of setjmp and longjmp, it is possible that the clients may advertently or inadvertently overwrite the return address stored in it and simulate a
buffer-overflow attack when longjmp is called.
Simple encryption schemes can detect mangled data structures. For instance, in 32-bit Linux, libc provides a pointer guard in gs:0x18. The idea behind the pointer guard is the following: to encrypt a sensitive address p, a program can compute s = p ⊕ gs:0x18, optionally add some bit rotations, and store it in a structure that gets passed around. Decryption can simply invert any bit rotations, and then compute p = s ⊕ gs:0x18 back. Any blunt writes to the structure from clients will be detected because decryption will likely not produce a valid pointer. Pointer encryption is a useful security feature for some APIs and is used by some versions of libc to protect addresses stored in jmp buf structures.
The libc pointer guard has different values across multiple runs of a program, just like the canary value. Initialization of the libc pointer guard can therefore be a source of nondeterminism in program execution. In some versions of libc, the value of gs:0x18 is the same as the value of gs:0x14 (the canary). In others, the value of gs:0x18 is computed by XORing gs:0x14 with a random word (e.g. the return value of the rdtsc x86 instruction), or reading other AT RANDOM bytes provided by the kernel (Section 3.2).
3.2
Randomization Schemes
As already clear from Section 3.1, randomization schemes can lead to significant nondeterminism in programs. Applications generally employ pseudo-random number generators (PRNGs), so they need only a few random bytes to seed PRNGs. These few random bytes are usually read from one of few popular sources:
• The /dev/urandom special file. Linux allows running processes to access a random number generator through this special file. The entropy generated from environmental noise (including device drivers) is used in some implementations of the kernel random number generator.
• AT RANDOM bytes. Using open, read and close system-calls to read only a few random bytes from /dev/urandom can be computationally expensive. To remedy this, some recent versions of the Linux kernel supply a few random bytes to all executing programs through the AT RANDOM auxiliary vector. ELF auxiliary vectors are pushed on the program stack before a program starts executing below command-line arguments and environmental variables.
• The rdtsc instruction. The rdtsc instruction provides an approximate number of ticks since the computer was last reset, which is stored in a 64-bit register present on x86 processors. Computing the difference between two successive calls to rdtsc can be used for timing whereas a single value returned from rdtsc lacks any useful context. The instruction has low-overhead, which makes it suitable for generating a random value instead of reading from /dev/urandom. • The current time or process ID. System calls that return the current process ID (Section 3.3) or time (Section 3.4) generate unpredictable values across execu-tions, and are commonly used to seed PRNGs.
• Miscellaneous: There are several creative ways to seed PRNGs, including using www.random.org or system-wide performance statistics. Thankfully, we have not observed them in our analysis of Linux services.
Randomization-related nondeterminism thus usually originates from any external sources used to seed PRNGs; if the seeds are different across multiple executions, PRNGs further propagate this nondeterminism.
3.3
Process Identification Layer
In the absence of a deterministic operating system layer, process IDs for programs are generally not predictable. For instance, a nondeterministic scheduler (Section 3.9) could lead to several possible process creation sequences and process ID assignments when a VM boots up.
Given the unpredictability of process IDs, system calls that directly or indirectly interact with the process identification layer can cause divergences across distinct executions of the same program. For instance, system calls that return a process ID e.g. getpid (get process ID), getppid (get parent process ID), fork/clone (create a child process), wait (wait for a child process to terminate) return conflicting values across distinct executions. System calls that take process IDs directly as arguments such as kill (send a signal to a specific process), waitpid (wait for a specific child process to terminate) can similarly propagate any nondeterminism. In fact, libc stores a copy of the current process ID in gs:0x48, so reads from this address also propagate execution differences.
Apart from system calls, there are other interfaces between the Linux kernel and executing user-mode programs where process IDs also show up:
• Signals: If a process registers a signal handler with the SA SIGINFO bit set, then the second argument passed to the signal handler when a signal occurs is of type siginfo t*. The member siginfo t.si pid will be set if another process sent the signal to the original process (Section 3.8).
• Kernel messages: The Linux kernel will sometimes use process IDs to indicate the intended recipients of its messages. For instance, Netlink is a socket-like mechanism for inter process communications (IPC) between the kernel and
user-space processes. Netlink can be used to pass networking information
between kernel and user-space, and some of its APIs use process IDs to identify communication end-points (Section 3.6).
Nondeterminism arising from the unpredictability of process IDs can be further propagated when an application uses process IDs to seed PRNGs (Section 3.2), ac-cess the /proc/[PID] directory (Section 3.11), name application-specific files (e.g. myapp-[pid].log) or log some information to files (e.g. process [pid] started at [04:23] ) (Section 3.5).
3.4
Time
Concurrent runs of the same program will typically execute instructions at (slightly) different times. Clearly, any interactions of a program with timestamps can cause nondeterminism. For instance:
• The time, gettimeofday and clock gettime system calls return the current time.
• The times or getrusage system calls return process and CPU time statistics respectively.
• The adjtimex system call is used by clock synchronization programs (e.g. ntpd) and returns a kernel timestamp indirectly via a timex structure.
• Programs can access the hardware clock through /dev/rtc and read the current time through the RTC RD TIME ioctl operation.
• Many system calls that specify a timeout for some action (e.g. select, sleep or alarm) inform the caller of any unused time from the timeout interval if they return prematurely.
• The stat family of system calls returns file modification timestamps; also, many application files typically contain timestamps; network protocols use headers with timestamps as well (Sections 3.5 and 3.6).
Apart from nondeterminism arising from timestamps, timing differences can arise between distinct executions because of variable system-call latencies or unpredictable timing of external events relative to program execution (Sections 3.8 and 3.7).
3.5
File I/O
File contents
If two executions of the same program read different file contents (e.g. cache files), then there will naturally be execution divergence. For concurrently executing Linux services, differences in file contents typically arise from process IDs (Section 3.3) or timestamps (Section 3.4) rather than semantic differences. Once those factors are controlled, file contents rarely differ for identical VMs. Of course, there would be significant nondeterminism in programs whenever file content for input or configu-ration files is semantically different. In our experiments, however, we used identical configuration files; file contents only differed because of external sources.
File Modification Times
Apart from minor differences in file contents, nondeterminism can arise from distinct file modification (mtime), access (atime) or status-change (ctime) timestamps. The stat system call is usually made for almost every file opened by a program; the time values written by the system call invariably conflict between any two executions. Most of the time, these timestamps are not read by programs, so there is little propagation. On occasion, however, a program will use these timestamps to determine whether a file is more recent than another, or whether a file has changed since it was last read.
File Size
When a program wishes to open a file in append-mode, it uses lseek with SEEK END to move the file cursor to the end, before any writes take place. The return value of lseek is the updated cursor byte-offset into the file. Clearly, if the length of a file is different across multiple executions of a program, then lseek will return conflicting values. Many Linux services maintain log files which can have different lengths due to conflicts in an earlier execution; lseek further propagates them. To overcome such nondeterminism, older log files must be identical at the beginning of program execution and other factors that cause nondeterminism must be controlled.
3.6
Network I/O
Network Configuration Files
The libc network initialization code loads several configuration files into memory (e.g. /etc/resolv.conf). Differences in the content, timestamps or lengths of such config-uration files can clearly cause nondeterminism. Background daemons (e.g. dhclient for /etc/resolv.conf) usually update these files periodically in the background. Calls to libc functions such as getaddrinfo use stat to determine if relevant con-figuration files (e.g. /etc/gai.conf) have been modified since they were last read. In our experiments, typically the file modification timestamps – and not the actual contents – of these configuration files vary between different executions.
DNS Resolution
In our experiments, IP addresses are resolved identically by concurrently executing services. However, if DNS-based load-balancing schemes are used, the same server can appear to have different IP addresses.
Socket reads
Bytes read from sockets can differ between executions for a variety of reasons. For instance, different timestamps in protocol headers, or different requests/responses from the external world would be reflected in conflicting socket reads. By studying application behavior, it is possible to distinguish between these different scenarios and identify the seriousness of any differences in the bytes read.
In our experiments, we observed nondeterminism in reads from Netlink sockets. As mentioned in Section 3.3, Netlink sockets provide a mechanism for inter-process communications (IPC) between the kernel and user-space processes. This mechanism can be used to pass networking information between kernel and user space. Netlink sockets use process IDs to identify communication endpoints, which can differ between executions (Section 3.3). Similarly, some implementations of libc use timestamps to assign monotonically increasing sequence numbers to Netlink packets (Section 3.4).
Nondeterminism can also arise from sockets of the NETLINK ROUTE family, which re-ceive routing and link updates from the kernel; libc rere-ceives RTM NEWLINK messages when new link interfaces in the computer are detected. When an interface gets dis-covered or reported, the kernel supplies interface statistics to libc such as packets sent, dropped or received. These statistics will obviously vary across different pro-gram instances.
Ephemeral Ports
A TCP/IPv4 connection consists of two end-points; each end-point consists of an IP address and a port number. An established client-server connection can be thought of as the 4-tuple (server IP, server port, client IP, client port). Usually three of these four are readily known: a client must use its own IP, and the pair (server IP, server port) is fixed. What is not immediately evident is that the client-side of the connection uses a port number. Unless a client program explicitly requests a specific port number, an ephemeral port is used. Ephemeral ports are temporary ports that are assigned from a dedicated range by the machine IP stack. An ephemeral port can be recycled when a connection is terminated. Since the underlying operating system is not deterministic, ephemeral port numbers used by Linux services tend to be different across multiple runs.
3.7
Scalable I/O Schemes
Polling Engines
Complex programs like Linux services have many file descriptors open at a given time. Apart from regular files, these special file descriptors could correspond to:
• Pipes: Pipes are used for one-way interprocess communication (IPC). Many Linux services spawn child processes; these child processes communicate with the main process (e.g. for status updates) through pipes.