Publisher’s version / Version de l'éditeur:
Vous avez des questions? Nous pouvons vous aider. Pour communiquer directement avec un auteur, consultez la
première page de la revue dans laquelle son article a été publié afin de trouver ses coordonnées. Si vous n’arrivez pas à les repérer, communiquez avec nous à PublicationsArchive-ArchivesPublications@nrc-cnrc.gc.ca.
Questions? Contact the NRC Publications Archive team at
PublicationsArchive-ArchivesPublications@nrc-cnrc.gc.ca. If you wish to email the authors directly, please see the first page of the publication for their contact information.
https://publications-cnrc.canada.ca/fra/droits
L’accès à ce site Web et l’utilisation de son contenu sont assujettis aux conditions présentées dans le site
LISEZ CES CONDITIONS ATTENTIVEMENT AVANT D’UTILISER CE SITE WEB.
Proceedings of the International Conference on Port and Ocean Engineering under Arctic Conditions, POAC 2005, 1, pp. 249-259, 2005
READ THESE TERMS AND CONDITIONS CAREFULLY BEFORE USING THIS WEBSITE. https://nrc-publications.canada.ca/eng/copyright
NRC Publications Archive Record / Notice des Archives des publications du CNRC :
https://nrc-publications.canada.ca/eng/view/object/?id=e5531835-24b5-4198-ae45-b7cf69d76019 https://publications-cnrc.canada.ca/fra/voir/objet/?id=e5531835-24b5-4198-ae45-b7cf69d76019
NRC Publications Archive
Archives des publications du CNRC
This publication could be one of several versions: author’s original, accepted manuscript or the publisher’s version. / La version de cette publication peut être l’une des suivantes : la version prépublication de l’auteur, la version acceptée du manuscrit ou la version de l’éditeur.
Access and use of this website and the material on it are subject to the Terms and Conditions set forth at Mechanisms of ice softening under high pressure and shear
Jordaan, Ian; Li, Chuanke; Barrette, Paul; Duval, Paul; Meyssonnier, Jacques
Jordaan, I, Li, C, Barrette, P., Duval, P. and
Meyssonnier, J.
Mechanisms of ice softening under high pressure and
shear.
POAC 2005, Potsdam, N.Y. Proceedings, Vol 1, pp
249-259.
MECHANISMS OF ICE SOFTENING UNDER HIGH PRESSURE AND SHEAR
Ian Jordaan1, Chuanke Li1, Paul Barrette1, Paul Duval2 and Jacques Meyssonnier2
1
Faculty of Engineering and Applied Science, Memorial University of Newfoundland St. John’s, Newfoundland
2
Laboratoire de Glaciologie et Géophysique de l’Environnement, St Martin d’Hères, France
ABSTRACT
Under high hydrostatic pressure combined with shear, the structure of polycrystalline ice breaks down into fine-grained material by a process of recrystallization.
Accompanying this process is a substantial softening of the material. Measurements of activation energy at low strains prior to the breakdown of structure, at temperatures of –10 °C, show an increase of activation energy from about 80 kJ mol−1 to about 120
kJ mol−1 as the pressure increases, with values at about 70 MPa similar to those found by other researchers for temperatures between –10 and 0 °C. These results suggest that grain boundary melting occurs, resulting in increased strain rates. The various energies that might drive the subsequent recrystallization process have been
investigated. The results suggest strongly that elastic strain energy is the driving force in the process.
INTRODUCTION
In compressive loading of an ice mass with an indenter or structure, at low rates the ice will respond with an elastic-creeping zone of stress, the size of which will be of the order of magnitude of the indenter. Grain growth has been observed in the slow deformation of polar ice sheets (Duval and Castelnau, 1995), while reduction in grain size was observed in regions of high shear during laboratory experiments on
indentation of ice plates within the range of ductile behaviour by Frederking and Gold (1975). At faster rates, damage and microstructurally modified ice appear near the indenter, which at yet higher rates localizes into distinct zones characterized by a narrow layer of microstructurally modified material consisting of microcracked and
recrystallized ice. The failure of this layer is associated with high pressures and dynamic activity with regular oscillations in load at certain rates. For wide structures there may be several of these high-pressure zones, isolated by fractures between the zones. These mechanisms are discussed in Jordaan (2001).
The existence of a layer of recrystallized ice was observed in sliding friction tests of monocrystals by Barnes, Tabor and Walker (1971), and by Kheisin and Cherepanov (1973) in field tests of dropped balls, and in many other tests including medium scale tests of iceberg and multiyear ice (summarized in Jordaan, 2001). In the rapid loading of a structure, the load is transferred for the most part through high-pressure zones (hpz’s) associated with the layer formation. The layers also appear in small scale indentation tests of the order of centimetres (Barrette et al., 2002). Figure 1 shows two sections taken through hpz’s at different scales. The remarkable similarity of the
hpz’s at the two scales is evident.
Figure 1 Two sections taken through hpz’s at different scales. (a) Hobson’s Choice experiment (see Jordaan, 2001); (b) Laboratory experiment (Barrette, Pond and Jordaan, 2002).
The properties of the layer formed in the ice adjacent to the structure vary with distance from the edge of the hpz to the centre. The state of stress varies with this distance, and high degrees of triaxial confinement have been observed near the centre, with contact pressures on sensors 13 mm in diameter of the order of 70 MPa in
medium scale tests. Figure 2 shows a schematic illustration of the structure of a hpz. The high hydrostatic pressures that result have a strong influence on the material response, which can be analyzed in terms of stress history. The microstructural
changes involve microfracturing at lower pressures, with extensive recrystallization as the pressure increases. These microstructural changes have also been reproduced in triaxial tests (Meglis et al., 1999; Barrette and Jordaan, 2003).
Speed V
Pressure distribution
Microfracturing and softening at low pressures
Recrystallization and softening at high pressures
St
ru
c
tu
re
Ic e Mass
SpallsFigure 2 Schematic of the structure of a hpz in ice-structure interaction
Figure 3 shows two sets of thin sections from these laboratory tests. At low confining pressures (Pc), the creep in basal planes is augmented by grain boundary sliding at
temperatures approaching 0 °C, and by cracking and recrystallization at higher strain rates. The focus of the present paper is the behaviour of polycrystalline ice under high rates, in particular that ice under high confinement near the centre of a high-pressure zone. This ice becomes extensively recrystallized with little evidence of
microfracturing. Following an analysis of the formation of a hpz, two aspects will be treated: first, grain boundary sliding under pressure, and then the mechanism of dynamic recrystallization.
DAMAGE AND BEHAVIOUR OF ICE IN THE CENTRAL PART OF A HPZ
The microstructural changes that take place in the ice include microfracturing, dynamic recrystallization and localized pressure melting. The microfracturing occurs near the edge (low-pressure) part of the hpz. The area of mechanics in which such events—leading to softening of the material—have been analyzed is termed “damage mechanics”, because they occur as damaging events during the life of engineered objects. We shall retain the term “damage” as it is commonly used although not entirely appropriate in the present instance.
As noted above, the ice within a hpz will be subjected to a varying hydrostatic pressure in addition to shear. The damage function and ice response, in terms of the
creep compliance, are also a function of confining pressure. At lower pressures, microfracturing and recrystallization dominate the behaviour (possible pressure melting on asperities in cracks). As the pressure increases, the microcracking is reduced and to some extent suppressed, and the creep compliance is correspondingly reduced. As the pressure is increased further, the compliance increases again as a result of dynamic recrystallization, pressure melting in grain boundaries, and easy basal slip which could be accommodated in the grain boundaries. Frictional heating will also raise the temperature and assist in the melting process. Figure 4 shows that the compliance increases more rapidly as the shear or deviatoric stress increases. The main feature of the layer with regard to mechanical properties is the considerable softening which takes place as a result of the stress history and damage. Figure 5 illustrates this behaviour.
Figure 3 Horizontal thin sections from samples deformed to strain of 44% with deviatoric stress of 15 MPa. Samples deformed at Pc = 5 MPa (above),
and at Pc = 50 MPa (below). Viewed between crossed polarizing filters
alone, and between crossed polarizing filters (left) with additional side lighting (right). Scale is in mm. (Meglis et al., 1999)
Figure 4 Axial true strain as a function of time, with a confinement Pc ranging from
49 MPa to 53 MPa, and deviatoric stress s ranging from 6 MPa to 18 MPa (after Meglis et. al, 1999)
The damage is a function of stress history and an internal state variable can be used to represent the current state of damage, and hence also the creep compliance. This has been implemented into the ABAQUS finite element code. The development of the layer is assisted considerably by the energy flux into the hpz’s as a result of the softening. See also “Discussion” below. Figure 6 shows the dramatic effect on the behaviour of ice pressure softening at the centre of the hpz, and this is the key to the rapid decline in load.
STRAIN RATE, ACTIVATION ENERGY, GRAIN BOUNDARIES, TEMPERATURE AND PRESSURE
We consider in this section the secondary creep rate in ice, also referred to as the minimum creep rate. This is consistent with the analysis by Barnes, Tabor and Walker (1971) as well as the recent tests of Barrette (reported in Barrette and Jordaan, 2003). The strain under these conditions is relatively small, of the order of 1% or less and the ice would not have suffered extensive microcracking or recrystallization. The
following expression relating minimum strain rate ε&min and activation energy is used. ) exp( min RT Q A n − = σ ε&
where σ is the axial stress, Q is the activation energy, R is the universal constant, T is the absolute temperature, and A, n are constants. The expression is consistent with Barnes et al. except that they used a “sinh” function of stress in some of their analyses. This difference will not affect the present analysis.
Figure 5 Schematic illustration of the relationship between pressure and creep compliance
Figure 6 Effect of hpz softening on interaction load
The value of activation Q can be determined from a plot relating the logarithm of strain rate and 1/T. For creep tests, the minimum strain rate is considered for this exercise: RT Q A nln(σ)=lnε&−ln + (2)
A number of authors have reported an increase in activation energy towards the melting point of ice. This change in activation energy near melting point has been observed only in polycrystalline ice, not single crystals, pointing to the role of grain boundaries (see Mellor and Testa 1969). Barnes et al. (1971) reported that the creep rate increases as the temperature approaches melting, with a concurrent increase in activation energy from 78 kJmol-1 for temperatures less than –8 ºC to 120 kJmol-1 for greater temperatures.
A strikingly similar behaviour was found by Barrette and Jordaan (2003) for ice subjected to confining pressure. Tests were conducted on polycrystalline and iceberg ice at temperatures ranging from −5 to −26 ºC, and at hydrostatic pressures ranging from 15 to 70 MPa. Figure 7 shows the result. Other results show an increased strain rate with pressure. Both of these results are similar to those found by Barnes et al. quoted in the preceding paragraph, and the agreement in activation energy values is emphasized. Since the ice is not recrystallized at the strains considered, this suggests that the increased strain rate is associated with grain boundary effects, such as increased intracrystalline slip and sliding.
Figure 7 Activation energy for increasing hydrostatic pressure (Barrette and Jordaan, 2003)
RECRYSTALLIZATION, ACTIVATION ENERGY AND DRIVING FORCE
For greater strains, as is common in ice-structure interaction, widespread
recrystallization occurs, and reconsideration of the fundamental relationship of the strain rate, Equation (1) above, is necessary. The final grain size has been observed in triaxial tests to be smaller than 1 mm. The rate of recrystallization events ϕ& can be written as
⎥⎦ ⎤ ⎢⎣ ⎡ Δ − − = exp( ) exp( ) 1 RT G RT G ω ϕ&
where G is the equilibrium activation energy, and ΔG the activation free energy associated with the application of stress. (See also Schapery, 1997 and Jordaan et al., 1999.) For small ΔG/RT , the term in square brackets can be approximated at given temperature by ΔG∝ s, the shear stress; combined with the dislocation density being proportional to s2, the familiar third-power dependence of creep rate on stress is recaptured with n = 3 in Equation (1) above.
We have considered the following energies to obtain an appreciation of those likely to be associated with the recrystallization process (Urai, 1986).
1) Lattice defect energy 2) Grain boundary energy
3) External load-supporting elastic strain energy
The first is the dislocation energy, that is, the elastic energy stored in the lattice that is distorted from its equilibrium configuration by dislocations. For a screw dislocation the energy per unit length of the dislocation line is calculated as follows (Humphreys and Hatherley, 1996), neglecting the energy in the dislocation core.
, ln 4 0 1 2 ⎟⎟ ⎠ ⎞ ⎜⎜ ⎝ ⎛ = r r b Ed π μ
where μ is the shear modulus, b the Burgers vector, r0 the radius of the dislocation
core and r1 the distance from the core at which the dislocation strain field vanishes. A
reasonable estimate for r0 is the length of the Burgers vector b, and for r1 the grain
size. Varying r1 from 0.1 mm to 10 mm, with b ≈ 5 10-10 m leads to values of ln(r1/ r0)
between 5 and 10, so that an approximate form is .
2 b Ed ≈αμ
with 0.4 < α < 1.2.Denoting by ρ the dislocation density, the associated energy
isE b2.
L ≈αρμ If μ is taken as 4 GPa, and α as 1.0, 10 .
9ρ
−
≈
L
E
Then EL is about 100 Jm-3 for ρ = 10 11 m-2, but this could rise to 10, 000 Jm-3 for ρ =
10 13 m-2. The density is likely to be on the higher end of this range locally, e.g. near a grain boundary.
With regard to the grain boundaries, consider a grain size of 1 mm. Then a cube with sides 1 m in length can be considered to include 1000 "slices" 1 mm apart in each direction, giving 3000 m² of surface area. If the energy per unit area of a grain boundary is about one third of the surface energy, we have
(3)
(4)
(
-2) (
2 3)
-3 Jm 70 m / m 3000 Jm 07 . 0 3 1 = • ≈ gb E .This energy is relatively small, and it is added for comparison. Recrystallization in the
hpz involves mainly reduction of grain size and not grain boundary migration, so that
the energy would not be available for the process.
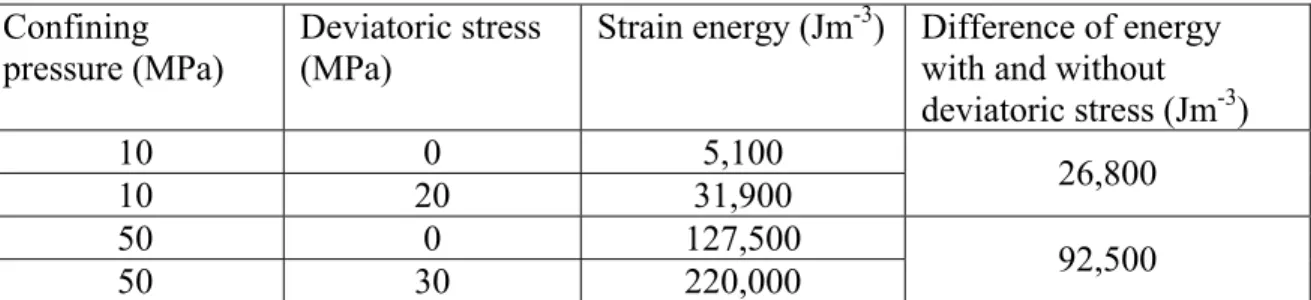
The elastic strain energy is much higher than these values in our case. The strain energy w is given by
[ ] [ ] [ ]
σ T 1σ 2 1 − = E w ,where
[ ]
σ is the stress tensor and[ ]
E the modulus matrix. Adopting the value of 10 GPa for the Young’s modulus, the strain energy due to a uniaxial stress of 10 MPa yields an energy of 5,000 Jm-3. Results of several cases typical of structural loading situations are listed in the Table 1.Table 1
Confining pressure (MPa)
Deviatoric stress (MPa)
Strain energy (Jm-3) Difference of energy with and without deviatoric stress (Jm-3) 10 0 5,100
10 20 31,900 26,800
50 0 127,500
50 30 220,000 92,500
Under the states of stress achieved within the high pressure zones, the elastic strain energy is dominant, followed by the dislocation energy, whereas the grain boundary energy is negligible, and greater by at least one order of magnitude than the other energies.
DISCUSSION
For ice at −10○C, the pressure required to cause melting of the ice is of the order of 140 MPa for pure water; Lliboutry (1987) notes that the value might be 100 MPa for air saturated water. Yet there is evidence of grain boundary melting at pressures of 70 MPa, as has been measured in the experiments by Barrette as described above, using deaerated water. (Here we have not accounted for the fact that the correct
thermodynamic interpretation of pressure should be hydrostatic pressure, which may be less than the contact pressure of 70 MPa.) This leads to the conclusion that stress concentrations associated with local irregular grain shapes, triple points and creep (Meyssonnier and Plé, 1999) are likely to be the cause of melting between grains. A further factor is the heat generated during the deformation, involving mainly
irreversible processes. Assume that the hydrostatic pressure does not do any work. If
(6)
the shear stress is 20 MPa (and it could be higher), then one arrives at the values given in Table 2.
Table 2
Strain rate (s-1) Work entering material (J s-1cm-3)
10-2 0.2
10-1 2
100 20
We have observed strain rates in laboratory tests approaching 100 s-1. The work is consumed in raising temperature and in melting of ice (one can assume that
recrystallization is a dissipative process, also producing heat). The specific heat of ice is about 2 J g-1 °C-1; the latent heat of freezing 334 J g-1. There is ample energy
available for raising the temperature and for melting at the higher strain rates. Melting may also result in local lowering of the temperature. The picture emerges of ice softening under stress, aided strongly by recrystallization (Figure 4); the softer the ice, the more energy it absorbs and the more is available for heating and softening—a runaway process as observed.
After the initial effect of pressure, recrystallization results in an increase in grain boundary surface with significantly increased strain rates. The softening appears to continue with increased hydrostatic pressure and shear, to the point where the
situation might be considered as particles “lubricated” by the liquid matrix. To model the increased strain rate, there is a need to consider the changing microstructure in more detail, and to include the effect of temperature. We have had successful results in the case of ice-structure interaction using empirical calibration of experimental results, as in Figure 6. This does capture effects such as energy flux into recrystallized zones. At the same time, more fundamental modeling is needed. The paper is intended as a first step in this direction.
REFERENCES
Barnes, P., Tabor, D. and Walker, J.C.F. 1971. The friction and creep of
polycrystalline of ice. Proceedings of the Royal Society of London A324, 127-155. Barrette, P.D. 2001. Triaxial testing of ice: A survey of previous investigations. Proc. 16th Conference on Port and Ocean Engineering under Arctic Conditions (POAC), Ottawa, vol. 3, 1375-1384.
Barrette, P.D. and Jordaan, I.J. 2001. Creep of ice and microstructural changes under confining pressure. In: S. Murakami and N. Ohno (eds.). IUTAM Symposium on Creep in Structures. Kluwer Academic Publ., Boston, 479-488.
Barrette, P.D. and Jordaan, I.J. 2003. Pressure-temperature effects on the compressive behavior of laboratory-grown and iceberg ice. Cold Regions Science and Technology, March 2003, 36(1-3):25-36.
Barrette, P., Pond, J. and Jordaan, I. 2002. Ice damage and layer formation: in small scale indentation experiments. Ice in the Environment, Proceedings of the 16th international Symposium on Ice, IAHR, Dunedin, New Zealand, 2002, vol. 3:246-253. Duval, P. and Castelnau, O. 1995. Dynamic recrystallization of ice in polar ice sheets. J. de Physique III, Colloque C3, Vol. 5, pp C3-197-C3-205.
Frederking, R. and Gold, L.W. 1975. Experimental study of edge loading of ice plates. Canadian Geotechnical Journal, vol 12(4), pp 456-463.
Humphreys, F.J. and Hatherly, M. 1996. Recrystallization and Related Annealing Phenomena. Pergamon.
Jordaan, I.J. Mechanics of ice-structure interaction. Engineering Fracture Mechanics, 2001; 68:1923-1960.
Jordaan, I.J., Matskevitch, D.M. and Meglis, I. 1999. Disintegration of ice under fast compressive loading. International Journal of Fracture 97(1-4):279-300.
Lliboutry, L.A. 1987. Very slow flow of solids, basics of modelling in geodynamics and glaciology, Martinus NijHoff Publishers, Dordrecht/Boston/Lancaster
Meglis I.L., Melanson, P.M. and Jordaan, I.J. 1999. Microstructural change in ice: II. Creep behavior under triaxial stress conditions. J. Glac. 45, 438-448.
Mellor M. and Testa R. 1969. Effect of temperature on the creep of ice. Journal of Glaciology 8, 131-145.
Meyssonnier, J. and Plé, O.1999. An analysis of crack nucleation during creep of S2 columnar ice under uniaxial compression. Procs. 15th POAC, Finland, vol.2, pp 470-479. Schapery, R.A. 1997. Nonlinear viscoealstic and viscoplastic constitutive equations based on thermodynamics. Mechanics of Time-dependent Materials. 1:209-240
Urai, J.L., Means, W.D. and Lister, G.S. 1986. Dynamic recrystallization of minerals. Geophysical Monograph, vol. 36: 161-199.