Publisher’s version / Version de l'éditeur:
Vous avez des questions? Nous pouvons vous aider. Pour communiquer directement avec un auteur, consultez la première page de la revue dans laquelle son article a été publié afin de trouver ses coordonnées. Si vous n’arrivez pas à les repérer, communiquez avec nous à [email protected].
Questions? Contact the NRC Publications Archive team at
[email protected]. If you wish to email the authors directly, please see the first page of the publication for their contact information.
https://publications-cnrc.canada.ca/fra/droits
L’accès à ce site Web et l’utilisation de son contenu sont assujettis aux conditions présentées dans le site LISEZ CES CONDITIONS ATTENTIVEMENT AVANT D’UTILISER CE SITE WEB.
KDD-2005: Proceedings of the Eleventh ACM SIGKDD International Conference
on Knowledge Discovery and Data Mining, August 21-24, 2005, Chicago, Illinois,
USA, pp. 21-24, 2005
READ THESE TERMS AND CONDITIONS CAREFULLY BEFORE USING THIS WEBSITE.
https://nrc-publications.canada.ca/eng/copyright
NRC Publications Archive Record / Notice des Archives des publications du CNRC :
https://nrc-publications.canada.ca/eng/view/object/?id=82fb56a0-7f3d-4b55-92d4-128f375aecb0
https://publications-cnrc.canada.ca/fra/voir/objet/?id=82fb56a0-7f3d-4b55-92d4-128f375aecb0
NRC Publications Archive
Archives des publications du CNRC
This publication could be one of several versions: author’s original, accepted manuscript or the publisher’s version. / La version de cette publication peut être l’une des suivantes : la version prépublication de l’auteur, la version acceptée du manuscrit ou la version de l’éditeur.
Access and use of this website and the material on it are subject to the Terms and Conditions set forth at
Learning to live with false alarms
Learning to Live with False Alarms
Chris Drummond
Institute for Information Technology National Research Council Canada
Ottawa, Ontario Canada, K1A 0R6
[email protected]
Rob Holte
Department of Computing Science University of Alberta
Edmonton, Alberta Canada, T6G 2E8
[email protected]
ABSTRACT
Anomalies are rare events. For anomaly detection, severe class imbalance is the norm. Although there has been much research into imbalanced classes, there are surprisingly few examples of dealing with severe imbalance. Alternative per-formance measures have superseded error rate, or accuracy, for algorithm comparison. But whatever their other mer-its, they tend to obscure the severe imbalance problem. We use the relative cost reduction of a classifier over a trivial classifier that chooses the less costly class. We show that for applications that are inherently noisy there is a limit to the cost reduction achievable. Even a Bayes optimal classi-fier has a vanishingly small reduction in costs as imbalance increases. If events are rare and not too costly, the unpalat-able conclusion is that our learning algorithms can do little. If the events have a higher cost then a large number of false alarms must be tolerated, even if the end user finds that undesirable.
1.
INTRODUCTION
An anomalous event is, by definition, unusual, but how unusual is an important question. At last year’s workshop, Bay [2] equated anomalous to “extremely rare and unusual”, Fawcett [7] stated that “positive activity is inherently rare”. This is certainly true of one of the authors’s experience ap-plying data mining algorithms to the maintenance of plex equipment. With aircraft engines, for instance, com-ponent failure is fortunately far from common. In anomaly detection, we should expect an imbalance in excess of 10:1 and often 100:1 or 1000:1 or even larger.
One obvious source of ideas to help with anomaly detec-tion is the community researching class imbalance, and the difficulties that result [8, 4]. Unfortunately, the sort of se-vere imbalance seen in anomaly detection is not common-place in this research, an issue we return to later in this paper. On the occasions when imbalance has been severe, the measures used to verify success have obscured the prob-lem. One original motivation for this area of research was
that, when classes were imbalanced, many people observed that learning algorithms often produced classifiers that did little more than predict the most common class. It seemed intuitive that a practical classifier must do much better on the minority class, often the one of greater interest, even if this meant sacrificing performance on the majority class. This was our belief as well, earlier work by one of the au-thors stated [9] “A classifier that labels all regions as [the majority class] will achieve an accuracy of 96% .... a system achieving 94% on [the minority class] and 94% on [the ma-jority class] will have worse accuracy yet be deemed highly successful”.
Provost and Fawcett [13] introduced ROC curves to the data mining community, which seemed the solution to such concerns. ROC curves made clear the inherent trade-off be-tween performance on the positive and negative examples. We could choose a point on this curve and make whatever trade-off we thought appropriate. If costs and class distri-bution were known, this point could be determined by using an iso-performance line, but this decision was best left to the end user of the classifier in the particular application. From a research prospective then we should focus on developing algorithms that produce better ROC curves. An attractive metric for comparing ROC curves that has become popular recently is area-under the curve (AUROC) [10]. This ap-proach encourages the development of algorithms that are effective over a range of costs and class distributions.
For anomaly detection, however, we know that the class distribution is severely imbalanced, we also know the direc-tion of imbalance. We are not interested in performance of the whole curve only its lower left hand corner. Using par-tial AUROC [12] or DET curves [11] would at least concen-trate on the important region. But we have found it difficult to determine the actual performance gains achieved by one classifier over another using ROC curves and these variants are unlikely to help. We introduced an alternative represen-tation called cost curves [6] which makes performance gains explicit.
In the rest of the paper, we show that even a Bayes opti-mal classifier does only marginally better than a trivial clas-sifier with severe imbalance. Real clasclas-sifiers will do worse than Bayes optimal and often even worse than the trivial classifier. If events are rare and not too costly, our learning algorithms can do little. If the events have a higher cost then it is better to have a large number of false alarms, even if the end user finds that undesirable, rather than miss an occurrence. We then continue by defending this viewpoint against various arguments we think might be forthcoming.
2.
SEVERE IMBALANCE
To be useful, a classifier must appreciably outperform a trivial solution, such as choosing the majority class. Many people have observed that for extreme imbalances the ma-jority classifier’s error rate is so small that it seems little can be done to improve on it. Even classifiers with good performance when classes are balanced fare badly for severe imbalance [1]. Here, we make the stronger claim that a “rel-ative reduction” in the majority classifier’s error rate is often unachievable. We focus on “relative reduction” because we think it important to consider what success means when a trivial classifier gets only say 1% wrong. Error rate reduc-tion is the fracreduc-tion of the majority classifier’s error rate that the new classifier removes. The classifier could, in principle, achieve a value of one, removing all existing error. If the majority classifier’s error rate is 1%, a classifier with a 0.4% error rate would have an error rate reduction of 0.6, still a respectable value. This would be equivalent to achieving a 20% error rate when the classes are balanced and the major-ity classifier has an error rate of 50%. This idea seems even more intuitive when considering misclassification costs. The success of a classifier is how much it reduces the costs that occur when using a trivial classifier. We will use the phrase “relative cost reduction” to indicate this and a decrease in error rate if misclassification costs are not used.
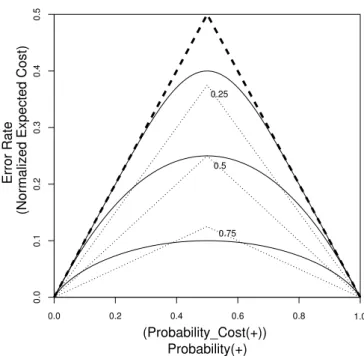
Figure 1 shows cost curves for the Bayes optimal classifier for two univariate normal distributions, one representing the positive class, the other the negative. Drummond and Holte [6] discuss cost curves in detail, here we give a very brief sketch hopefully sufficient for the reader to understand the argument. The bold continuous curves are cost curves for 3 different values of distance between the means of the two normal distributions. The curves give the error rate (the y-axis, ignore the axes’ labels in parentheses for the moment) for each possible prior probability of an instance belonging to the positive class (the x-axis). The dashed triangle is the majority classifier. It has an error rate of zero when the instances are all positive or all negative, x = 0 or x = 1, and an error rate of 0.5 when there are an equal number of positives and negatives, x = 0.5.
We can include costs simply by relabeling the axes, as shown by the text in parentheses. The curves are unchanged, but now give the expected cost, normalized between zero and one, (the y-axis) and the probability times the cost, normal-ized between zero and one, (the x-axis). There is still a triangular trivial classifier, but it now represents the classi-fier that labels instances according to which class produces the smaller expected cost (for simplicity we will still call it the majority classifier).
The distances between the means of the normal distribu-tions were chosen to make the relative cost reduction when the classes are balanced 0.2, 0.5 and 0.8 (from top to bot-tom). The series of progressively smaller triangles in Figure 1, made of dotted lines, we call cost reduction contours. Each cost reduction contour indicates a specific fraction of the cost of using the majority classifier. The continuous curves cross multiple contours indicating a decreasing rela-tive cost reduction as imbalance increases.
If we focus on the lower left hand corner of Figure 1, where the negative instances are much more common than the positives, or more costly to misclassify. The upper two curves have become nearly indistinguishable from the ma-jority classifier for ratios about 20:1. The lowest cost curve
0.5 Probability(+) 0.75 (Probability_Cost(+)) 1.0 0.0 0.2 0.4 0.6 0.8 0.0 0.1 0.2 0.3 0.4 0.5 0.25
(Normalized Expected Cost)
Error Rate
Figure 1: Different Distances
has crossed the 0.5 cost reduction contour at an imbalance of about 10:1 and crossed the 0.25 cost reduction contour at about 50:1. So even a Bayes optimal classifier with good performance, say a normalized expected cost of 0.1 with no imbalance, fares a lot worse when imbalance is severe. With imbalances as low as 10:1, and certainly for imbalances of 100:1 and greater, the performance gain over the majority classifier is minimal.
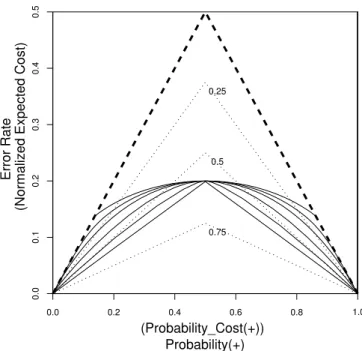
Figure 2 shows examples using non-normal distributions. The problem is made worse when distributions have heavier tails than the normal, the top two curves. With lighter tails the problem is reduced. But only in the case of two overlap-ping uniform distributions, the lower continuous triangle, is the relative cost reduction, when balanced, maintained for all degrees of imbalance. These results are for Bayes optimal classifiers. For practical algorithms any gain will be reduced and possibly disappear altogether.
Introducing misclassification costs will improve the situ-ation, but they should not simply be used as a device to correct class imbalance. They must exist in the application. In some situations, such as safety critical operations, miss-ing a true alarm may have major consequences. Addmiss-ing a large misclassification cost to represent this would, at least somewhat, offset the severe imbalance. But the inclusion of such a cost inevitably produces a high rate of false alarms which users often find unacceptable.
3.
ARGUMENTS AGAINST THE
CONCLU-SIONS
In this section, we try to anticipate the arguments that might be raised against the conclusions we have drawn in this paper.
A small performance gain is worth having.In some situations a small performance gain is the difference between success and failure. But we believe this is by no means the norm. One might argue that if a company’s costs are
1.0 Probability(+) 0.75 (Probability_Cost(+)) 0.0 0.2 0.4 0.6 0.8 0.0 0.1 0.2 0.3 0.4 0.5 0.25 0.5
(Normalized Expected Cost)
Error Rate
Figure 2: Different Distributions
very large even a small percentage represents a large sum of money and therefore well worth saving. Our response is that effort spent on the cost reduction must equate to the savings and this must be viewed in terms of a percentage of total cost to have any meaning to the company.
Some performance measures don’t have this prob-lem. Costs are a very general way of measuring perfor-mance. So if alternative measures don’t exhibit this problem one might ask why not. We have, however, assumed that costs are linear (3 errors costs 3 times as much as 1 error). In information retrieval, where precision-recall is the pre-ferred measure, often one is only interested in retrieving a small sample with high precision. This sample may contain only a very small percentage of the total number of docu-ments on a particular topic. This is an example of highly non-linear costs, which we have not addressed in this paper. For anomaly detection, it is unlikely to be of much value if only a very small percentage of anomalies are found, so the simple linear model is relevant.
An extremely imbalanced application was a suc-cess. One often cited paper, from high energy physics [5], had an imbalance of 1000,000:1. If one can cope with such an extreme imbalance, more modest imbalances such 10,000:1 should be easy. But in this application, as in the above paragraph, precision for a small number of positives was all that was required, the vast majority of positives were ig-nored. In many other examples in the literature imbalance was not severe, less than 10:1. Of the few examples of se-vere imbalance, tables of true positives and false alarms, or ROC curves, were typically used to compare algorithms. These did not address any possible performance advantage the majority classifier.
Real data sets don’t suffer from this problem. Our argument would be weakened if real data sets typically had very low noise. We can only speculate on how much noise is intrinsic. Figure 3 shows cost curves for C4.5 (with the de-faults settings) applied to three UCI data sets [3]. All three
curves cross the lines for the majority classifiers for some degree of imbalance. For the hepatitis data, the topmost curve, this occurs when the positive class has a probability of about 0.2 very close to the actual class frequency in the data set. The middle curve for glass2 fares little better. Its expected cost when everything is balanced is lower, about 0.2. But at quite moderate imbalances of less than 10:1, it is also worse than the majority classifier. The lowest curve for the vote data fares the best, with better than 0.05 nor-malized expected cost when balanced. But even in this case with imbalances greater than 100:1 the majority classifier is better. Some of this might, of course, be due to algorith-mic deficiencies but we suggest that some is due to noise inherent to the problem.
1.0 Probability(+) 0.5 (Probability_Cost(+)) 0.0 0.2 0.4 0.6 0.8 0.0 0.1 0.2 0.3 0.4
(Normalized Expected Cost)
Error Rate
Figure 3: Three UCI Data Sets
Improving the algorithm will eliminate noise. Our analysis used a Bayes optimal classifier, real algorithms will fare worse. But better algorithms would be effective if the problem we have with existing algorithms are due to repre-sentational or search issues rather than inherent noise. Then a Bayes optimal classifier might achieve almost perfect clas-sification, allowing much room for algorithmic improvement. But for this problem to disappear, extremely large regions of instance space without any noise are needed. Whether or not this is likely in practice we leave this to the intuitions of the reader.
4.
CONCLUSIONS
The point of this paper is to raise awareness of the diffi-culty of dealing with rare events. If events are rare and not too costly, the unfortunate conclusion is that our learning algorithms can do little. We should just wait for the event to occur. If the events have a much higher cost then a large number of false alarms should be tolerated. If the end user is unhappy with the number of false alarms the only real answer may be to demonstrate that cost calculations show that capturing a real event is worth any costs assciated with false alarms.
5.
ACKNOWLEDGMENTS
This work was supported by the National Research Coun-cil of Canada and the Alberta Ingenuity Fund through the Alberta Ingenuity Centre for Machine Learning.
6.
REFERENCES
[1] S. Axelsson. The base-rate fallacy and its implications for the difficulty of intrusion detection. In Proceedings of 6th ACM Conference on Computer and
Communications Security, pages 1–7, 1999. [2] S. Bay. A framework for discovering anomalous
regimes in multivariate time-series data with local models.
http://cll.stanford.edu/symposia/anomaly/abstracts.html, 2004.
[3] C. L. Blake and C. J. Merz. UCI repository of machine learning databases, University of California,
Irvine, CA .
www.ics.uci.edu/∼mlearn/MLRepository.html, 1998. [4] N. V. Chawla, N. Japkowicz, and A. Kolcz, editors.
Proceedings of ICML’2003 Workshop on Learning from Imbalanced Data Sets, 2003.
[5] S. H. Clearwater and E. G. Stern. A rule-learning program in high energy physics event classification. Computational Physics Communications, 67:159–182, 1991.
[6] C. Drummond and R. C. Holte. Explicitly
representing expected cost: An alternative to ROC representation. In Proceedings of 6th International Conference on Knowledge Discovery and Data Mining, pages 198–207, New York, 2000. ACM.
[7] T. Fawcett. Activity monitoring: Anomaly detection as on-line classification.
http://cll.stanford.edu/symposia/anomaly/abstracts.html, 2004.
[8] N. Japkowicz, editor. Proceedings of AAAI’2000 Workshop on Learning from Imbalanced Data Sets, 2000. AAAI Tech Report WS-00-05.
[9] M. Kubat, R. C. Holte, and S. Matwin. Machine learning for the detection of oil spills in satellite radar images. Machine Learning, 30:195–215, 1998.
[10] C. X. Ling, J. Huang, and H. Zhang. AUC: a statistically consistent and more discriminating measure than accuracy. In Proceedings of 18th International Joint Conference on Artificial Intelligence, pages 519–524, 2003.
[11] A. Martin, G. Doddington, T. Kamm, M. Ordowski, and M. Przybocki. The det curve in assessment of detection task performance. In Proceedings of the 5th European Conference on Speech Communication and Technology, pages 1895–1898, 1997.
[12] S. H. Park, J. M. Goo, and C.-H. Jo. Receiver operating characteristic (roc) curve: Practical review for radiologists. Korean Journal of Radiology, 5(1), 2004.
[13] F. Provost and T. Fawcett. Analysis and visualization of classifier performance: Comparison under imprecise class and cost distributions. In Proceedings of the Third International Conference on Knowledge Discovery and Data Mining, pages 43–48, 1997.
View publication stats View publication stats