Carbon and Sulfur Isotopic Constraints on Ediacaran Biogeochemical Processes, Huqf Supergroup, Sultanate of Oman
by
David Andrew Fike B.S. Engineering Physics
B.S. Astronomy B.S. Geology
University of Illinois, Urbana-Champgain, 2001 M. Phil. Polar Studies
Churchill College, University of Cambridge, UK, 2002
SUBMITTED TO THE DEPARTMENT OF EARTH, ATMOSPHERIC & PLANETARY SCIENCES IN PARTIAL FULFILLMENT OF THE REQUIREMENTS
FOR THE DEGREE OF
DOCTOR OF PHILOSOPHY IN GEOCHEMISTRY AT THE
MASSACHUSETTS INSTITUTE OF TECHNOLOGY AUGUST 2007
C Massachusetts Institute of Technology.
All rights reserved.
Signature of author: -'-
-z 6 epartment of Earth, Atmospheric, & Planetary Sciences
August 6, 2007
Certified by: . .
SV
Professor John GrotzingerThesis Supervisor " / -Accepted by: MASAC1UbI H'4I·r;iUiT~ MASSAGU-IUE-I-S INI ! OF TECHNOLOGY
OCT 2 2 2007
LIBRARIES
Maria T. Zuber E.A. Griswold Professor of Geophysics Head, Department of Earth, Atmospheric & Planetary SciencesARCHME$
Carbon and Sulfur Isotopic Constraints on Ediacaran Biogeochemical Processes, Huqf Supergroup, Sultanate of Oman
by
David Andrew Fike
Submitted to the Department of Earth, Atmospheric, & Planetary Sciences on August 6, 2007 in Partial Fulfillment of the Requirements
for the Degree of Doctor of Philosophy ABSTRACT
The link between environmental and evolutionary change is investigated in the Ediacaran Period (- 635 - 541 million years ago (Ma), an interval where we see the emergence of macroscopic animals along with large perturbations to the carbon and sulfur cycles. Paleoenvironmental reconstruction used the carbon and sulfur isotopic composition of sedimentary minerals and organic matter, supplemented by geochemical and molecular biomarker proxies, of strata from the Huqf Supergroup, Sultanate of Oman.
Within Ediacaran strata, three successive stages of geochemical oxidation are observed and correlated to episodes of biological evolution. The second stage corresponds to the large Shuram 61 3Ccarb excursion and is identified with the oxidation of an organic carbon reservoir. An extreme enrichment in sulfur isotopes occurs in the overlying strata spanning the Ediacaran-Cambrian (E-C) boundary. This interval is characterized using paired sulfate and pyrite sulfur isotopes to quantify pyrite burial and the isotopic composition of sulfur entering the ocean, which leads to a reinterpretation of existing Phanerozoic data. These strata contain sulfates in two forms (carbonate-associated sulfate: CAS, and anhydrite), providing an opportunity to investigate isotopic offsets reported between these seawater sulfate proxies. The results indicate that changing basin restriction can significantly alter the isotopic composition of gypsum/anhydrite and suggest that CAS is the most reliable proxy for the reconstruction of the marine sulfur cycle. A combination of geochemical and biomarker proxies were used to investigate the biological and environmental changes across the
Ediacaran-Cambrian boundary. In the Huqf strata, a crash in the photic zone primary production is observed immediately before the geochemical evidence for anoxia that is typically associated with the extinction of the Ediacaran organisms at the E-C boundary.
All of these studies rely on interpretations made from geochemical data, which depend on how representative of depositional conditions (local, regional, or global) a given dataset is. Carbon and sulfur isotopes are characterized from replicate sections of the Huqf Supergroup strata to assess the basin-scale (-1,000km) reproducibility of these signals. The trends in the sulfur isotopic record were reproducible across the basin and serve to correlate sections lacking distinctive carbon isotopes or lithologies.
Thesis Supervisor: John Grotzinger Title: Professor of Geology
-4-ACKNOWLEDGMENTS
This thesis has come together over the course of five years through a combination of hard work, helpful discussions with my colleagues and advisors, the oft-called-upon support of friends and family, and a healthy dose of good luck. I first and foremost want to acknowledge the unflagging support (moral, mental, and fiscal) from my advisor John Grotzinger. When John became my advisor in the fall of 2002, he found himself with a student possessed by a chronic need to switch disciplines and learn something about everything. Under his guidance, I was moulded into a scientist capable of the detailed focus required for a Ph.D., and more importantly, John kindled the desire to distil problems to their essence that will serve me well for the rest of my career. Despite carefully shepherding my research focus, John exposed me to a variety of different experiences that profoundly changed my life. Two weeks in the Namibian wilderness during the summer before I officially began at MIT introduced me to Ediacaran-age rocks, which would later become the focus of my Ph.D. In my second year of grad school, I had the opportunity to work with John on NASA's MER mission and help Opportunity explore Meridiani Planum. I will cherish the experiences from this mission for the rest of my life. When John left MIT during the start of my fourth year, my last two years of grad school were split between Caltech and MIT. I am grateful for the warm welcome I received during my temporary stay at Caltech, particularly from Victoria Orphan, John Eiler, and Alex Sessions as well as the entire GPS Division. In addition, friendships and discussions with Joannah, Amy, Crystal, Justin, and Shana have made my life (and this thesis) better. Since moving out to Caltech, I have been grateful for the presence of Tim Lyons and his group at UC-Riverside, where I have often found a second
(third?) home and good friends.
My continued sanity during the frequent trips between MIT and Caltech is due in no small part to Roger Summons. Roger had essentially been a co-advisor from the start of my time at MIT, giving me full access to his lab and his time. Roger's generosity continued after my departure and he provided both the necessary lab space and welcome lodging during my return visits. I am profoundly indebted to his generosity (and that of his wife Elizabeth!). Within Roger's lab, I have greatly enjoyed the interactions and
-5-friendships with Alex Bradley, Emma Grosjean, Amy Kelly, and Gordon Love, who have all taught me more than I can appreciate. In addition, I have benefited greatly from working with and alongside Carolyn Colonero, Rick Kayser, Aurana Lewis, and Laura Sherman. Within EAPS, I have benefited strongly from interacting with Sam Bowring and Dan Rothman (over coffee and in seminar). My time at MIT would not have been the same without the friendship of my officemates Brandon and Wes. I want to thank the EAPS administration, particularly Roberta, Carol, and Vicki for making my time here so pleasant.
Over the past five years, Lisa Pratt has welcomed me into her lab and her family during my frequent trips to Indiana to run my sulfur isotopes. Without that kindness this thesis would not have been possible. At Indiana, I am especially grateful for the conversations, technical support, and friendship of David Finkelstein and Steve Studley. I have benefited greatly from interactions with many others, particularly Andy Knoll and Don Canfield, and I am especially grateful to Adam Maloof, who took me under his wing and into the field. I would like to thank all my friends, particularly Brian, Julius, Jim, Olivier, Charles, Anna, and especially Melissa for putting up with me all these years, and my family, which has been supportive every step of the way. Special thanks are reserved for Tudor, who has been there for me for the past two years. I am deeply grateful for support over the course of the past years by MIT/EAPS, NASA, NSF, PDO, the Agouron Institute, and the MIT Global Habitability Award. I would like to dedicate this thesis to Roberta Bennett-Calorio, a dear friend and the best admin any grad student could have ever hoped for.
-6-Table of Contents
Introduction: 9
Chapter 1: Oxidation of the Ediacaran ocean
* Main Body (Nature, 444: 744 - 747) 13
* Appendix A (Supplementary Information) 26
* Appendix B (Table S1: Isotopic and geochemical data) 36 * Appendix C (Comment by Calver & Grey (Nature, in press)) 40 * Appendix D (Response by Fike et al. (Nature, in press)) 44 Chapter 2: A paired sulfate-pyrite 634S approach to understanding
the evolution of the Ediacaran-Cambrian sulfur cycle
* Main Body (in review GCA) 47
* Appendix A (Table S1: Isotopic data) 105
Chapter 3: Detection of variable basin restriction using sulfate 634S in carbonate-evaporite strata: An example from the Ediacaran-Cambrian Ara Group, Sultanate of Oman
* Main Body (to be submitted to Geology) 111
* Appendix A (Table S1:Isotopic data) 129
Chapter 4: The Ediacaran-Cambrian boundary: a two-stage record of ecological and geochemical change
* Main Body (to be submitted to PNAS) 137
* Appendix A (Supplementary information) 158
* Appendix B (Table Si: Isotopic data) 161
* Appendix C (Table S2: Biomarker data) 168
Chapter 5: Intrabasinal sulfur isotope chemostratigraphy of the Ediacaran-Cambrian strata of the Huqf Supergroup, Sultanate of Oman: a synthesis of subsurface and outcrop data
* Main Body 170
-8-INTRODUCTION
One of the longstanding goals in the study of biogeochemical cycling is to understand the evolutionary history of the Earth's surface environment - ocean, atmosphere, and biosphere. The motivating interest behind this dissertation was the desire to reconstruct environmental conditions across a time span that has been of significant recent paleobiological interest: the Ediacaran Period (- 635 - 541 million years ago (Ma)) of Earth history (KNOLL et al., 2004). The Ediacaran Period begins in the wake of the Marinoan glaciation, in which ice sheets are believed to have extended to very low latitudes, possibly covering the Earth - with profound consequences for biological and geochemical evolution on Earth (HOFFMAN et al., 1998). The first appearance of macroscopic organisms, the Ediacaran fauna (NARBONNE, 2005), appear in successive stages throughout the later Ediacaran and appear to go extinct at the Ediacaran-Cambrian boundary (AMTHOR et al., 2003), making way for the ancestors of all modem animals in the subsequent evolutionary radiation known as the Cambrian explosion. The unanswered question that remains is how these evolutionary changes are related (if at all) to environmental changes, such as the oxygenation of the ocean (MARSHALL, 2006). The mid-Ediacaran records an extreme perturbation, the Shuram excursion (BURNS and MATTER, 1993), to the global carbon cycle, as measured by the carbon isotopic composition of marine carbonate minerals (613Ccarb). The end-Ediacaran is known to contain strata characterized by anomalously enriched sulfur isotopes in marine sulfates (634
Ss04) (THODE and MONSTER, 1965). These two events stand out as the most extreme perturbations to their respective (carbon and sulfur) biogeochemical
-9-cycles. The timing of their occurrence, the sulfur anomaly beginning at the end of the carbon excursion, and its relationship to stages of animal evolution suggest that there are strong environmental controls on the evolutionary events of the Ediacaran Period. Thus the goal behind the present study has been to characterize environmental change throughout the Ediacaran period, understand its cause, and relate it to evolutionary
development.
To this end, I have undertaken a study of biogeochemical cycling in Ediacaran -earliest Cambrian (-635 - 540 Ma) strata of the Huqf Supergroup, Sultanate of Oman, using the carbon and sulfur isotopic composition of marine sedimentary minerals and organic matter. In Chapter 1 (Oxidation of the Ediacaran Ocean), the record of carbon isotopes in carbonates and organic matter and sulfur isotopes in sulfate and pyrite is examined from a section that spans the majority of the Ediacaran Period (- 635 - 548 Ma). Here, three successive stages of geochemical oxidation are observed, and correlated to stages of biological evolution. In Chapter 2 (A paired sulfate-pyrite 834S approach to
understanding the evolution of the Ediacaran-Cambrian sulfur cycle), the dynamics of the sulfur cycle are examined across the extreme enrichment in sulfur isotopes in strata spanning the Ediacaran-Cambrian boundary (- 548 - 540 Ma) using paired sulfate and pyrite sulfur isotopes. Using a new approach, we are able for the first time to quantify parameters of sulfur cycling (fpyr: pyrite burial; 834Sin: the isotopic composition of sulfur entering the ocean) and reinterpret existing data from the Phanerozoic (-541 Ma -present) to cast new light on the long-term operation of the sulfur cycle. In Chapter 3 (Detection of variable basin restriction using sulfate 834S in carbonate-evaporite strata: An example from the Ediacaran-Cambrian Ara Group, Sultanate of Oman), a
-10-resolution study of carbonate-evaporite strata was undertaken to understand reported offsets between sulfur isotopes in two different proxies for seawater sulfate (CAS: carbonate-associated sulfate and gypsum/anhydrite). The results indicate that changing basin restriction can significantly alter, and in particular enrich, the isotopic composition of gypsum/anhydrite and suggest that CAS is the most reliable proxy for the reconstruction of the marine sulfur cycle. In Chapter 4 (The Ediacaran-Cambrian boundary: a two-stage record of ecological and geochemical change), a combination of geochemical proxies (carbon and nitrogen isotopes, and trace element enrichments) and molecular biomarkers (a suite of phylogeny- and metabolism-specific organic molecules) are used to investigate the biological and environmental changes across the Ediacaran-Cambrian boundary. In the Huqf strata, a crash in the photic zone primary production is observed immediately before the geochemical evidence for anoxia that is typically associated with the extinction of the Ediacaran organism.
All of these studies rely on interpretations made from geochemical data. The utility, in terms of the paleoenvironmental information that can be extracted and the potential as a tool for correlation, of these biogeochemical proxies depends to a large degree in the confidence one has about how representative of depositional conditions (local, regional, or global) a given dataset is. This is investigated in Chapter 5 (Basin-wide sulfur isotope chemostratigraphy of the Ediacaran-Cambrian strata of the Huqf Supergroup, Sultanate of Oman: a synthesis of subsurface and outcrop data), where the sulfur and carbon isotopes are characterized from replicate sections of the Ediacaran Huqf Supergroup strata in Oman to assess the basin-scale (-1,000km) reproducibility of these signals.
-11-References:
Amthor, J. E., Grotzinger, J. P., Schroder, S., Bowring, S. A., Ramezani, J., Martin, M. W., and Matter, A., 2003. Extinction of Cloudina and Namacalathus at the Precambrian-Cambrian boundary in Oman.
Geology 31, 431-434.
Bums, S. J. and Matter, A., 1993. Carbon isotopic record of the latest Proterozoic from Oman. Eclogae
Geologicae Helvetiae 86, 595-607.
Hoffman, P. F., Kaufman, A. J., Halverson, G. P., and Schrag, D. P., 1998. A Neoproterozoic snowball earth. Science 281, 1342-1346.
Knoll, A. H., Walter, M. R., Narbonne, G. M., and Christie-Blick, N., 2004. A new period for the geologic time scale. Science 305, 621-622.
Marshall, C. R., 2006. Explaining the Cambrian "explosion" of animals. Annual Review of Earth and
Planetary Sciences 34.
Narbonne, G. M., 2005. The Ediacara Biota: Neoproterozoic Origin of Animals and Their Ecosystems.
Annu. Rev. Earth Planet. Sci. 33, 1 -22.
Thode, H. D. and Monster, J., 1965. Sulfur-isotope geochemistry of petroleum, evaporites, and ancient seas, Fluids in Subsurfaces Environments, Memoir 4. American Association of Petroleum Geologists, Tulsa, OK.
-CHAPTER 1
Oxidation of the Ediacaran Ocean
D. A. Fike1*, J. P. Grotzingerlt, L. M. Pratt2, and R. E. Summons1
'Department of Earth, Atmospheric, & Planetary Sciences, Massachusetts Institute of Technology, Cambridge, MA 02139, USA
2Department of Geological Sciences, Indiana University, Bloomington, IN 47405, USA tpresent address: Division of Geological and Planetary Sciences, California Institute of
Technology, Pasadena, CA 91125, USA
ABSTRACT
Oxygenation of the Earth is increasingly regarded to have occurred in two steps. The first step, which occurred -2,300 million years ago (Myr) ago, involved a significant increase in atmospheric oxygen concentrations and oxygenation of the surface ocean (BEKKER et al., 2004; HOLLAND, 1984). A further increase in atmospheric oxygen appears to have taken place during the late Neoproterozoic period (CANFIELD and TESKE, 1996; DES MARAIS et al., 1992) (-800-542 Myr ago). This increase may have stimulated the evolution of macroscopic multicellular animals and the subsequent radiation of calcified invertebrates (DES MARAIS et al., 1992; KNOLL and CARROLL, 1999), and may have led to oxygenation of the deep ocean (ROTHMAN et al., 2003). However, the nature and timing of Neoproterozoic oxidation remain uncertain. Here we present high-resolution carbon and sulphur isotope records from the Huqf Supergroup, Sultanate of Oman, that cover the majority of the Ediacaran periood (-635 - 548 Myr ago). These records indicate that the ocean became increasingly oxygenated after the end of the Marinoan glaciation, and they allow us to identify three distinct stages of oxidation. When considered in the context of other records from this period (BOWRING et al., 2007; CALVER, 2000; CONDON et al., 2005; CORSETTI and KAUFMAN, 2003; GREY, 2005; GROTZINGER et al., 1995; MARTIN et al., 2000; NARBONNE, 2005; WORKMAN et al., 2002), our data indicate that certain groups of eukaryotic organisms appeared and diversified during the second and third stages of oxygenation. The second stage corresponds with the Shuram excursion in the carbon isotope record (BURNS and MATTER, 1993) and seems to have involved the oxidation of a large reservoir of organic carbon suspended in the deep ocean (ROTHMAN et al., 2003), indicating that this event may have had a key role in the evolution of eukaryotic organisms. Our data thus provide new insights into the oxygenation of the Ediacaran ocean and the stepwise restructuring of the carbon (BURNS and MATTER, 1993; LOGAN et al., 1995; ROTHMAN et al., 2003) and sulphur cycles (CANFIELD, 2004; CANFIELD and TESKE, 1996; HURTGEN et al., 2006) that occurred during this significant period of Earth's history.
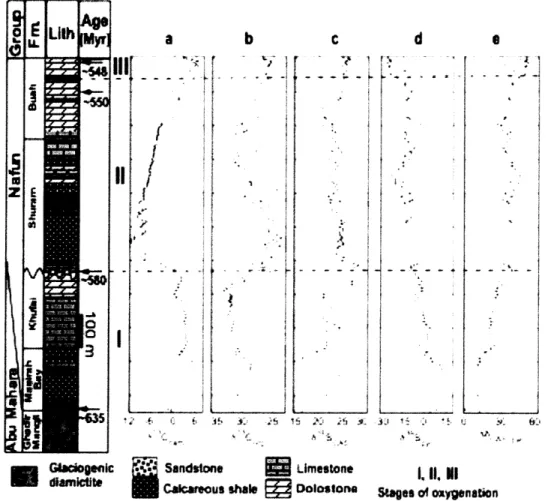
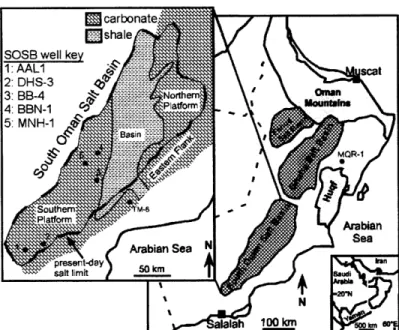
The Huqf Supergroup (-635 - 540 Myr) provides one of the best preserved, most continuous sections of Ediacaran-age strata(AMTHOR et al., 2003) (Figure 1). The Abu Mahara Group contains Marinoan-equivalent glacial deposits (Fiq Formation and associated Hadash cap carbonate) that overlie -800-Myr-old crystalline basement (BOWRING et al., 2007). Nafun Group sediments were deposited in a regionally extensive sag basin under open, shallow marine conditions, and each formation can be traced laterally for several hundred km (MCCARRON, 2000). Nafun strata (see Supplementary Information for a detailed discussion of lithostratigraphy) comprise two clastic-to-carbonate shallowing-upward successions (Masirah Bay Formation-Khufai Formation; Shuram Formation - Buah Formation) with an unconformity across the Khufai-Shuram boundary that probably includes the interval of Gaskiers glaciation at - 580 Myr (BOWRING et al., 2002). Global correlation of 813Carb (carbonate carbon, see Supplementary Information for carbon and sulphur isotope nomenclature) anomalies provides two age constraints for the Buah Formation (Figure 1): -550 Myr for the mid-Buah (correlation with Doushantuo Formation, China (BOWRING et al., 2007; CONDON et al., 2005)); and -548 Myr for the upper Buah (correlation with Nama Group, Namibia (BOWRING et al., 2007; GROTZINGER et al., 1995)). These ages are supported by multiple ages spanning 541 - 547 Myr ago obtained from the overlying Ara Group.
Here we present carbon and sulphur isotope data from the Huqf Supergroup (Figure 1; see Supplementary Information for detailed discussion of the data). All data from the Nafun Group were collected from cuttings in the Miqrat-1 well (Supplementary Figure
S 1), previously established as one of the most representative subsurface sections of Huqf
excursion in 513
Ccarb, reaching a minimum of - -12%o. The excursion spans -500m of
stratigraphic section (BURNS and MATTER, 1993) and is the largest known perturbation to the global carbon cycle in Earth history.
a
I
t~·/
3
r V S i "" i :\· S . 11 15 ~i2 ·15 t5 .3 15 4 8e
.2i1 141 ,'dicalcacous shale Dolostone S•a.gesoi oxygenation
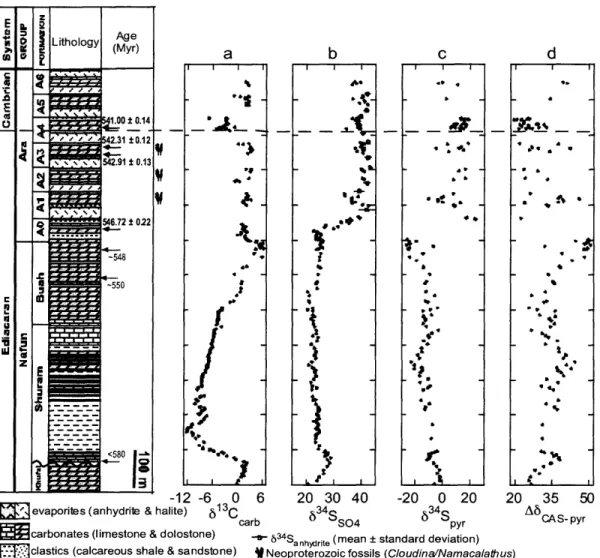
Figure 1: Huqf Supergroup showing geochronologic, paleobiological, and
chemostratigraphic contraints. The Hadash cap carbonate lies immediately above the
Ghadir Manqil glacial diamictite and conformably below the Masirah Bay Formation. Geochronologic data are from correlation to other sections containing U-Pb zircon ages on ash beds (BOWRING et al., 2002; CONDON et al., 2005; GROTZINGER et al., 1995). Data plotted are as follows: 613Ccarb (a), 613Corg (TOC) (b), 834Sso
4 (C), 34Spyr (d), and
A634S = 134SSO4 _ 3 4
Spyr (e). The dashed line at 46%o indicates the maximum fractionation associated with BSR. The 20 error bars for isotopic measurements, based on replicate analyses of standards and samples, are 61 3
Ccarb = 634S 504 - 0.15%o; 613 Corg-834Spyr _ 0.4%o). " (kt ,z Ir ·· :i · ~ *r r · 1 r _ -i i t 1 4: hi-i " i*
The Shuram excursion is fundamentally different from all known 813Ccarb excursions (for example the Marinoan cap carbonate, the Ediacaran/Cambrian boundary, and the Permian/Triassic boundary), in that 13Ccarb reaches well below the mantle value of about -6%o. Because &13Ccarb values extend below -6%o, and cannot readily be explained by changes in organic carbon burial or isotope fractionation during carbon fixation (DES MARAIS et al., 1992), the Shuram excursion was initially attributed to diagenetic alteration of the 513CCab signal (BURNS and MATTER, 1993; MCCARRON, 2000). However, standard methods of assessing diagenesis (see Supplementary Figure S2a,b and discussion in Supplementary Information) indicate these samples retain primary &13Cca, values. Furthermore, the Shuram excursion is now documented in over 30 sections in Oman, covering a region in excess of 105 km2 with little variation in either the magnitude or duration (AMTHOR et al., 2003; BURNS and MATTER, 1993; LE GUERROUE et al., 2006a). Additionally, potentially correlative excursions have been found across the globe: the Doushantuo Formation, China (CONDON et al., 2005); the Wonoka Formation, Australia (CALVER, 2000); the Johnnie Formation, USA (CORSETTI and KAUFMAN, 2003); and the Nama Group, Namibia (WORKMAN et al., 2002) (Figure 2). Together, these argue that the Shuram excursion is a primary record of an unprecedented perturbation to the global carbon cycle.
Unlike younger carbon isotopic anomalies that are expressed by 813Cca in carbonate sections and 813Corg (organic carbon) in siliciclastic sections, the Shuram excursion has been identified only in carbonate sections(BURNs and MATTER, 1993; CALVER, 2000; CONDON et al., 2005; CORSETTI and KAUFMAN, 2003; MELEZHIK et al., 2005; WORKMAN et al., 2002). Given the absence of covariation in 613Corg with 613Ccarb during the Shuram
excursion reported here and from the Wonoka Formation in Australia(CALVER, 2000), the excursion would be undetectable in Shuram-equivalent siliciclastic strata, which are reliant on 613Corg for chemostratigraphy. This may explain why the Shuram excursion has not been found in more Ediacaran sections (e.g., Windemere Supergroup, Canada).
The data presented here point to a progressive oxidation of the Ediacaran ocean in three stages following the end of Marinoan glaciation. These successive stages occur well after the last of the extreme Neoproterozoic glaciations (CONDON et al., 2005) and before the extinction and subsequent evolutionary radiation across the Ediacaran-Cambrian boundary (AMTHOR et al., 2003). The first stage of oxidation occurs in the Khufai and Masirah Bay formations above the Marinoan-equivalent Hadash cap carbonate. In the Hadash cap, A634S, the difference between coeval 634Sso4 (carbonate-associated sulphate) and 634
Spyr (pyrite) (Figure le), ranges from 1%o to 12%o. These low values, consistent with those found above the coeval Marinoan in Namibia (HURTGEN et al., 2006), indicate marine sulphate concentrations ([SO4]) of less than 200 [M (HABICHT et al., 2002), which prevents the expression of significant isotopic fractionation during bacterial sulphate reduction (BSR). Throughout the Masirah Bay and Khufai formations above the cap carbonate, A634S rises gradually to -35%o, recording a rise to [SO4] > 200gM and the unlimited expression of BSR fractionation. Although it is difficult to gauge the magnitude of the increase in [SO4], reports (CANFIELD, 2004; HURTGEN et al., 2006) of Ediacaran and early Cambrian enrichment and variability in 634Ss
0 4, suggest that [SO4] did not exceed -5 mM (KAH et al., 2004), which is appreciably lower than the modem value of 28 mM. Two key fluxes for regulating [SO4] are riverine sulphate derived from pyrite oxidation (source) and marine reduction of sulphate to sulphide
(sink). Because these fluxes both depend directly on oxygen concentrations, increased [SO4] probably correlates with increased oxygen availability. It is likely that the increase in [SO4] above the cap carbonate is in part the recovery from a glacially induced drawdown of sulphate concentrations (HURTGEN et al., 2006). However, on the basis of -610-Myr-old detrital zircons in the upper Khufai (BOWRING et al., 2007; LE GUERROUE et al., 2006b) the minimum time represented by the increase in Ab3 4S in stage I strata overlying the -635-Myr-old Marinoan cap carbonate is -25 Myr and therefore probably records an increase in atmospheric oxygen in addition to any effects associated with deglaciation. This increase in A834S constitutes the first stage (Figure 1, stage I) of
Ediacaran oxidation observed in the Huqf sediments. Throughout stage I strata, 8'3 Ccarb
and 513Corg were not coupled.
The second stage (Figure 1, stage II) of Ediacaran oxidation corresponds to the duration of the Shuram excursion and encompasses the Shuram and lower Buah formations. Although these strata lie immediately above the Khufai, the likely presence of a significant unconformity prevents meaningful comparison between data from the base of the Shuram and those from the top of the Khufai. The absence of a parallel negative excursion in 613Corg suggests that pools of organic carbon and dissolved inorganic carbon in the Ediacaran ocean were effectively decoupled, such that excursions in 613Ccarb, which reflects the dissolved inorganic carbon pool - the source for carbon fixation of coeval organic matter - were not recorded in 613Corg of syndepositional sediments (ROTHMAN et al., 2003). Our trends agree with the observation (ROTHMAN et al., 2003) of an overall absence of covariation between 813Corg and 813Ccb in a global compilation of Neoproterozoic data from - 730 - 555 Myr ago. With decoupled carbon
reservoirs, negative excursions in 13Ccarb can result from the oxidation of part of a much
larger DOC reservoir represented by the deep ocean, and their amplitude is limited by 813Corg (~ -30%o) rather than mantle composition (about -6%o) as in a steady-state model. (Here and throughout the text, the term DOC is used to refer to a large reservoir of organic carbon (not the result of coeval primary production) suspended in the deep ocean; use of the term DOC is not intended to distinguish between truly 'dissolved' organic carbon and suspended colloidal or fine particulate organic carbon.) This vast DOC reservoir would effectively buffer coexisting 813Corg through adsorption on siliciclastic particles and/or during carbonate precipitation in significant excess of the influx of detritus from primary production. At the initiation of the Shuram excursion, this adsorption would have to contribute a90% of TOC to mask the signal of 613C-depleted primary organic matter. However, because the organic reservoir is depleted through progressive oxidation, the relative contribution of coeval 613C-depleted primary production to 613Corg increases; this is observed (Figure lb) in the upper portion of stage II as 513Corg decreases from about -26%o to about -31%o. As the organic reservoir is finally oxidized, the onset of covariation in 813Cca, and 813Crg (r2 = 0.72 for the upper ~
200m of section) becomes apparent. Further evidence supporting oxidation during stage II is given in Supplementary Information.
The constancy of A634S during the Shuram excursion indicates that, despite these changes, BSR under sulphate-replete conditions remained the dominant pathway for sulphur cycling in the ocean. However, in the upper Buah, an increase in A634S to
_ 50%o0
indicates a change in the metabolisms involved in marine sulphur cycling. The maximum fractionation observed (Canfield and Teske, 1996) in both laboratory and field studies
during BSR is 4 6%o; typical fractionations are often much smaller (DETMERS et al., 2001). However, communities characterized by BSR coupled with bacterial sulphur disproportionation (BSD), a pathway (CANFIELD and TESKE, 1996) in which intermediate valence sulphur species (for example So and S2032) are split into 34S-enriched sulphate
and 34S-depleted hydrogen sulphide, have fractionations that can approach 70%o. There is evidence from paired 633S-_34S data for the evolution of BSD as early as the Mesoproterozoic (JOHNSTON et al., 2005); however, there have been no reports of coeval A634S >46%o in any Proterozoic sample (Hurtgen et al., 2005). Because BSD requires the presence of intermediate valence S species, the oxidative sulphur cycle must have been active. Evidence for BSD therefore demonstrates additional oxidation of the Ediacaran ocean immediately after the Shuram recovery and constitutes the third stage (Figure 1, stage III) of Ediacaran oxidation preserved in the Huqf sediments.
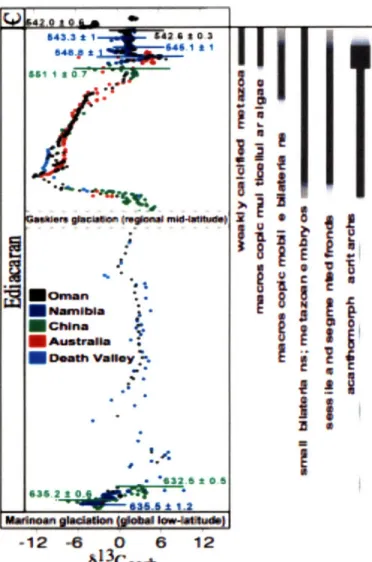
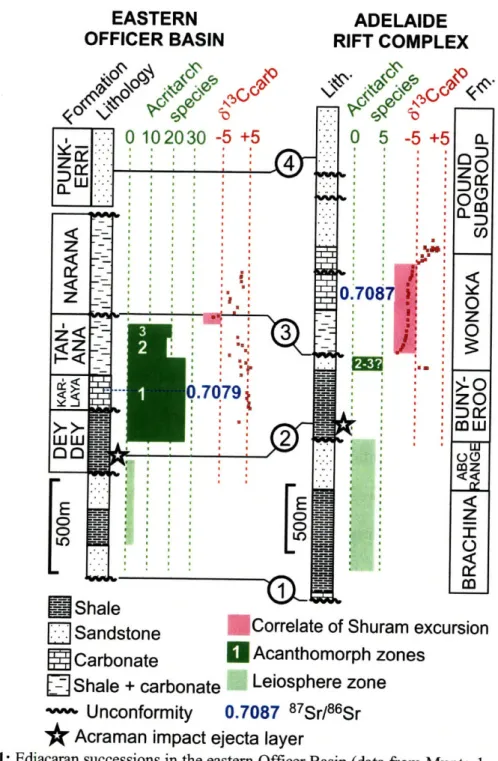
The data presented in this paper provide a record of multi-stage oxidation of Earth's surficial environment during Ediacaran time. We now place this record into a global paleobiological context by integrating coeval records of both plankton (acanthomorph acritarchs) and benthic Ediacaran soft-bodied animals into our chemostratigraphic context (Figure 2). Well-characterized palynological assemblages that record the evolution of the acanthomorph acritarchs (GREY, 2005) are preserved in two chemostratigraphically-constrained sections (China and Australia) potentially correlative to the Shuram excursion (Figure 2). In Australia, the appearance of acanthomorph acritarchs approximately coincides with the onset of the Shuram excursion (our stage II oxidation) in the Wonoka Formation, Adelaide Rift Complex (CALVER, 2000; GREY, 2005). The Acraman impact event has previously been postulated as the stimulus for the
-12 -6 0 6 12 613Ccatr
Figure 2: Compilation of Ediacaran 81 3Ccarb from sections known to contain the Shuram excursion. The vertical axis is approximate time, with known geochronologic
constraints plotted. On the right are plotted the known range of acanthomorph acritarchs and Ediacaran biota are plotted (shading indicates uncertainty relative to 813C chemostratigraphy). Points are coloured as follows: black, Oman; dark blue, Namibia; green, China; red, Australia; cyan, Death Valley. Full references for data, U/Pb zircon ages, biostratigraphic range, and the method for correlating sections are provided in Supplementary Information.
acanthomorph acritarch radiation (GREY, 2005). However, impact ejecta occur -140m below strata marking both the radiation and the initiation of the Shuram excursion. We therefore propose alternatively that the acritarch radiation is temporally correlated with the increased oxidation of the ocean and subsequent ecological changes that occurred during the Shuram excursion. The most diverse assemblage of acritarchs occurs in (or
just below, see Appendices C,D) the Julie Formation, Amadeus Basin (GREY, 2005) during an excursion in 813Ccarb of up to +5 (Figure 2), which we interpret as equivalent to the stage III oxidation event based on 6'3Ccarb correlation to the upper Buah Formation in Oman and the lower Nama Group of Namibia, where the age of the correlative positive
613Ccarb isotopic excursion is constrained to -548 Myr (GROTZINGER et al., 1995).
Although neither the carbonates of the Nama Group nor the Buah Formation have yielded well-preserved acritarch populations, acanthomorph acritarchs in the shale-rich Doushantuo Formation of China (GREY, 2005) appear at approximately the same stratigraphic position as the reported Shuram excursion (CONDON et al., 2005). The coincidence of the latter two stages of oxidation with the first appearance and subsequent diversification of acanthomorph acritarchs suggests that the oxidation of the ocean played a major role in the evolution of these planktic photosynthetic organisms.
It is not possible to confidently determine whether the first known appearance of the
Ediacaran biota at -575Ma (NARBONNE, 2005) predates or postdates the onset of the
Shuram excursion, because of a lack of overlapping biostratigraphic and chemostratigraphic data. However, both the Shuram excursion and the first appearance of Ediacaran organisms postdate the Gaskiers glacial event at -580 Myr (see Supplementary Information), yet predate the positive 13Ccarb excursion at -548 Myr ago. It is therefore possible that the second stage of oxygenation helped to stimulate radiation of the first Ediacaran organisms, which are interpreted to have been sessile frond-like animals (such as Charnia); while these organisms appear to have inhabited a variety of
different paleoenvironments (MARTIN et al., 2000; NARBONNE, 2005), all evidence
However, it is not until -555 Myr (MARTIN et al., 2000), as the Shuram excursion drew to a close, that we see the appearance of the first motile, bilaterian organisms (for example, Kimberella) in a wider range of depositional facies. Finally, the first calcifying metazoa Cloudina and Namacalathus, well documented in both Oman and Namibia, appeared -548 Myr ago, after the strong BSD signal. The coincidence of the latter two stages of oxidation identified in this study with the appearance of motile and calcifying Ediacarans, respectively, suggests that the events observed in Oman were global and affected the evolution of early metazoa.
Examination of the Huqf Supergroup, Sultanate of Oman reveals a three-stage oxidation of the Ediacaran ocean. The first stage corresponds to an increase in sulphate concentrations (>200jpM) after the Marinoan glaciation, due in part to an increase in atmospheric oxygen. The second stage consists of the Shuram excursion and the oxidation of a deep-ocean DOC reservoir, probably the last major redox barrier to ocean oxygenation. This stage is coincident with the appearance of complex acanthomorph acritarchs and motile metazoa. The final stage of Ediacaran oxidation is based on strong signals of BSD and covariation in 613Ccarb and 613Corg, coincident with an increase in the diversity of acanthomorph acritarchs and the first appearance of the calcifying metazoa
Namacalthus and Cloudina. Taken together, these data record the progressive oxygenation of the Ediacaran ocean, stimulating the evolution of both planktic and benthic groups of organisms.
References
Amthor, J. E., Grotzinger, J. P., Schroder, S., Bowring, S. A., Ramezani, J., Martin, M. W., and Matter, A., 2003. Extinction of Cloudina and Namacalathus at the Precambrian-Cambrian boundary in Oman.
Bekker, A., Holland, H. D., Wang, P. L., Rumble, D., Stein, H. J., Hannah, J. L., Coetzee, L. L., and Beukes, N. J., 2004. Dating the rise of atmospheric oxygen. Nature 427, 117-120.
Bowring, S. A., Grotzinger, J. P., Condon, D. J., Ramezani, J., and Newall, M., 2007. Geochronologic constraints on the chronostratigraphic framework of the Neoproterozoic Huqf Supergroup, Sultanate of Oman. American Journal of Science (in press).
Bowring, S. A., Myrow, P. M., Landing, E., and Ramezani, J., 2002. Geochronological contraints on terminal Neoproterozoic events and the rise of Metazoans. Astrobiology 2, 457.
Bums, S. J. and Matter, A., 1993. Carbon isotopic record of the latest Proterozoic from Oman. Eclogae
Geologicae Helvetiae 86, 595-607.
Calver, C. R., 2000. Isotope stratigraphy of the Ediacarian (Neoproterozoic III) of the Adelaide Rift Complex, Australia, and the overprint of water column stratification. Precambrian Research 100,
121-150.
Canfield, D. E., 2004. The evolution of the Earth surface sulfur reservoir. American Journal of Science 304,
839-861.
Canfield, D. E. and Teske, A., 1996. Late Proterozoic rise in atmospheric oxygen concentration inferred from phylogenetic and sulphur-isotope studies. Nature 382, 127-132.
Condon, D., Zhu, M., Bowring, S., Wang, W., Yang, A., and Jin, Y., 2005. U-Pb Ages from the Neoproterozoic Doushantuo Formation, China. Science 308, 95 -98.
Corsetti, F. A. and Kaufman, A. J., 2003. Stratigraphic investigations of carbon isotope anomalies and Neoproterozoic ice ages in Death Valley, California. Geological Society ofAmerica Bulletin 115,
916-932.
Des Marais, D. J., Strauss, H., Summons, R. E., and Hayes, J. M., 1992. Carbon Isotope Evidence for the Stepwise Oxidation of the Proterozoic Environment. Nature 359, 605-609.
Detmers, J., Bruchert, V., Habicht, K. S., and Kuever, J., 2001. Diversity of sulfur isotope fractionations by sulfate-reducing prokaryotes. Applied and Environmental Microbiology 67, 888-894.
Grey, K., 2005. Ediacaran palynology ofAustralia. Association of Australasian Paleontologists. Grotzinger, J. P., Bowring, S. A., Saylor, B. Z., and Kaufman, A. J., 1995. Biostratigraphic and
Geochronological Constraints on Early Animal Evolution. Science 270, 598-604.
Habicht, K. S., Gade, M., Thamdrup, B., Berg, P., and Canfield, D. E., 2002. Calibration of Sulfate Levels in the Archean Ocean. Science 298, 2372-2374.
Holland, H. D., 1984. The chemical evolution of the atmosphere and oceans. Princeton University Press, Princeton, NJ.
Hurtgen, M. T., Arthur, M. A., and Halverson, G. P., 2005. Neoproterozoic sulfur isotopes, the evolution of microbial sulfur species, and the burial efficiency of sulfide as sedimentary pyrite. Geology 33, 41-44.
Hurtgen, M. T., Halverson, G. P., Arthur, M. A., and Hoffman, P. F., 2006. Sulfur cycling in the aftermath of a 635-Ma snowball glaciation: Evidence for a syn-glacial sulfidic deep ocean. Earth and
Planetary Science Letters 245, 551-570.
Johnston, D. T., Wing, B. A., Farquhar, J., Kaufman, A. J., Strauss, H., Lyons, T. W., Kah, L. C., and Canfield, D. E., 2005. Active microbial sulfur disproportionation in the Mesoproterozoic. Science 310, 1477-1479.
Kah, L. C., Lyons, T. W., and Frank, T. D., 2004. Low marine sulphate and protracted oxygenation of the proterozoic biosphere. Nature 431, 834-838.
Knoll, A. H. and Carroll, S. B., 1999. Early animal evolution; emerging views from comparative biology and geology. Science 284, 2129 -2137.
Le Guerroue, E., Allen, P. A., and Cozzi, A., 2006a. Chemostratigraphic and sedimentological framework of the largest negative carbon isotopic excursion in Earth history: The Neoproterozoic Shuram Formation (Nafun Group, Oman). Precambrian Research 146, 68 -92.
Le Guerroue, E., Allen, P. A., Cozzi, A., Etienne, J. L., and Fanning, M., 2006b. 50 million year duration negative carbon isotope excursion in the Ediacaran ocean. Terra Nova 18, 147 -153.
Logan, G. A., Hayes, J. M., Hieshima, G. B., and Summons, R. E., 1995. Terminal Proterozoic Reorganization of Biogeochemical Cycles. Nature 376, 53-56.
Martin, M. W., Grazhdankin, D. V., Bowring, S. A., Evans, D. A. n. D., Fedonkin, M. A., and Kirschvink,
J. L., 2000. Age of Neoproterozoic Bilatarian Body and Trace Fossils, White Sea, Russia:
Implications for Metazoan Evolution. Science 288, 841-845.
McCarron, G., 2000. The sedimentology and chemostratigraphy of the Nafun Group, Huqf Supergroup,Oman. PhD Thesis (Oxford University), 175.
Melezhik, V. A., Fallick, A. E., and Pokrovsky, B. G., 2005. Enigmatic nature of thick sedimentary carbonates depleted in 13C beyond the canonical mantle value: The challenges to our understanding of the terrestrial carbon cycle. Precambrian Research 137, 131-165.
Narbonne, G. M., 2005. The Ediacara Biota: Neoproterozoic Origin of Animals and Their Ecosystems.
Annu. Rev. Earth Planet. Sci. 33, 1 -22.
Rothman, D. H., Hayes, J. M., and Summons, R. E., 2003. Dynamics of the Neoproterozoic carbon cycle.
Proceedings of the National Academy of Sciences of the United States ofAmerica 100, 8124-8129.
Workman, R. K., Grotzinger, J. P., and Hart, S. R., 2002. Constraints on Neoproterozoic ocean chemistry from delta (super 13) C and delta (super 11) B analyses of carbonates from the Witvlei and Nama Groups, Namibia. Geochimica Et Cosmochimica Acta 66, 847.
Acknowledgments
We thank D. Canfield for use of laboratory facilities and discussions, C. Colonero, J. Fong, and S. Studley for laboratory assistance, A. Bradley, D. Finkelstein, G. Love, B. McElroy, A. Maloof, and W. Watters for comments, and T. Lyons and an anonymous
reviewer for suggestions that improved the manuscript. We thank Petroleum
Development Oman (PDO) for access to samples and support for this project, and the the Oman Ministry of Oil and Gas for permission to publish this paper. Support was provided by PDO and the National Aeronautics and Space Administration. J.P.G. and D.A.F. were
supported by the Agouton Institute. L.M.P. was supported by a NASA Astrobiology Institute grant. R.E.S. was supported by an NSF grant.
Appendix A: Supplementary Information
Figure S : Map of the Sultanate of Oman. Neoproterozoic rocks crop out in the Oman Mountains in the north, in the Huqf area along the east-central coast, as well as near Mirbat in the south. Neoproterozoic deposits are also found throughout much of the subsurface in Oman, where they have not been exposed to oxidative weathering and alteration. Samples from this study are from the drill hole Miqrat-1, spanning a depth range from 3200 - 4244 m.
Huaf lithostratigraphy
The Nafun Group varies in composition and facies depending on paleogeographic position (MCCARRON, 2000). The basal Masirah Bay consists of deeper-water black and grey shales that interfinger with post-glacial cap carbonates. These grade upward into siliciclastic shales that shallow upward and interfinger with tidal- and storm-emplaced sandstones and siltstones. The Masirah Bay passes conformably into the peritidal limestones and dolostones of the Khufai Formation which form a prograding shallow-marine ramp succession (MCCARRON, 2000). Khufai carbonates are abruptly overlain by the Shuram Formation. The basal Shuram is comprised of outer shoreface calcareous sandstones and limestones which grade upward into red shales, while the upper Shuram contains interstratified carbonates that become more abundant into the basal Buah Formation. The Buah is a simple shallowing-upward carbonate succession that culminates in shallow subtidal stromatolitic and oolitic grainstone facies.
The Khufai-Shuram contact is at least locally unconformable (LE GUERROUE et al., 2006a) based on field observations and regional seismic data showing incised channels. This interpretation is supported by the locally variable profile of 813 carb across the Khufai-Shuram boundary (LE GUERROUE et al., 2006a), indicating spatially variable erosion/deposition and by the presence of inflection points (Figure la,c-d) or jumps (Figure Ib) in carbon and sulphur isotopes across the contact, suggesting discontinuous deposition. The age of the topmost Khufai is constrained to be younger than -600 - 620 Myr, based on U/Pb ages from detrital zircons (BOWRING et al., 2007; LE GUERROUE et al., 2006b). Based on sequence stratigraphic correlation, we interpret the unconformity to encompass the period of Gaskiers glaciation (-580 Myr (BOWRING et al., 2002)). However, see (LE GUERROUE et al., 2006b) for an alternative view
-that suggests the basal Shuram is - 600 Myr. Our inference suggests the basal Shuram is younger than 580 Myr, consistent with an estimate (BOWRING et al., 2007) of -560 -570 Myr from models of sedimentation rates coupled to U/Pb ages from ash beds in overlying strata and from global chemostratigraphic correlation.
Overlying the Nafun Group is the Ara Group, a series of six carbonate-evaporite cycles (AMTHOR et al., 2003; SCHRODER et al., 2003). The contact between the Buah and overlying Ara Group is marked by a disconformable, karstic surface. Additional ages (AMTHOR et al., 2003; BOWRING et al., 2007) from overlying Ara carbonate units indicate ongoing deposition from -547 through -541 Myr. At the base of the fourth Ara carbonate unit the Ediacaran-Cambrian boundary has been identified (AMTHOR et al., 2003) based on a 7%o negative excursion in
carbonate 613C and the disappearance of Ediacaran Namacalathus and Cloudina fossil assemblages.
Detailed description of observed trends (Figure la-e)
Observation of 61 3
Ccarb provides a reference framework for interpreting other isotope proxies and for global correlations. Above Abu Mahara glacial strata, 613Ccarb rises to -6%o and falls to 0%o just prior to the Masirah Bay-Khufai boundary. 613Carb then rises to +3%o where it plateaus for most of the Khufai, except for a negative excursion to 0%o near the limestone-dolostone transition from deeper to shallower water facies in the mid-Khufai. The uppermost Khufai is marked by 61 3
Ccarb = 2.6%o; whereas the base of the Shuram is characterized by 613
Ccarb = 0.0%o, decreasing to -12.0%o at the nadir of the Shuram excursion. Above this level, 613Ccarb rises gradually to -4.5%o at the Shuram-Buah transition. 613Ccarb rises throughout most of the Buah, hovering briefly around O%o before peaking at 6.5%o in the upper Buah. 613Cca,b decreases to 0%o in the uppermost Buah.
In contrast, 613Corg in the form of total organic carbon (Figure lb) reveals a very different pattern. Above Abu Mahara glacial strata, 61 3Corg = -31.1%o and gradually increases to - -29%0 in the upper Masirah Bay. From the uppermost Masirah Bay there is a decrease in 613Corg to - -33%o in the mid-Khufai, followed by an increase to -31%o at the top Khufai. Beginning in the base of the Shuram, 613Corg increases slightly to -26%o transitioning upward from the interbedded sandstones and limestone to the basal Shuram red shales, an interval over which 613Ccarb plunges from 0 to -12%o and then rises to - -8%o. Throughout the rest of the Shuram, 613Corg gradually decreases in magnitude to - -31%o while 613Ccarb rises to -4%o. The increased scatter in the data through this part of the section may be due to very low TOC levels (Figure S3), characteristic of the majority of the Shuram and Buah formations. In the lower Buah, 513Corg begins to show sympathetic covariation with 613Ccarb in the uppermost Buah (r2 = 0.72).
Examination of 634Sso 4 (Figure 1c, in the form of carbonate-associated-sulphate) reveals significant variability in the basal section, with an increase in 63 4SCAs from 9%o above Abu Mahara glacial strata to 22%o in the lower Masirah Bay. From this point through the upper Khufai, 634SCAS generally follows the same trends as 613Ccarb. There is a 5%o decrease in 63 4SCAS in the upper Masirah Bay coincident with the 6%o negative trend in 613
Ccarb. Following this, 63 4SCAS increases to -21%o at the Masirah Bay-Khufai boundary and remains approximately constant until the limestone-dolostone transition in the Khufai, coincident with the rebound and plateau in 613
Ccarb. From the base of the Khufai dolostone, 634SCAS increases linearly to -29%o at the top Khufai, while 613C rises from 0 to +3. The lowermost Shuram calcareous sandstones are
characterized by 63 4SCAs = 28.0%o. This decreases to - 24%o in the basal red shales as 61 3Ccarb plunges to - -12%o. Here, the covariance with 613Ccarb ends as 634SCAs decreases gradually to
27--21%o in the mid-Buah while 613
Ccarb recovers from the Shuram excursion. The upper Buah is
marked by an increase in 63 4SCAs to -26%o.
Above Abu Mahara glacial strata, 634Spyr (Figure Id) increases from 4%o to 17%o in the mid Masirah Bay. There is a gradual decrease in 634
Spyr to -10%o in the upper Khufai. 634Spyr
increases slightly in the basal Shuram calcareous sandstones and then decreases through the red shales to -22.5%o in the upper Shuram interbedded carbonates. There is an increase in 6 4Spyr to ~
-10%o in the uppermost Shuram and lower Buah, followed by a drop to -25%o in the uppermost Buah.
Examining A634S, the fractionation between coeval sulphate and pyrite, provides a more meaningful way to interpret 634Spyr by eliminating covariation with sulphate 34S. Here we find
A634S increases from less than 1%o at the top of the post-glacial cap carbonate to - 35%o at the top Khufai. The basal Shuram is characterized by A634S = 39%o, which decreases slightly in the lower Shuram and remains relatively constant (35.2 + 4.1%o, n = 49) throughout the duration of the Shuram excursion. As the Shuram excursion ends in the upper Buah, A634S increases to an average of 47%0 (n = 14), with 10 samples having fractionations indicative of BSD.
Evaluatin2 diazenesis:
Evidence for primary 613Ccarb during the Shuram excursion
We examined two geochemical proxies (6180 and Mn/Sr) to assess the likelihood that the 613Ccab signal of the Shuram excursion was primary (Figure S2a-b). Although there is a correlation between 613Ccarb and 180carb for samples during the Shuram excursion (r2 = 0.6), the
range of 6180 values for the samples during the excursion falls within the variability of those before and after the excursion (Figure S2a). This is consistent with either a partial resetting of the 6180 signal (KAUFMAN and KNOLL, 1995; KAUFMAN et al., 1992) (e.g., by meteoric diagenesis) or secular trends (VEIZER et al., 1999) in marine 6180 over the Neoproterozoic. Examination of whole rock Mn/Sr values (Figure S2b) shows that samples that define the Shuram excursion are within the variability of sample values that bound the excursion. In addition, most excursion samples have Mn/Sr < 1, well below the threshold (KAUFMAN and KNOLL, 1995; KAUFMAN et al., 1992) for alteration of primary 613Ccarb. This indicates that meteoric diagenesis was insufficient to significantly reset the Mn/Sr ratio and, therefore, highly unlikely to have altered the primary composition of 613 carb. From these data and from the remarkable uniformity of the Shuram excursion across Oman (inclusive of both surface and subsurface datasets) and other globally correlative sections, we conclude that the 613
Ccarb signal is primary.
Evidence for primary 634SSO4 preserved in Oman
We have examined 634Sso4 versus several indicators of diagenesis (6180carb, Mn/Sr, 613Ccarb, and the concentration of carbonate-associated sulphate [S04] (Figure S2c-f). With the exception of one point (circled in red), there appears to be no indication of diagenetic alteration in our 834Sso4 data. This point has been excluded from Figure 1 to avoid re-scaling the x-axis; however, it is included in supplementary table S1. The anomalous point comes from the Marinoan-equivalent cap carbonate and may reflect the unusual depositional environment rather than post-depositional alteration. Several samples have anomalously high [SO4] (> 2000ppm) although well within the range reported from modem carbonates. Of these, only the one sample
-28-indicated as possibly altered has a A634S that is small enough such that post-depositional pyrite
oxidation might have contributed to the measured [SO4].
Am -10 -5 613 * *. . %f~ C-1,_
4
0 5 10 carbm -10 -5 0 13 carb 10 15 20 34CA 6S CAS 10 25 30 10 15 s34S 20 25 30 CAS 5 10 15 20 25 30 r.." OC)
15000 1000C 500s 8 SCAS8
SCASFigure S2: Evaluation of 613Ccab and 834SSO4 diagenesis. Samples from the Shuram excursion
are in black, while samples bounding it are in blue. a-b) Evaluation of diagenesis of the 61 3CCab signal. a) Cross plot of 813Ccarb VS. 6180c b. b) Cross plot of 613Ccarb VS. whole-rock Mn/Sr. c-f) Evaluation of diagenetic alteration of 634S04 data. Sample encircled in dashed red line is likely to have been diagenetically altered. c) Cross plot of 834Sso4 vs. 6180carb. b) Cross plot of 834Sso4 vs. whole-rock Mn/Sr. e) Cross plot of 834Ss4 VS. 613Ccarb. f) Cross plot of 8 34Sso4 VS.
concentration of carbonate-associated sulphate [SO4] (ppm). See above for discussion and Table S1 for data.
SuDuortine material for oxidation during stage II (Shuram excursion)
Additional evidence for stage II oxidation is found in the -8%o decrease in 634Sso4 across the Shuram excursion, while A834S remains nearly constant. This indicates sulphide oxidation
29 -10 15 20 25 O (o -1( b °.0 • c • *° 0 tO 5 10 -10 1- 5 d Iv' 5 L_ O e ~~ ., .1. f 3 : " em ee ~· Sef· e · '..b.~ *0* 2 * jI C V. · t · ** ** ** * * ** ~. Il~t~r~·"·· 5 10 15 20 25 30 . . -1 l- b 0 -15 '~~ · · · I · ZC V) r L
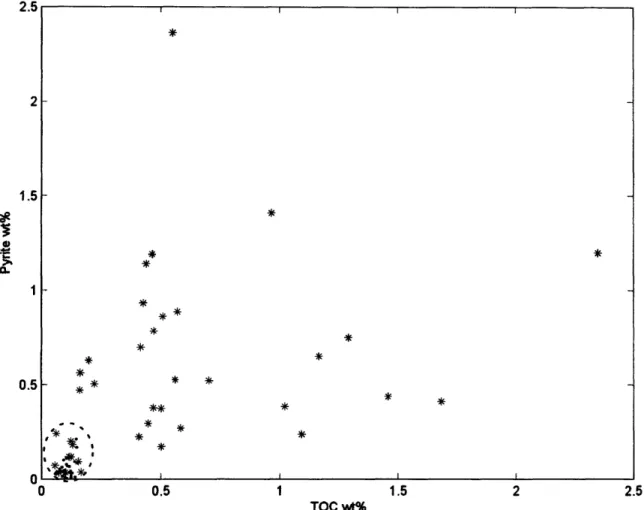
accompanying the oxidation of DOC during the Shuram excursion. Further support for a more oxidizing environment during deposition of stage II strata comes from pyrite and total organic carbon (TOC) abundances (Figure S3): the Masirah Bay and Khufai formations have relatively abundant pyrite (0.78 ± 0.58 wt%/o) and TOC (0.70 ± 0.49 wt%), whereas the Shuram and Buah formations have significantly less pyrite (0.064 ± 0.055 wt%) and TOC (0.100 ± 0.030 wt%). It should be noted that pre- (Masirah Bay/Khufai) and post-excursion (Shuram-Buah) data cluster into distinct groupings independent of lithology (siliciclastic vs. carbonate). Both the Masirah Bay-Khufai and Shuram-Buah formations represent upward shallowing sequences of siliciclastic-carbonate packages that are sedimentologically similar; because they plot so distinctly (Figure S3), it suggests that they were formed under different redox conditions, with Shuram-Buah deposition occurring in a significantly more oxidizing environment.
1.5
TOC wt%
Figure S3: Abundance of pyrite and TOC by formation. Masirah Bay (blue) and Khufai shales and carbonates (black), deposited before the Shuram excursion, define a high pyrite-high TOC realm, whereas all the Shuram (red) and Buah (magenta) shales and carbonates, deposited during
and after the Shuram excursion, are confined to a low pyrite-low TOC area (dashed circle). See text for discussion and Table S1 for data.
Construction of g1 3Ccarb correlation and associated Daleobioloaical indices (Figure 2)
- 30-* * * *a * ÷ '" TY•`, -•C ....
I
I
I
I
This figure correlates various globally-distributed Ediacaran-age strata that contain the Shuram excursion. Because of variability in sediment accumulation rates and the duration and magnitude of periods of non-deposition and/or erosion, the geometry of the 813C b curve varies between sections (MYROW and GROTZINGER, 2000). Nevertheless, the major components of the curve, particularly the large magnitude of the negative 813Carb, are present in each section, and help build a composite model. Such composite models provide a useful means to visualize the degree to which globally disparate sections record the same chemostratigraphic signal. The figure was constructed using 813Ccarb from Oman (this study; (AMTHOR et al., 2003)) and U/Pb ages from Oman (AMTHOR et al., 2003) and those from China (CONDON et al., 2005) and Namibia (GROTZINGER et al., 1995) that have been previously correlated to the Oman 813Ccarb
chemostratigraphy. The Oman 813
Ccarb record was then fit linearly between successive geochronological tie-points to construct a time line for the section, incorporating a reasonable estimate (BOWRING et al., 2007) for the age of the Khufai-Shuram unconformity. Next, the
813Ccarb data from Namibia and China, possessing multiple geochronological constraints were added and aligned to the Omani record by fixing 813Ccab maxima and minima (e.g., nadir of the Shuram excursion, Buah positive, etc.) with a linear stretch between tie-points and geochronologic data. Data from geochronologically unconstrained sections (Australia, USA) were overlain on this record using a linear stretch between tie-points (813 carb maxima and minima). The absence of high-resolution age constraints for the interval of 630 - 555 Myr is problematic. Therefore, while we believe the shape of the curve will remain accurate, the scaling of this portion of the plot is approximate and the details of timing are likely to change as more dates become available. 613Crb data from: Oman (this study; (AMTHOR et al., 2003)); China (CONDON et al., 2005; JIANG et al., 2003); Australia (CALVER, 1995; CALVER, 2000); Namibia (GROTZINGER et al., 1995; SAYLOR et al., 1995); and Death Valley (CORSETTI and KAUFMAN,
2003). U/Pb zircon ages from Oman (AMTHOR et al., 2003), Namibia(GROTZINGER et al., 1995;
HOFFMANN et al., 2004), and China (CONDON et al., 2005). The range for acanthomorph acritarchs (GREY, 2005; GREY et al., 2003) is derived from several Australian sections and the upper Duoshantuo Formation, China. Additional work (MOCZYDLOWSKA, 2005; VIDAL and
MOCZYDLOWSKA, 1995; XIAo et al., 2004) (indicated by the dashed line) shows other acritarch
species evolved during stage I oxidation, but how these are correlated with the ECAP fauna (GREY, 2005) remains unclear. The range (BOWRING et al., 2002; NARBONNE, 2005) for sessile and segmented fronds is for strata in Newfoundland (Mistaken Point) above the Gaskiers glaciation (BOWRING et al., 2002). The range for small metazoa and bilaterian embryos from the Duoshantuo Formation, China summarized in (CONDON et al., 2005). The range (MARTIN et al., 2000) for macroscopic mobile bilaterian is obtained from strata from the White Sea, while the range (CONDON et al., 2005) for macroscopic multicellular algae is taken from the upper Duoshantuo Formation. Finally, the range of weakly calcified metazoa is a composite observation based on both Oman (AMTHOR et al., 2003) and Namibia ((GROTZINGER et al.,
1995).
Methods
Sample preparation
All samples examined in this study are drill cuttings sampled every 2m from the Miqrat-l drill hole in the South Oman Salt Basin (Figure Sl). Samples were soaked in distilled de-ionized (DI) water and then rinsed 3x in DI to remove any water soluble drilling contamination. Next, samples were rinsed 3x in methanol, dichloromethane, and hexane to remove any soluble organic
-contamination. Samples were powdered using a SPEX 8510 Shatterbox with an alumina ceramic container.
Carbon extraction and isotopic analysis
Carbonate carbon and oxygen isotopes were measured according to the methods described by Ostermann & Curry(2000). Organic carbon isotopes were analyzed as samples of total organic carbon (TOC). For TOC analyses, powdered samples were acidified in 6N HCl for 24 hours to remove carbonate minerals, filtered, rinsed with DI, dried, and the residuum was loaded into tin cups for isotopic analysis. Samples were flash combusted at 10600C in a Carlo Erba NA1500 Elemental Analyser fitted with an AS200 autosampler. The resulting CO2 gas was analyzed by continuous flow using a Delta plus XP Isotope Ratio Mass Spectrometer. Carbon isotopes are reported as 813C = (Rstandard/Rsample - 1) * 1000, where R = the ratio of 13C/1
2C, in units of per mil (%o) relative to the V-PDB standard. Calibration of 613Corg was done by comparison with international standards (IAEA-CH-6, NBS-22) and in-house references ("Acetanilide" and "Penn State Kerogen") interspersed with the sample analyses.
Sulphur extraction and isotopic analysis
Powdered samples were rinsed with DI to remove soluble sulphates (e.g., from sulphide oxidation) and then soaked for 24 hours in DI to remove water-soluble sulphate minerals (e.g., anhydrite). Sulphate 834S was examined in the form of carbonate-associated sulphate (BURDETT et al., 1989; GELLATLY and LYONS, 2005; HURTGEN et al., 2002; KAMPSCHULTE et al., 2001; KAMPSCHULTE and STRAUSS, 2004; STAUDT et al., 1994) (CAS), also known as structurally-substituted sulphate, which is sulphate trapped in the carbonate mineral matrix, either through substitution for the carbonate ion or in crystal defects. CAS was obtained by dissolving the powdered sample in 6N HCI for 2 hours at -600C under nitrogen gas or in 6N HC1 for 24 hours at room temperature. No 834S offset was observed between these methods. Following dissolution, samples were filtered to remove insoluble residues and an excess of 1 M BaC12 solution was added to the solute to precipitate BaSO4. The insoluble residue was kept for pyrite analysis.
Pyrite was extracted as chromium-reducible sulphur (CANFIELD et al., 1986). Pyrite extraction was performed under nitrogen gas by the addition of 6N HCI and 0.4M reduced chromium chloride solution. The reaction was allowed to proceed for 2 hours with the sulphide collected as silver sulphide after bubbling through a sodium citrate buffer (pH 4) and into a silver nitrate (1 M) trap. Rinsed, filtered, and dried BaSO4 and Ag2S precipitates were then combined with an excess of V20s and analyzed for S-isotope composition at Indiana University on a Finnigan MAT 252 gas source mass spectrometer fitted with a peripheral elemental analyzer (EA) for on-line sample combustion(STUDLEY et al., 2002). Sulphur isotope compositions are expressed in standard 8-notation as permil (%o) deviations from V-CDT, with analytical error of <0.07%o, calculated from replicate analyses of samples and laboratory standards. Samples were calibrated using the international standards NBS-127 (20.3%o) and S3 (-31.5%o), as well as four internal standards: silver sulphide (ERE-Ag2S: -4.3%o), chalcopyrite (EMR-CP: 0.9%o), and two barium sulfate standards (BB4-18: 39.5%o; PQB: 38.0%o).
Supplementary References