HAL Id: hal-01863384
https://hal-univ-rennes1.archives-ouvertes.fr/hal-01863384
Submitted on 5 Oct 2018
HAL is a multi-disciplinary open access
archive for the deposit and dissemination of
sci-entific research documents, whether they are
pub-lished or not. The documents may come from
teaching and research institutions in France or
abroad, or from public or private research centers.
L’archive ouverte pluridisciplinaire HAL, est
destinée au dépôt et à la diffusion de documents
scientifiques de niveau recherche, publiés ou non,
émanant des établissements d’enseignement et de
recherche français ou étrangers, des laboratoires
publics ou privés.
Expression in Tonsil-Derived Human Stromal Cells
Aliaksei S Vasilevich, Frédéric Mourcin, Anouk Mentink, Frits Hulshof, Nick
Beijer, Yiping Zhao, Marloes Levers, Bernke Papenburg, Shantanu Singh,
Anne E Carpenter, et al.
To cite this version:
Aliaksei S Vasilevich, Frédéric Mourcin, Anouk Mentink, Frits Hulshof, Nick Beijer, et al.. Designed
Surface Topographies Control ICAM-1 Expression in Tonsil-Derived Human Stromal Cells. Frontiers
in Bioengineering and Biotechnology, Frontiers, 2018, 6, pp.87. �10.3389/fbioe.2018.00087�.
�hal-01863384�
Edited by: Nihal Engin Vrana, Protip Medical, France Reviewed by: Tim Woodfield, University of Otago, New Zealand Mark William Tibbitt, ETH Zürich, Switzerland *Correspondence: Jan de Boer [email protected] Specialty section: This article was submitted to Biomaterials, a section of the journal Frontiers in Bioengineering and Biotechnology Received: 18 February 2018 Accepted: 11 June 2018 Published: 28 June 2018 Citation: Vasilevich AS, Mourcin F, Mentink A, Hulshof F, Beijer N, Zhao Y, Levers M, Papenburg B, Singh S, Carpenter AE, Stamatialis D, van Blitterswijk C, Tarte K and de Boer J (2018) Designed Surface Topographies Control ICAM-1 Expression in Tonsil-Derived Human Stromal Cells. Front. Bioeng. Biotechnol. 6:87. doi: 10.3389/fbioe.2018.00087
Designed Surface Topographies
Control ICAM-1 Expression in
Tonsil-Derived Human Stromal Cells
Aliaksei S. Vasilevich1, Frédéric Mourcin2, Anouk Mentink1, Frits Hulshof3, Nick Beijer1, Yiping Zhao4, Marloes Levers4, Bernke Papenburg4, Shantanu Singh5,
Anne E. Carpenter5, Dimitrios Stamatialis3, Clemens van Blitterswijk6, Karin Tarte2and Jan de Boer1*
1Laboratory for Cell Biology-Inspired Tissue Engineering, MERLN Institute for Technology-Inspired Regenerative Medicine,
Maastricht University, Maastricht, Netherlands,2Institut National de la Santé et de la Recherche Médicale, U917, Equipe
Labelisée Ligue Contre le Cancer, Université Rennes, I’Etablissement Français du Sang Bretagne, Rennes, France,
3Department of Biomaterials Science and Technology, MIRA Institute for Biomedical Technology and Technical Medicine,
University of Twente, Enschede, Netherlands,4Materiomics BV, Maastricht, Netherlands,5Imaging Platform, Broad Institute
of MIT and Harvard, Cambridge, MA, United States,6Department of Complex Tissue Regeneration, MERLN Institute for
Technology-Inspired Regenerative Medicine, Maastricht University, Maastricht, Netherlands
Fibroblastic reticular cells (FRCs), the T-cell zone stromal cell subtype in the lymph nodes, create a scaffold for adhesion and migration of immune cells, thus allowing them to communicate. Although known to be important for the initiation of immune responses, studies about FRCs and their interactions have been impeded because FRCs are limited in availability and lose their function upon culture expansion. To circumvent these limitations, stromal cell precursors can be mechanotranduced to form mature FRCs. Here, we used a library of designed surface topographies to trigger FRC differentiation from tonsil-derived stromal cells (TSCs). Undifferentiated TSCs were seeded on a TopoChip containing 2176 different topographies in culture medium without differentiation factors, then monitored cell morphology and the levels of ICAM-1, a marker of FRC differentiation. We identified 112 and 72 surfaces that upregulated and downregulated, respectively, ICAM-1 expression. By monitoring cell morphology, and expression of the FRC differentiation marker ICAM-1 via image analysis and machine learning, we discovered correlations between ICAM-1 expression, cell shape and design of surface topographies and confirmed our findings by using flow cytometry. Our findings confirmed that TSCs are mechano-responsive cells and identified particular topographies that can be used to improve FRC differentiation protocols.
Keywords: mechanobiology, surface topography, fibroblastic reticular cells, lymph node, ICAM-1
INTRODUCTION
Successful engineering of an artificial lymph node would enable in vitro investigation of the immune system, allow toxicological tests on a system closely mimicking the in vivo situation, and, ultimately, clinical transplantation (Cupedo et al., 2012). The lymph nodes are secondary lymphoid organs that control the immune system: they maintain hematopoietic cell functioning by serving as a tissue scaffold and provide pro-survival signals. They also facilitate the formation of
antigen-presenting sites, which promotes the immune response to antigens. Lymph nodes consist of hematopoietic and non-hematopoietic cells that are closely interconnected. Moreover, they harbor unique microenvironments, where either T cells or B cells are located and become activated (Crivellato et al., 2004; Cupedo et al., 2012). Stromal cells of lymph nodes are difficult to purify and culture due to their scarcity (<1% in secondary lymphoid organs (SLOs), strong interaction with extracellular matrix compounds (Fletcher et al., 2011), and rapid loss of functionality when removed from their native environment (Zeng et al., 2011). The culture of primary lymph node stromal cells has been successfully accomplished by only few groups (Katakai et al., 2004; Fletcher et al., 2011; Onder et al., 2012). The most abundant stromal cell type in lymph nodes is the fibroblastic reticular cell (FRC), which builds a three-dimensional network. (Katakai et al., 2004; Link et al., 2007). One of their key roles is to secrete cytokines such as CCL19/21 that specifically attract naïve T, naïve B, and mature dendritic cells, and they further act as a scaffold for anchoring and navigating cells, allowing them to interact and initiate an immune response (Turley et al., 2010; Malhotra et al., 2013).
An alternative to studying primary FRCs is to induce FRC differentiation from mesenchymal progenitor cells, derived from tonsil. We and others have shown that human SLOs contain bona-fide mesenchymal stromal cells (MSCs) that can be robustly differentiated to FRC in response to a combination of tumor necrosis factor-α (TNF-α) and lymphotoxin-α1β2 (LT-α1β2), the two main factors involved in differentiation and maintenance of SLO (Ame-Thomas et al., 2007; Fletcher et al., 2015; Bar-Ephraim et al., 2016). We reported that exposure of tonsil-derived stromal cells (TSCs, a polyclonal cell type that can be cultured from fresh tonsil tissue) to Tumor Necrosis Factor-α (TNF-α) and Lymphotoxin-α1β2 (LT-α1β2) leads to expression of FRC specific markers in vitro. These markers include adhesion molecules
CXCL12 chemokines (Ame-Thomas et al., 2007). Moreover, it was shown that ICAM-1 together with VCAM-1 expression reflects the differentiation process from stromal progenitors to FRC (Bénézech et al., 2012). Human tonsils can be obtained after a routine tonsillectomy. Tonsil stromal cells can be isolated by digestion of tonsils in collagenase and DNAse, centrifugation on a discontinuous Percoll gradient and collection of plastic- adherent cells. During expansion, cells lose their phenotype and thus it is not possible to track back their anatomical location and function in the tonsil, however, it was shown that these cells express mesenchymal markers CD90, CD73, CD105 and CXCL12 and exhibit a spindle-shaped fibroblastic morphology (Ame-Thomas et al., 2007). Moreover, the bone marrow and the adipose tissue can be considerate as alternative sources of stromal cells. BM-MSCs (Bone Marrow Mesenchymal Stromal Cells) and ASCs (Adipose Stromal Cells) are mostly used for regenerative medicine (Gentile et al., 2012) or for their immunosuppressive properties (Uccelli et al., 2008). While MSCs derived from bone marrow (BM-MSCs) can also be used for FRC differentiation, these cells are more sensitive to replicative senescence (Tarte et al., 2010) that reduces their immunological properties
(Loisel et al., 2017). Adipose precursors from adipose tissue can differentiate into a variety of lymph node stromal cells (Bénézech et al., 2012). We demonstrated that adipose stromal cells (ASCs), like BM-MSCs, were able to acquire a FRC-like phenotype after TNF-α/LT-α1β2 stimulation (Pandey et al., 2017).
All three stromal cell sources—TSCs, ASCs and BM-MSCs—can be routinely obtained and used for achieving the FRC-like phenotype. However, it is known that the anatomical source of stromal cells can predefine their differentiation capabilities: for example, BM-MSCs overall yield better osteogenesis compared to ASCs (Liao and Chen, 2014), which in turn have better adipogenic differentiation ability compared to BM-MSCs in vitro (Tsuji et al., 2014). Taking this into account, we have chosen TSCs as the source for FRC differentiation for these studies. Cytokine-induced FRC differentiation can be complemented with biomaterials manipulation. And potentially allows simultaneous co-culturing of multiple cell types which all required their own differentiation factors and may not be compatible with each other. It has been widely recognized that material properties such as chemistry, stiffness, and surface topography affect the biological processes of cells that grow on them (Guvendiren and Burdick, 2013; Luong-Van et al., 2013; Janson and Putnam, 2015). Interestingly, recent studies show that interstitial flow causes mechano-induced FRC differentiation of cancer-associated fibroblasts and subsequent modulation of T cell differentiation (Swartz and Lund, 2012). This finding suggests that mechanotransduction can be used as a tool to induce FRC differentiation.
One of the approaches to induce mechanical loading on cells is to introduce microtopography on the surface on which the cells are growing. Topographical cues have been repeatedly shown to dramatically influence cell behavior and phenotype (Unadkat et al., 2011; Kolind et al., 2012; Wong et al., 2014). For instance, we discovered surfaces with topographical structures were able to maintain Oct4 expression, support proliferation and cell-cell adhesion of human-induced pluripotent stem cells without added growth factors (Reimer et al., 2016). Furthermore, we have demonstrated that surface topographies exert a mitogenic effect on BM-MSCs (Unadkat et al., 2011) and have profound effects on cell shapes (Hulsman et al., 2015). Recently, we have shown that some topographies increase mineralization in BM-MSCs and improve bone bonding in vivo (Hulshof et al., 2017). The advantages of this approach are that topographies can be designed in silico and produced on virtually any surface, from culture plates to medical devices, using micro-fabrication technologies (Zhao et al., 2013; Ryan et al., 2015; Sackmann et al., 2015).
To study systematically the effect of topography on TSCs differentiation, we employed the TopoChip, a microtopography screening platform developed in our laboratory (Unadkat et al., 2011). The TopoChip enables the assessment of cell response to 2176 unique topographies in a single high-throughput slide. Topographical features were randomly selected from the in silico library of more than 150 million topographies, which
were designed using an algorithm that generates patterns based on three simple geometric elements – circles, triangles, and rectangles (Supplementary Figure 1).
We cultured human TSCs on the TopoChip platform, and evaluated, by high-content imaging, cellular response, cell morphology and the expression of the phenotypic marker ICAM-1. We identify topographical patterns that modulate ICAM-1 expression in TSCs, complementing differentiation into FRC by chemical inducers of differentiation.
MATERIALS AND METHODS
Cell Culture
Stromal cells were obtained from human tonsils collected from children undergoing routine tonsillectomy, after informed consent as described previously (Ame-Thomas et al., 2007). Cells were cultured in αMEM media supplemented with 10% FBS at 37◦
C in a humid atmosphere with 5% CO2 unless stated
differently. For induction of FRC phenotype, cells were treated with TNF-α (10 ng/mL) and LT-α1β2 (100 ng/mL; R&D Systems, Abingdon, United Kingdom). On TopoChips, cells were seeded at a density of 10,000 cells/cm2, using a seeding device (Unadkat et al., 2013) and cultured for 48 h (Supplementary Figure 2).
Adipogenesis
To induce adipogenesis, cells were cultured for 3 weeks in adipogenic media (DMEM (Gibco, 41-965-062), 100 U/ml penicillin +100 mg/ml streptomycin (Gibco, 15140-122), 10% fetal bovine serum, 0.2 mM Indomethacin (Sigma, 57413), 0.5 mM IBMX (Sigma, I5879), 10−6 M dexamethasone (Sigma,
D8893), 10 ug/ml insulin (human, Sigma, I9278). Cells were seeded at a density of 15,000 cells/cm2; media was refreshed twice per week. To visualize lipid formation, cells were stained with Oil Red O as described before (De Boer et al., 2004). Briefly, cells were fixed with 10% formalin for 30 min at room temperature, rinsed with a water and washed with 60 % isopropanol. The sample was stained for 5 min in freshly filtered Oil Red O solution (stock: 500 mg Oil Red O (Sigma, O0625), 99 ml isopropanol, 1 ml water; stain: 15 ml stock + 10 ml water).
Oil Red O staining was quantified by extraction with 1 ml of 4% Igepal (Sigma, 56741) in isopropanol for 15 min by shaking at room temperature. Absorbance was measured at 540 nm. Mineralization
To induce mineralization, cells were cultured for 4 weeks in mineralization media (α-MEM (Gibco, 22-571-038), 10% fetal bovine serum (Sigma), 2 mM L-glutamine (Gibco, 25030), 0.2 mM ascorbic acid (Sigma, A8960), 100 U/ml
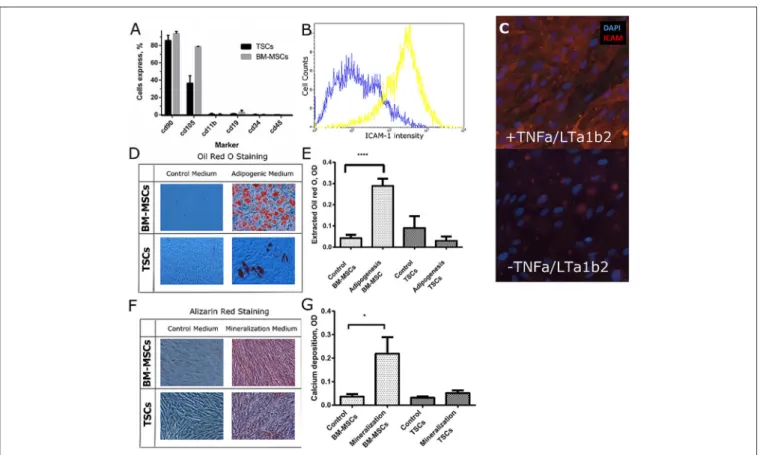
FIGURE 1 | Characterization of TSCs in comparison with BM-MSCs. (A) BM-MSCs and TSCs were screened on a panel of mesenchymal markers. (B,C) TSCs were cultured with and without TNF-α and LT-α1β2 for 48 h. ICAM-1 expression was assessed by FACS analysis (B), and by immunofluorescent staining (C). (D) BM-MSCs and TSCs were cultured in adipogenic medium for 3 weeks; lipids were stained with oil red O. (E) Lipid quantification was performed by lysis of stained lipids with Oil red O in a mixture of isopropanol and Igepal. (F) BM-MSCs and TSCs were cultured in osteogenic medium for 4 weeks; deposited calcium was stained with Alizarin red. (G) Calcium deposition was quantified using a calcium assay kit. *Indicates significant difference with a p < 0.05. ****Indicates significant difference with a p < 0.0001.
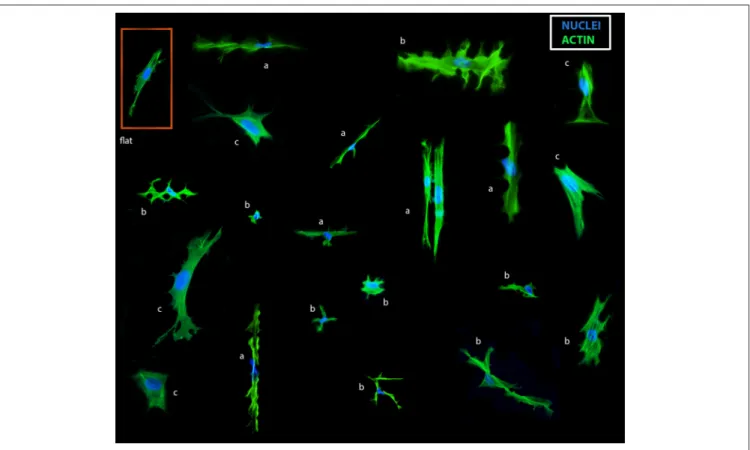
FIGURE 2 | Collage of TSC shapes on the TopoChip. TSCs were cultured for 48 h on a TopoChip in basic media and images of cells on different surfaces are displayed. Actin (green) was stained with phalloidin, DNA (blue) was stained with DAPI: cells in-between pillars: (a) extremely elongated cells, (b) cells with multiple lobes. Cells on top of pillars: (c) large cells.
penicillin + 100 mg/ml streptomycin (Gibco, 15140-122), 10−8 M dexamethasone (Sigma, D8893) plus 0.01 M β-glycerol phosphate (Sigma, 50020). Media was changed twice per week. To visualize mineral formation, samples were stained with Alizarin Red. Cells were fixed with neutral buffered formalin (10%) for 30 min, rinsed with water, and Alizarin Red was added for 45 min. Calcium deposition was quantified using a Calcium Assay Kit (Gibco, 10010-056) as described in the manual.
Staining and Imaging
Cells were fixed with 4% paraformaldehyde for 10 min; afterwards, samples were permeabilized with 0.5% Tween-20 for 20 min with following blocking step in 5% bovine serum albumin (BSA; Sigma) at room temperature for 30 min. Samples were incubated with primary antibodies against ICAM-1 (Abcam, ab53013) overnight at 4◦
C. Labeling with secondary antibodies conjugated to fluorochrome Alexa 594 and phalloidin conjugated to fluorochrome Alexa 488 was performed for 1 h at room temperature, followed by 10-min incubation with DAPI. Imaging was acquired on a Hamamatsu Nanozoomer Slide Scanner II.
Image and Data Analysis
Open source software Cell Profiler (CP) was used for the image analysis (Carpenter et al., 2006). In order to perform automated image analysis in CP, a robust pipeline able to recognize different
cell features was built. Data analysis was performed using R, a programming language and software environment for statistical computing and graphics. Potential miss segmentation of cells was detected based on cell area and perimeter. Cells with cell perimeter and area that exceeded 1.5 quantiles from the median among all replicas for a particular surface were excluded from further analysis.
ICAM-1–positive or –negative cells were identified based on a threshold value. The threshold value was determined as the intersection of ICAM-1 cells median intensities distributions of positive and negative controls (Figure 4B) and corresponded to the 93rd percentile of all ICAM-1 median cell intensities in the negative control (Figure 4B). The threshold value was determined for each TopoChip replica separately and equalled the 93rd percentile of all ICAM-1 median intensities per replica. This adaptive threshold strategy allowed us to take a variation of median intensities between TopoChip replicas into account (Supplementary Figure 5).
To evaluate the correlation between ICAM-1 expression and surface design parameters, we trained a machine-learning model with 10-fold cross-validation with 75% of the data by employing a random forest classification algorithm. We analyzed design parameters of 72 low-scoring units and 112 high-scoring units that had a significant difference in frequency of ICAM-1–positive cells. The accuracy of the obtained model was assessed on a
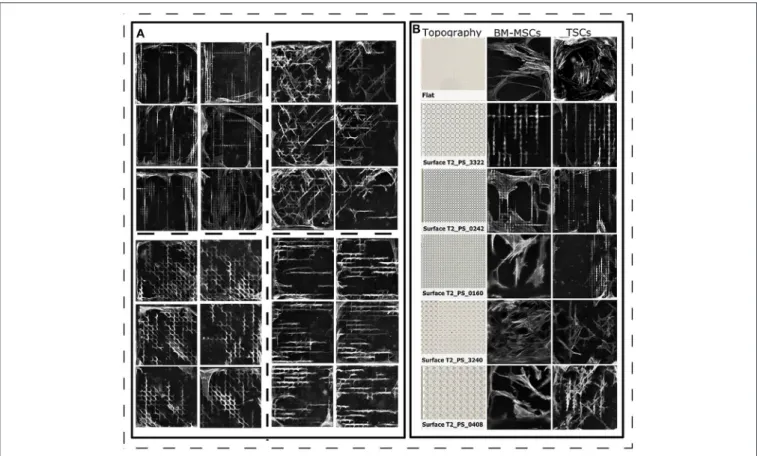
FIGURE 3 | Cell morphology of TSCs on polystyrene surfaces. (A) Diverse cell shapes on the TopoChip, that are highly reproducible within replicas (close located images). Actin staining is in gray. TSCs cells were cultured for 2 days in basic media. (B) Comparison of BM-MSC and TSC shapes on topographies with a different design. Actin staining is in gray. BM-MSCs were cultured in basic media for 5 days on titanium-coated topographies. TSCs cells were cultured for 2 days in basic media on polystyrene topographies.
held-out data set that was not used for model training (25% of the data). To ensure that the model was robust, we performed model training 100 times with random splitting of the data in training and testing sets. Models were trained with 10-fold cross-validation in the “caret” package (Kuhn, 2008).
Flow Cytometry
BM-MSCs and TSCs were characterized by flow cytometry as described previously (Mentink et al., 2013). Briefly, after trypsinization, cells were incubated for 30 min in blocking buffer (5% BSA (Sigma) in PBS), followed by incubation for 30 min with primary antibodies (1:50 dilution) or with an isotype control antibody. Cells were washed 3 times and incubated with secondary antibodies (1:100 dilution) for 30 min, followed by 2 times washing. To characterize surface markers, we used the following antibodies CD105, CD90, CD11b, CD19, CD45 (R&D Systems), and CD34 (Abcam). Expression levels were analyzed on a FACS Calibur (Becton Dickinson Immunocytometry Systems, Mountain View, CA).
For the validation on enlarged surfaces, cells were stained using the following monoclonal antibodies (mAbs): CD54 PE (Clone 84H10, Beckman Coulter) and Podoplanin/gp38 PerCP-efluor710 (clone NZ-1.3, Affymetrix). Appropriate isotype-matched mAbs were used as negative controls. Cells were
analyzed using a Gallios (Beckman Coulter) flow cytometer and Kaluza 1.2 software (Beckman Coulter).
Quantitative RT-PCR
RNA was extracted using the Nucleospin RNA XS kit (Macherey-Nagel) and cDNA was generated using Superscript II reverse transcriptase and random hexamers (Life Technologies). For quantitative RT-PCR, assay-on-demand primers and probes, and TaqMan Universal Master Mix from Applied Biosystems (Life Technologies) were used. Gene expression was measured using StepOnePlus (Life Technologies) based on the 1Ct calculation
method. PUM1 was used as an internal standard gene. For each sample, the Ct value for the gene of interest was determined,
normalized to its respective value for PUM1, and compared to the value obtained with a flat surface.
TopoChip and Fabrication of Enlarged
Surfaces
The TopoChip was designed by selecting 2176 algorithm-generated topographies from an in-silico library and fabricated with the unique topographies in a 66 × 66 array of 300 × 300 µm wells, each known as a TopoUnit. Each 2 × 2 cm TopoChip includes duplicates of all 2176 unique topographies as well as 4 unpatterned TopoUnits (Unadkat et al., 2011).
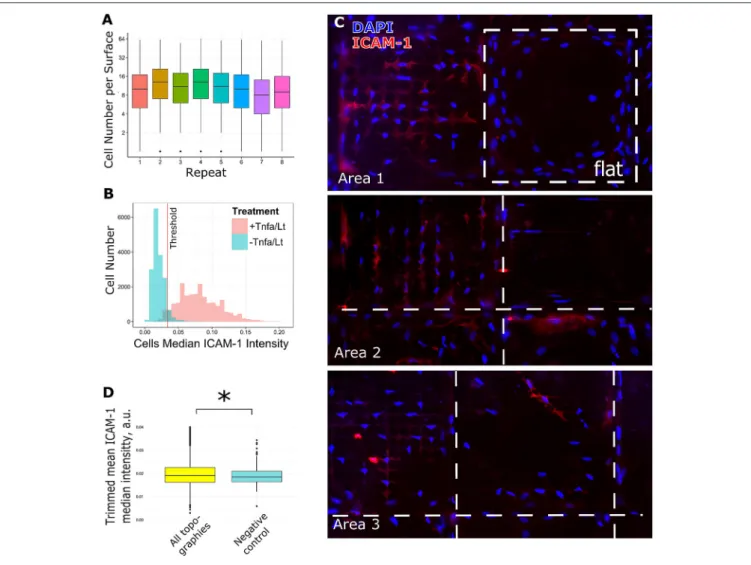
FIGURE 4 | Analysis of screening data and selection of hits. TSCs cells were cultured on 8 Topochips in basic media for 48 h. (A) Distribution of cell number per TopoUnit among all replicas. Cell numbers were counted by DAPI staining. (B) TSCs cells were cultured with or without TNF-α and LT-α1β2 on flat polystyrene for 48 h. The difference in ICAM-1 expression in samples treated and untreated with TNF-α and LT-α1β2., positive and negative control correspondingly. The threshold for identification of ICAM-1 positive vs. negative cells is shown as a red line. (C) The difference in ICAM-1 expression in cells, shown on random areas of the Topochip. DNA (blue) was stained with DAPI, ICAM-1 (red) was stained using an antibody against ICAM-1. Dashed white line shows borders between different topographies. (D) Median expression of ICAM-1 in cells on topographies was higher than in negative control and significantly different with a p-value less than 0.01 using a Wilcoxon rank sum test. *indicates significant difference with a p-value < 0.01.
Both the TopoChips and enlarged surface areas of hit topographies were prepared by hot embossing of (poly)styrene (PS) films (Goodfellow) (Zhao et al., 2013). Briefly, standard photolithography and deep reactive etching were used to produce the inverse structures of the topographies on a silicon wafer. The silicon master mold was then used to make a positive mold in poly(dimethylsiloxane) (PDMS). Subsequently, a second negative mold in OrmoStamp hybrid polymer (micro resist technology Gmbh) was obtained from the PDMS mold. This mold serves as the template for hot embossing (10 bar at 140◦
C for 5 min) the TopoChips and enlarged topographically enhanced surface areas in 190-µm-thick PS films. Prior to cell culture, the topographically enhanced PS films were O2-plasma treated to
increase protein attachment to the substrate surface in order to increase cell attachment.
Statistical Analyses Ad Data Visualization
Statistical analysis was performed in R ver. 3.2.5, graphs were generated in R package ggplot2 (Wickham, 2009) or in Graph Pad version 6.0. Unless stated differently, statistical analysis was performed with Student t-test, with a significance threshold of p < 0.05.
RESULTS
Characterization of TSCs
We isolated TSCs from a human tonsil and characterized surface marker expression and their response to a panel of differentiation media. BM-MSCs were used as a reference cell type (Figure 1A). Flow cytometry indicated that 37% of TSCs, compared to 79% of BM-MSCs, expressed the
CD105 mesenchymal marker (Ame-Thomas et al., 2007), and the mesenchymal marker CD90 was highly expressed in both TSCs and BM-MSCs. Neither TSCs nor BM-MSCs expressed markers indicative of macrophages (CD11b), B-cells (CD19), hematopoietic stem B-cells (CD34), or leukocytes (CD45).
To assess if TSCs cells can differentiate into FRCs, we cultured them for 48 h in media containing TNF-α and LT-α1β2. We used ICAM-1 as a phenotypic marker associated with FRC differentiation, which was previously shown to correlate with induction of FRC-like phenotype in TSCs (Ame-Thomas et al., 2007). We observed upregulation of ICAM-1 by flow cytometry (Figure 1B). Moreover, we were able to capture the difference in ICAM-1 expression clearly by immunofluorescence imaging (Figure 1C), which is essential for image-based screening assays (Bray and Carpenter, 2004).
To investigate multipotency of TSCs, we exposed them to adipogenic media and mineralization media. Following exposure to adipogenic media for 3 weeks, we observed most BM-MSCs with abundant lipid droplet formation (Figure 1D) but only few TSCs with lipids (Figures 1D,E). Upon exposure to mineralization medium for 4 weeks, mineralization was clearly observed in BM-MSCs but only occasionally detected minerals in TSCs (Figure 1F). As expected, the amount of deposited calcium in BM-MSCs treated with mineralization media was higher than in the untreated condition, while calcium was not significantly increased in TSCs (Figure 1G). These results demonstrate that the osteogenic and adipogenic differentiation capacity of TSCs was low compared to that of BM-MSCs.
TSCs Respond to Surface Topography
To evaluate the response of TSCs to surface topography, we seeded cells on polystyrene TopoChips, and cultured them for 48 h in basic medium and stained them with phalloidin and DAPI to visualize the cytoskeleton and nuclei, respectively. On flat control surfaces, TSCs displayed a typical spindle shape and oval nuclei (Figure 2), but showed very diverse cell shapes on the different topographies (Figure 2). For example, some topographies induced an extremely elongated morphology, cells with multiple lobes bulging out of the main body, or cells with extremely deformed nuclei. Within units and between replicas of the same topographies, cell shape was highly reproducible (Figure 3A). We noticed that cell shape was affected by the spacing between topography pillars. Previously, we were able to construct a computational model that was able to predict cell morphology based on surface design (Hulsman et al., 2015).
Next, we compared cell morphologies of TSCs and BM-MSCs grown on the same topographies. Images of BM-BM-MSCs were taken from a previous experiment, where cells were cultured on titanium-coated surfaces (Hulshof et al., 2017). Here, we noted that the morphology of TSCs and BM-MSCs were similar on some topographies (for example, surface T2_PS_3322,
Figure 3B) but different for others. For instance, on surface T2_PS_0242, TSCs grew in the valleys between the topographical pillars, whereas many BM-MSCs grew on top of the pillars. This may be due to the difference in cell size or cytoskeletal
organizations (Figure 3B). In addition, observed changes can be due to the different protein absorption on the two materials (Stevens and George, 2005). However, we have compared MSC morphologies on titanium and polystyrene flat surfaces (Supplementary Figure 6) and found out that cells morphology is on flat surfaces is comparable, regardless of the chemistry. In order to draw strong conclusions, a pairwise comparison of BM-MSC and TSC morphologies on the TopoChip is required though, which is beyond the aim of the current paper.
Surface Topographies Induce Differences
in ICAM-1 Expression
To assess the effect of surface topography on ICAM-1 expression, we cultured TSCs on eight TopoChips for 48 h in basic medium without TNF-α and LT-α1β2. Each TopoChip contains 2176 unique topographies, in duplicate, resulting in 16 replicas per unique topography. As positive and negative controls, respectively, we cultured TSCs on flat polystyrene ofapproximately equal area to the TopoChip with or without TNF-α and LT-α1β2. Cells were stained with DAPI to identify nuclei and phalloidin to visualize the cytoskeleton. The median cell number per unique topography varied between TopoChip replicas, with a range of 8–13 cells that corresponds to ∼160 cells per surface (Figure 4A). Next, we visually observed ICAM-1 staining as a marker of FRC differentiation using a robust image analysis pipeline using the open-source software, CellProfiler (Kamentsky et al., 2011). We found an increase in ICAM-1 staining in TSCs cultured on the TopoChips (Figure 4B), with the striking differences in 1 expression between topographies (Figure 4C). ICAM-1 expression was higher on the majority of topographies compared to the unpatterned surfaces in the TopoChips (Figure 4C). Quantitative analysis of the images showed that the median ICAM-1 expression on all topographies was significantly higher than that found from the negative control, which is TSCs cultured on flat polystyrene in basic media (Figure 4D).
To determine how different topographies affect the expression of 1, we ranked surfaces based on the ratio of ICAM-1–positive cells in all replicas per unique surface. Cells were classified as either ICAM-1–positive or –negative based on a threshold value of fluorescence intensity (Figure 4B). Among the ICAM-1–positive hits, we identified ICAM-1Highand ICAM-1Low surfaces by employing a chi-square test: we identified 112 surfaces that had a significantly higher number of ICAM-1–positive cells compared to the negative control (ICAM-1High surfaces) and 72 with a lower number of ICAM-1–
positive cells (ICAM-1Low) (Figure 5A). The morphology of TSCs from ICAM-1Highand ICAM-1Lowsurfaces were different (Figure 5B). Among the hits, we noticed that ICAM-1Highand ICAM-1Low surfaces not only have a drastically different level of ICAM-1 expression but also unique cell shapes (Figure 5B), which will be discussed below. From the hits, we selected four topographies that belong to either ICAM-1High or ICAM-1Low (Figure 5C, Supplementary Figure 3) and have different cell
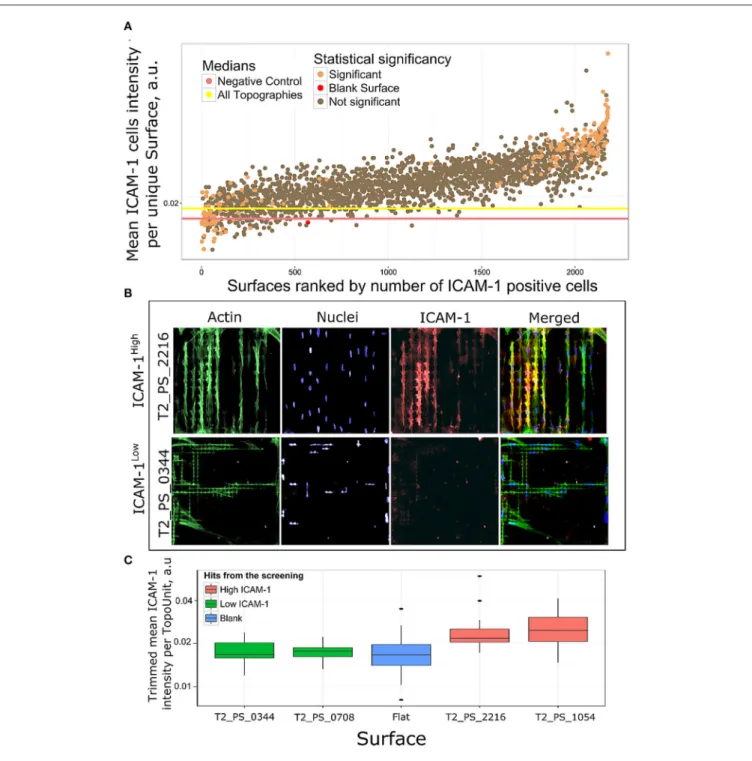
FIGURE 5 | Rank of surfaces based on ICAM-1 intensity. (A) Mean ICAM-1 expression in all replicas was ranked by a number of ICAM-1 positive cells. Using chi-square test we identified 184 surfaces with significantly different number of ICAM-1 positive cells in comparison with flat polystyrene, orange dots.
(B) Immunofluorescent images of cell morphologies represented by actin (green), nuclei (blue) and FRC differentiation marker ICAM-1 (red) staining on a high scoring surface T2_PS_2216 and low scoring T2_PS_0344. Actin was stained with phalloidin, nuclei were stained with DAPI. (C) Distribution of ICAM-1 expression in surfaces selected for further validation.
shapes (Supplementary Figure 4). These topographies were used for further validation studies. We discovered that topographies have a diverse effect on ICAM-1 expression in TSCs. TSCs on flat topographies are among the lowest ICAM-1 expression from all the tested surfaces. We were able to rank topographies based
on ICAM-1 presence and selected topographies for validation studies taking into account cells shapes. Selected surfaces had a very clear contrasting expression of ICAM-1 which was visible on immunofluorescent images and was validated by the analysis (Figure 5B, Supplementary Figure 3).
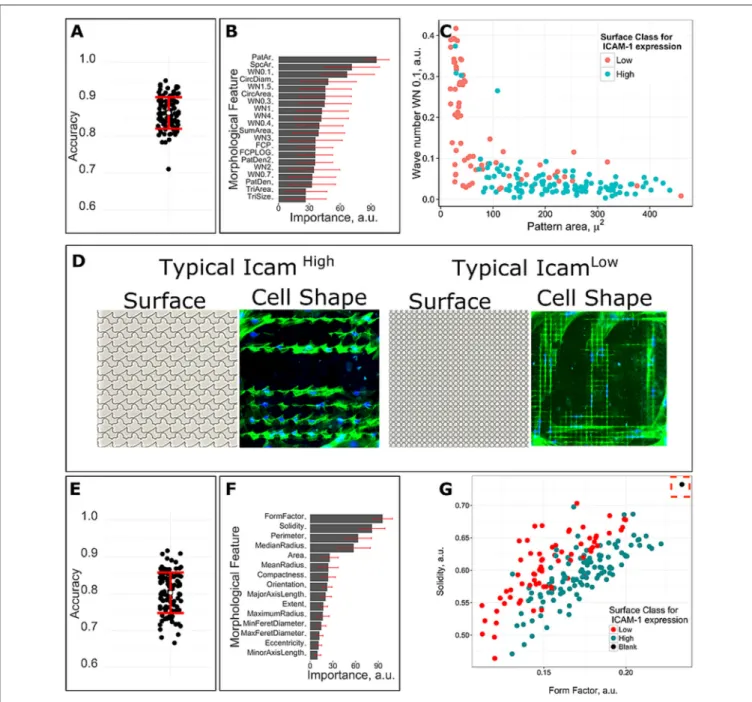
FIGURE 6 | Correlations between surface design, cell shape and ICAM-1 expression. A machine learning model was trained with 10 fold cross-validation by employing random forest classification algorithm. Seventy-two low scoring units and one hundred twelve high-scoring units with significantly different frequency of ICAM-1 positive cells were used for the analysis. (A) The accuracy of 100 predicted models based on surface design parameters. (B) Feature mean and standard deviation of importance for predicting surface class for ICAM-1 level based on surface design parameters. (C) Surfaces with different level of ICAM-1 can be distinguished based on surfaces design parameters that were predicted as the most important by the model. (D) Typical cell morphologies and topography structure of ICAM-1Lowand ICAM-1Highsurfaces. Green corresponds to actin and blue for nuclei. (E) The accuracy of 100 predicted models based on cell shape parameters.
(F) Feature mean and standard deviation of cell shape parameters importance for predicting surface class for ICAM-1 level. (G) Surfaces with the different level of ICAM-1 can be distinguished based on cell shape parameters that were predicted as the most important by the model. Black dot is a control, cells on flat surfaces.
ICAM-1 Expression Correlates to Surface
Design Parameters and Cell Shape
To evaluate the correlation between ICAM-1 expression and surface design parameters, we trained a machine learning model with 10-fold cross-validation by employing random forest (RF) classification, a pattern-recognition, computational algorithm
that is able to unravel non-linear relationships in data. We used RF and binary classification to identify the surface design parameters that are unique to the 112 ICAM-1High and 72 ICAM-1Low surfaces. This was done by binary classification, which means that we had 2 different classes with ICAM-1High or ICAM-1Low surfaces and found similar design properties
within those groups. We analyzed design parameters of seventy-two low scoring units and one hundred twelve high-scoring units that had a significant difference in frequency of ICAM-1 positive cells. The accuracy of the obtained model was assessed on a held-out data set, which was randomly selected from 1/3 of the original data, and not used for model training. To ensure robustness of the model, we performed model training 100 times with random splitting of the data into training and testing data sets. The average accuracy of the 100 simulations validated on the held-out data set was 86%, which means that from 100 surfaces, the algorithm was able to accurately predict expression of ICAM-1 on 86 of them (Figure 6A). In addition, we also quantified the importance of surface design parameters for separation of defined classes according to pattern recognition algorithm. The parameters that correlate to ICAM-1 expression based on average importance across all simulations (Figure 6B) include pattern area, space area, and the WN0.1 (Wave Number 0.1, which describes both density of structures and their size) (Figure 6C). A typical ICAM-1High surface has pillars with the area in the range between 100 and 400 µm2with moderate spacing between them (Figure 6D), while the typical ICAM-1Low surface has densely
located patterns with the area typically lower than 100 µm2 (Figure 6D).
Having observed that ICAM-1Highand I-CAM-1Lowsurfaces resulted in different cell morphologies, we wished to obtain a model describing the relationship between cell shape and ICAM-1 expression, using the same machine-learning approach. The average accuracy of 100 simulations was 80% (Figure 6E). We found that the cell shape parameters Solidity, Form Factor, Perimeter, and Median Radius were the most important to separate the 2 classes in 100 simulations (Figure 6F), with Form Factor as the most important feature. Cells on flat surfaces were large and spread and thus had a large Form Factor value which is shown as a black dot in Figure 6G. At the same time, both positive and negative ICAM-1 cells were stretched elongated cells, but a typical 1 negative cell was thinner than ICAM-1 positive cells which also means more eccentric (Figure 6D).
Validation of the Screening Results on
Enlarged Surfaces
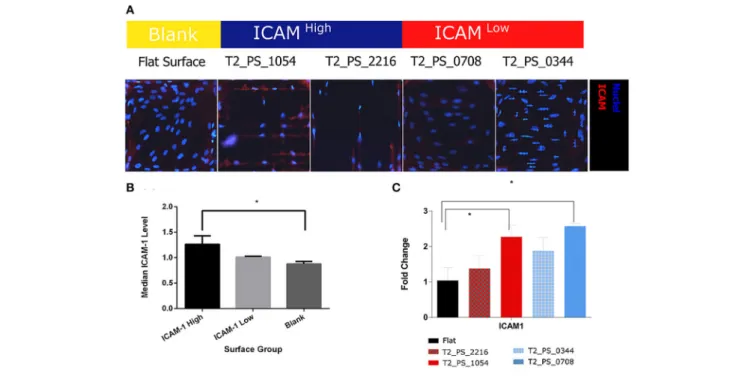
To validate results of our screening, we selected four topographies that belong to either ICAM-1High or ICAM-1Low (Figure 5C, Supplementary Figure 3) and have different cell shapes (Supplementary Figure 4), then fabricated enlarged surfaces (12 mm in diameter each). We cultured TSCs on one TopoChip for 48 h in basic medium without stimulation with TNF-α and LT-α1β2. TSCs were also cultured on these larger surfaces for 48 h without TNF-α and LT-α1β2. Cells were stained with DAPI to identify nuclei and antibodies to display ICAM-1 level. Similar to the screening data, the ICAM-1 expression levels on the larger surfaces were also different on ICAM-1High and ICAM-1Lowtopographies (Figure 7A). Using flow cytometry, we found a significant difference in ICAM-1 levels between TSCs on the flat control surface and the two ICAM-1Highsurfaces (pooled
medians) (Figure 7B).
To investigate whether upregulated ICAM-1 expression in TSCs on selected topographies correlates to co-expression of
other FRC markers, we evaluated the expression of some FRC-specific genes using qPCR analysis. On ICAM-1High surface and ICAM-1Low surface ICAM-1 expression was significantly different with more than 2 – fold change in comparison with cells on the flat surface (Figure 7C). Interestingly, ICAM-1 gene expression level on the ICAMHigh surface was the lowest of the
three surfaces despite having the highest ICAM-1 expression at the protein level. None of the other markers of the FRC phenotype that we evaluated, such as VCAM-1, IL7, or CCL5, were differentially expressed in cells cultured on ICAM-1Highor ICAM-1Lowsurfaces (data not shown).
However, we did observe an increase of LTBR gene expression on all four surfaces containing topography. The possibility of modulation of LTBR by the topography by our knowledge was not reported before, and certainly needed further investigation (Figure 8A). Moreover, expression of ICAM-1 and LTBR highly correlated on selected topographies with R2 equal to 0.73
(Figure 8B).
We were able to validate results of the screening by immunofluorescent imaging, however, we did not observe consistent upregulation of FRC specific phenotypical markers.
DISCUSSION AND CONCLUSION
The objective of this study was to investigate whether TSCs are mechanoresponsive, and topography alone is sufficient to induce an FRC phenotype. We used ICAM-1 as readout because it is strongly upregulated during differentiation from stromal progenitors to FRC, making it a sensitive marker (Bénézech et al., 2012). ICAM-1 expression strongly increases in response to TNF-αand LT-α1β2, and ICAM-1 is an adhesion molecule known to be involved in mechanotransduction (Lessey-Morillon et al., 1950; Marjoram et al., 2014). Although ICAM-1 is an intercellular adhesion molecule (Rothlein et al., 1986), it has been reported as responsible for cell-cell interaction between lymphocytes and endothelial cells (Luscinskas et al., 1991). Moreover, it is known to be transcriptionally activated by the mechano-sensitive transcription factor egr-1 (Zhang et al., 2013). However, before our study, there has been no evidence that intercellular adhesion molecules can be manipulated by topography. Our investigation shows that ICAM-1 expression can be manipulated by topographical cues.
Differences in the number of ICAM-1–positive cells per unit may be explained by differential adhesion of ICAM-1– positive cells or by the proliferative advantage of ICAM-1– positive cells on selected topographies. Subpopulations of TSCs have an intrinsic expression of ICAM-1 (Ame-Thomas et al., 2007). Importantly, we did not observe surfaces where all cells were ICAM-1–positive in all replicas. However, the difference between the median cell numbers on ICAM-1Lowtopographies
and ICAM-1High topographies is negligible (16 vs. 17 cells,
respectively), which makes differential growth or adhesion advantages unlikely (Figure 8C). Similarly, topographies do strongly influence migratory behavior of cells, as has been reported for other cell types (Park et al., 2016). However, our TopoChip contains walls between units that make it unlikely that subpopulations of ICAM-1–positive cells migrated to hit topographies. Furthermore, we could predict accurately
FIGURE 7 | Validation of ICAM-1 staining. TSCs cells were grown on polystyrene topographical surfaces in basic media for 48 h. (A) Fluorescent images of ICAM-1 staining in TSCs, ICAM-1 is red, and nuclei are blue. (B) Median ICAM-1 level, quantified by FACS, results from hits topographies are pooled. (C) Expression of ICAM-1 on hits topographies measured by qPCR. *Indicates significant difference with a p < 0.05.
FIGURE 8 | Expression of FRC phenotypical markers. TSCs cells were cultured on polystyrene topographical surfaces in basic media for 48 h. (A) Expression of LTBR on selected topographies measured by qPCR. (B) Correlation between fold change in LTBR and ICAM-1. (C) Differences in Cell number on ICAM-1Highand ICAM-1Lowtopographies. TSCs cells were cultured on 8 Topochips in basic media for 48 h. A number of cells were quantified based on nuclei staining. (D) Actin intensity comparison between cells with high and low median ICAM-1 level on ICAM-1Hightopographies. TSCs cells were cultured on 8 Topochips in basic media for
48 h. Actin Intensity was measured in images of cells stained with fluorescently labeled phalloidin. *Indicates significant difference with a p < 0.05. **Indicates significant difference with a p < 0.01. ***Indicates significant difference with a p < 0.001. ****Indicates significant difference with a p < 0.0001.
the class of surfaces (ICAM-1High or ICAM-1Low) from the
screening based on surface design and cell shape data. Moreover, the differences between selected hits were clearly visible on immunostained images (Supplementary Figure 4), indicating that topography induced ICAM-1 expression in TSCs.
The different levels of ICAM-1 in TSCs on ICAM-1High
surfaces might be related to cell cycle, as expression heterogeneity is well known for primary cell lines (Sivasubramaniyan et al., 2012; Gothard et al., 2014). Whether this applies for TSCs here requires further investigation. Interestingly, ICAM-1 intensity directly correlated to actin intensity (Figure 8D). Actin is the main transducer of mechanical signals to the cell (Gaspar and Tapon, 2014); if the actin network is less filamentous, it also provides less signal for ICAM-1 upregulation. It is known that actin directly binds to adhesion molecules such as ICAM-1 via ezrin, radixin, and moesin complexes (Lévesque and Simmons, 1999; Neisch and Fehon, 2011). Therefore, it is very likely that the expression of ICAM-1 is regulated through a mechanotransduction pathway involving actin. The effect of mechanical loading on the level of ICAM-1 has been described: an increase in interstitial flow can upregulate ICAM-1 in lymphatic endothelial cells (Swartz and Lund, 2012). This finding suggests that upregulation of ICAM-1 is a part of the global cell response to mechanical cues. For future work, it will be interesting to use cytoskeleton-disrupting agents to see how they affect ICAM-1 expression on the topographies.
In our validation studies with FACS, we saw small differences between selected topographies and flat surfaces which can be explained by first upregulation of ICAM-1 is not very high in comparison with TNF-α and LT-α1β2 and that this is bulk measurement. For such studies with heterogeneous cell population method that allows single-cell analysis, such as single cell qPCR, should be preferred.
Our findings of elongated cell shape correlating with I-CAM1Highsurfaces are consistent with TSCs in vivo. Stromal cells in tonsils experience mechanical stress during the acute phase of inflammation when many lymphocytes enter the tonsil and subsequently expand the organ. For lymph nodes, it was shown that the total number of stromal cells does not increase, rather individual stromal cells stretch (Fletcher et al., 2015) during the early stages of organ expansion. Our elongated, ICAM-1–positive TSCs phenotypically resemble stretched cells.
Although a clear correlation was found between ICAM-1 expression, cell shape, and surface design, the cells did not adopt a mature FRC phenotype. We hypothesize that mechanotransduction can support but not fully trigger FRC differentiation.
TSCs respond very strongly to our library of topographies. We noted that TSCs are able to penetrate between dense pillars, and seem to do this more efficiently than BM-MSCs (Figure 3B). Different cell types behave differently on micropatterned topography, for example, Lecric et al. showed that when cultured together, fibroblasts tend to grow on ridges, while epithelial cells grow inside the grooves (Leclerc et al., 2013). Additionally, F. Badique et al. reported experiments on nuclear deformation on topographies with 3 osteosarcoma cell lines and demonstrated that cytoskeletal organization plays a major role
in the cells’ response to the microtopographies (Badique et al., 2013). It appears that TSCs more tightly adhere on topographical surfaces, and this may mimic their behavior in tonsils, where they have to create a very compact cellular structure and adhere to many cell types simultaneously. The findings reported here open up many avenues for further investigations. For example, it will be interesting to examine how topography affects meshwork formation in lymph node stromal cells.
In conclusion, we demonstrate that TSCs respond to surface topography and ICAM-1 expression correlates to both cell shape and surface design. Our ICAM-1–inducing surfaces are a valuable starting point to investigate the role of mechanobiology in FRC functions and in ICAM-1 mechanoregulation.
AUTHOR CONTRIBUTIONS
AV and SS performed screening and analyzed the data. FM, AM, ML, and AV performed differentiation studies, flow cytometry analysis and qRT-PCR. FH, NB, and YZ fabricated TopoChip and enlarged surfaces. BP, AC, DS, CvB, KT, and JdB provided reagents and critically reviewed the manuscript before the submission.
FUNDING
Funding for AC and SS was provided by the National Institute of General Medical Sciences of the National Institutes of Health under MIRA award number R35 GM122547 (to AC).
ACKNOWLEDGMENTS
We thank Céline Monvoisin and Marion Guirriec (University of Rennes, Rennes, France) and Natalie Fekete (Materiomics) for technical support. FM and KT received funding from the Ligue Nationale Contre le Cancer (Equipe labellisée). This research is supported by funding from the European Union’s Seventh Framework Programme (FP7/2007-2013) under grant agreement no 289720. AV, NB, and JdB acknowledge the financial contribution of the Province of Limburg.
SUPPLEMENTARY MATERIAL
The Supplementary Material for this article can be found online at: https://www.frontiersin.org/articles/10.3389/fbioe. 2018.00087/full#supplementary-material
Supplementary Figure 1 | TopoChip. A micro topography screening platform contains 2176 unique topographies. The topographical features were randomly selected from an in silico library of more than 150 million of topographies, which were designed from an algorithm that synthesized patterns based on simple geometric elements – circles, triangles, and rectangles.
Supplementary Figure 2 | Cells isolation schematic representation. Stromal cells were obtained from human tonsils collected from children undergoing routine tonsillectomy, after informed consent was obtained. Tonsils were cut into pieces and flushed using syringe and needle. Cell suspension was treated with DNAse I and collagenase IV followed by centrifugation on a discontinuous Percoll gradient. Cells were initially allowed to adhere for 48 h followed by elimination of
nonadherent cells and culture in RPMI 1640 supplemented with 10% selected fetal calf serum, and penicillin/streptomycin.
Supplementary Figure 3 | ICAM-1 expression on replicas from the screening. TSC cells were cultured on 8 Topochips in basic media for 48 h. DNA (blue) was stained with DAPI, ICAM-1 (Red) was stained using a combination of primary against ICAM-1 and specific secondary antibodies.
Supplementary Figure 4 | Cell shapes of selected topographies. TSC cells were cultured on 8 Topochips in Basic media for 48 h. Actin (green) was stained with phalloidin, DNA (blue) was stained with DAPI.
Supplementary Figure 5 | Distribution of ICAM-1 expression among replicas. Every dot is a median ICAM-1 expression in a single cell, in yellow corresponding box plot is showing. The adaptive threshold value for ICAM-1 positive cells is shown as a red line.
Supplementary Figure 6 | Comparison of BM-MSC and TSC shapes on flat polystyrene and titanium coated surfaces. BM-MSCs were cultured in basic media for 5 days on titanium-coated flat surfaces and 24 h on polystyrene flat surfaces. TSCs cells were cultured for 48 h in basic media on polystyrene topographies.
REFERENCES
Amé-Thomas, P., Maby-El Hajjami, H., Monvoisin, C., Jean, R., Monnier, D., Caulet-Maugendre, S., et al. (2007). Human mesenchymal stem cells isolated from bone marrow and lymphoid organs support tumor B-cell growth: role of stromal cells in follicular lymphoma pathogenesis. Blood 109, 693–702. doi: 10.1182/blood-2006-05-020800
Badique, F., Stamov, D. R., Davidson, P. M., Veuillet, M., Reiter, G., Freund, J. N., et al. (2013). Directing nuclear deformation on micropillared surfaces by substrate geometry and cytoskeleton organization. Biomaterials 34, 2991–3001. doi: 10.1016/j.biomaterials.2013.01.018
Bar-Ephraim, Y. E., Konijn, T., Gönültas, M., Mebius, R. E., and Reijmers, R. M. (2016). A reproducible method for isolation and in vitro culture of functional human lymphoid stromal cells from tonsils. PLoS ONE 11:e0167555. doi: 10.1371/journal.pone.0167555
Bénézech, C., Mader, E., Desanti, G., Khan, M., Nakamura, K., White, A., et al. (2012). Lymphotoxin-β receptor signaling through NF-κB2-RelB pathway reprograms adipocyte precursors as lymph node stromal cells. Immunity 37, 721–734. doi: 10.1016/j.immuni.2012. 06.010
Bray, M. A., and Carpenter, A. (2004). “Imaging platform, Broad Institute of MIT and Harvard. Advanced assay development guidelines for image-based high content screening and analysis,” in Assay Guidance Manual [Internet], eds G. S. Sittampalam, N. P. Coussens, K. Brimacombe, A. Grossman, M. Arkin, D. Auld et al. (Bethesda, MD: Eli Lilly & Company and the National Center for Advancing Translational Sciences).
Carpenter, A. E., Jones, T. R., Lamprecht, M. R., Clarke, C., Kang, I. H., Friman, O., et al. (2006). CellProfiler: image analysis software for identifying and quantifying cell phenotypes. Genome Biol. 7:R100. doi: 10.1186/gb-2006-7-10-r100
Crivellato, E., Vacca, A., and Ribatti, D. (2004). Setting the stage: an anatomist’s view of the immune system. Trends immunol. 25, 210–217. doi: 10.1016/j.it.2004.02.008
Cupedo, T., Stroock, A., and Coles, M. (2012). Application of tissue engineering to the immune system: development of artificial lymph nodes. Front. Immunol. 3:343. doi: 10.3389/fimmu.2012.00343
De Boer, J., Wang, H. J., and Van Blitterswijk, C. (2004). Effects of Wnt signaling on proliferation and differentiation of human mesenchymal stem cells. Tissue Eng. 10, 393–401. doi: 10.1089/107632704323061753
Fletcher, A. L., Acton, S. E., and Knoblich, K. (2015). Lymph node fibroblastic reticular cells in health and disease. Nat. Rev. Immunol. 15, 350–561. doi: 10.1038/nri3846
Fletcher, A. L., Malhotra, D., Acton, S. E., Lukacs-Kornek, V., Bellemare-Pelletier, A., Curry, M., et al. (2011). Reproducible isolation of lymph node stromal cells reveals site-dependent differences in fibroblastic reticular cells. Front. Immunol. 2:35. doi: 10.3389/fimmu.2011.00035
Gaspar, P., and Tapon, N. (2014). Sensing the local environment: actin architecture and Hippo signalling. Curr. Opin. Cell Biol. 31:74–83. doi: 10.1016/j.ceb.2014.09.003
Gentile, P., Orlandi, A., Scioli, M. G., Di Pasquali, C., Bocchini, I., and Cervelli, V. (2012). Concise review: adipose-derived stromal vascular fraction cells and platelet-rich plasma: basic and clinical implications for tissue engineering therapies in regenerative surgery. Stem Cells Transl. Med. 1:230–236. doi: 10.5966/sctm.2011-0054
Gothard, D., Greenhough, J., Ralph, E., and Oreffo, R. O. (2014). Prospective isolation of human bone marrow stromal cell subsets: a comparative study
between Stro-1-, CD146- and CD105-enriched populations. J. Tissue Eng. 5:2041731414551763. doi: 10.1177/2041731414551763
Guvendiren, M., and Burdick, J. A. (2013). Stem cell response to spatially and temporally displayed and reversible surface topography. Adv. Healthc. Mater. 2, 155–164. doi: 10.1002/adhm.201200105
Hulshof, F. F. B., Papenburg, B., Vasilevich, A., Hulsman, M., Zhao, Y., Levers, M., et al. (2017). Mining for osteogenic surface topographies: in silico design to in vivo osseo-integration. Biomaterials 137, 49–60. doi: 10.1016/j.biomaterials.2017.05.020
Hulsman, M., Hulshof, F., Unadkat, H., Papenburg, B. J., Stamatialis, D. F., Truckenmuller, R., et al. (2015). Analysis of high-throughput screening reveals the effect of surface topographies on cellular morphology. Acta biomater. 15, 29–38. doi: 10.1016/j.actbio.2014.12.019.
Janson, I. A., and Putnam, A. J. (2015). Extracellular matrix elasticity and topography: Material-based cues that affect cell function via conserved mechanisms. J. Biomed. Mater. Res. A 103, 1246–1258. doi: 10.1002/jbm.a.35254
Kamentsky, L., Jones, T. R., Fraser, A., Bray, M. A., Logan, D. J., Madden, K. L., et al. (2011). Improved structure, function and compatibility for CellProfiler: modular high-throughput image analysis software. Bioinformatics 27, 1179–1180. doi: 10.1093/bioinformatics/btr095
Katakai, T., Hara, T., Sugai, M., Gonda, H., and Shimizu, A. (2004). Lymph node fibroblastic reticular cells construct the stromal reticulum via contact with lymphocytes. J. Exp. Med. 200, 783–795. doi: 10.1084/jem.20040254 Kolind, K., Leong, K. W., Besenbacher, F., and Foss, M. (2012). Guidance
of stem cell fate on 2D patterned surfaces. Biomaterials 33, 6626–6633. doi: 10.1016/j.biomaterials.2012.05.070
Kuhn, M. (2008). Building predictive models in r using the caret package. J. Stat. Softw. 28:26. doi: 10.18637/jss.v028.i05
Leclerc, A., Tremblay, D., Hadjiantoniou, S., Bukoreshtliev, N. V., Rogowski, J. L., Godin, M., et al. (2013). Three dimensional spatial separation of cells in response to microtopography. Biomaterials 34, 8097–8104. doi: 10.1016/j.biomaterials.2013.07.047
Lessey-Morillon, E. C., Osborne, L. D., Monaghan-Benson, E., Guilluy, C., O’Brien, E. T., Superfine, R., et al. (1950). The RhoA GEF, LARG, mediates ICAM-1-dependent mechanotransduction in endothelial cells to stimulate transendothelial migration. J. immunol. 192, 3390–3398. doi: 10.4049/jimmunol.1302525
Lévesque, J. P., and Simmons, P. J. (1999). Cytoskeleton and integrin-mediated adhesion signaling in human CD34+ hemopoietic progenitor cells. Exp. Hematol. 27, 579–586.
Liao, H.-T., and Chen, C. T. (2014). Osteogenic potential: Comparison between bone marrow and adipose-derived mesenchymal stem cells. World J. Stem Cells 6, 288–295. doi: 10.4252/wjsc.v6.i3.288
Link, A., Vogt, T. K., Favre, S., Britschgi, M. R., Acha-Orbea, H., Hinz, B., et al. (2007). Fibroblastic reticular cells in lymph nodes regulate the homeostasis of naive T cells. Nat. immunol. 8, 1255–1265. doi: 10.1038/ni1513
Loisel, S., Dulong, J., Ménard, C., Renoud, M. L., Meziere, N., Isabelle, B., et al. (2017). Brief report: proteasomal indoleamine 2, 3-dioxygenase degradation reduces the immunosuppressive potential of clinical grade-mesenchymal stromal cells undergoing replicative senescence. Stem Cells 35, 1431–1436. doi: 10.1002/stem.2580
Luong-Van, E., Rodriguez, I., Low, H. Y., Elmouelhi, N., Lowenhaupt, B., Natarajan, S., et al. (2013). Review: Micro- and nanostructured surface engineering for biomedical applications. J. Mater. Res. 28, 165–174. doi: 10.1557/jmr.2012.398
Luscinskas, F. W., Cybulsky, M. I., Kiely, J. M., Peckins, C. S., Davis, V. M., and Gimbrone, M. A. (1991). Cytokine-activated human endothelial monolayers support enhanced neutrophil transmigration via a mechanism involving both endothelial-leukocyte adhesion molecule-1 and intercellular adhesion molecule-1. J. Immunol. 146, 1617–1625.
Malhotra, D., Fletcher, A. L., and Turley, S. J. (2013). Stromal and hematopoietic cells in secondary lymphoid organs: partners in immunity. Immunol. Rev. 251, 160–176. doi: 10.1111/imr.12023
Marjoram, R. J., Lessey, E. C., and Burridge, K. (2014). Regulation of RhoA Activity by Adhesion Molecules and Mechanotransduction. Curr. Mol. Med. 14, 199–208. doi: 10.2174/1566524014666140128 104541
Mentink, A., Hulsman, M., Groen, N., Licht, R., Dechering, K. J., van der Stok, J., et al. (2013). Predicting the therapeutic efficacy of MSC in bone tissue engineering using the molecular marker CADM1. Biomaterials 34, 4592–4601. doi: 10.1016/j.biomaterials.2013. 03.001
Neisch, A. L., and Fehon, R. G. (2011). Ezrin, Radixin and Moesin: key regulators of membrane-cortex interactions and signaling. Curr. opin. Cell Biol. 23, 377–382. doi: 10.1016/j.ceb.2011.04.011.
Onder, L., Narang, P., Scandella, E., Chai, Q., Iolyeva, M., Hoorweg, K., et al. (2012). IL-7–producing stromal cells are critical for lymph node remodeling. Blood. 120, 4675–4683. doi: 10.1182/blood-2012-03-416859.
Pandey, S., Mourcin, F., Marchand, T., Nayar, S., Guirriec, M., Pangault, C., et al. (2017). IL-4/CXCL12 loop is a key regulator of lymphoid stroma function in follicular lymphoma. Blood 129, 2507–2518. doi: 10.1182/blood-2016-08-737239
Park, J., Kim, D. H., Kim, H. N., Wang, C. J., Kwak, M. K., Hur, E., et al. (2016). Directed migration of cancer cells guided by the graded texture of the underlying matrix. Nat Mater. 15, 792–801. doi: 10.1038/nmat4586
Reimer, A., Vasilevich, A., Hulshof, F., Viswanathan, P., van Blitterswijk, C. A., de Boer, J., et al. (2016). Scalable topographies to support proliferation and Oct4 expression by human induced pluripotent stem cells. Sci. Rep. 6:18948. doi: 10.1038/srep18948
Rothlein, R., Dustin, M. L., Marlin, S. D., and Springer, T. A. (1986). A human intercellular adhesion molecule (ICAM-1) distinct from LFA-1. J. Immunol. 137, 1270–1274.
Ryan, C. N., Fuller, K. P., Larrañaga, A., Biggs, M., Bayon, Y., Sarasua, J. R., et al. (2015). An academic, clinical and industrial update on electrospun, additive manufactured and imprinted medical devices. Expert Rev. Med. Dev. 12, 601–612. doi: 10.1586/17434440.2015.1062364
Sackmann, J., Burlage, K., Gerhardy, C., Memering, B., Liao, S., and Schomburg, W. K. (2015). Review on ultrasonic fabrication of polymer micro devices. Ultrasonics 56, 189–200. doi: 10.1016/j.ultras.2014.08.007
Sivasubramaniyan, K., Lehnen, D., Ghazanfari, R., Sobiesiak, M., Harichandan, A., Mortha, E., et al. (2012). Phenotypic and functional heterogeneity of human bone marrow– and amnion-derived MSC subsets. Ann. N Y Acad. Sci. 1266, 94–106. doi: 10.1111/j.1749-6632.2012.06551.x
Stevens, M. M., and George, J. H. (2005). Exploring and engineering the cell surface interface. Science.310, 1135–1138. doi: 10.1126/science.1106587
Swartz, M. A., and Lund, A. W. (2012). Lymphatic and interstitial flow in the tumour microenvironment: linking mechanobiology with immunity. Nat. Rev. Cancer 12, 210–219. doi: 10.1038/nrc3186
Tarte, K., Gaillard, J., Lataillade, J. J., Fouillard, L., Becker, M., Mossafa, H., et al. (2010). Clinical-grade production of human mesenchymal stromal cells: occurrence of aneuploidy without transformation. Blood 115, 1549–1553. doi: 10.1182/blood-2009-05-219907
Tsuji, W., Rubin, J. P., and Marra, K. G. (2014). Adipose-derived stem cells: Implications in tissue regeneration. World J. Stem Cells 6, 312–321. doi: 10.4252/wjsc.v6.i3.312
Turley, S. J., Fletcher, A. L., and Elpek, K. G. (2010). The stromal and haematopoietic antigen-presenting cells that reside in secondary lymphoid organs. Nat. Rev. Immunol. 10, 813–825. doi: 10.1038/nri2886
Uccelli, A., Moretta, L., and Pistoia, V. (2008). Mesenchymal stem cells in health and disease. Nat. Rev. Immunol. 8, 726–736. doi: 10.1038/nri2395
Unadkat, H. V., Hulsman, M., Cornelissen, K., Papenburg, B. J., Truckenmüller, R. K., Carpenter, A. E., et al. (2011). An algorithm-based topographical biomaterials library to instruct cell fate. Proc. Nat. Acad. Sci. U.S.A. 108, 16565–16570. doi: 10.1073/pnas.1109861108
Unadkat, H. V., Rewagad, R. R., Hulsman, M., Hulshof, G. F., Truckenmüller, R. K., Stamatialis, D. F., et al. (2013). A modular versatile chip carrier for high-throughput screening of cell-biomaterial interactions. J. R. Soc. Interf. R. Soc. 10:20120753. doi: 10.1098/rsif.2012.0753
Wickham, H. (2009). ggplot2: Elegant Graphics for Data Analysis. New York, NY: Springer Science & Business Media.
Wong, S. T., Teo, S. K., Park, S., Chiam, K. H., and Yim, E. K. (2014). Anisotropic rigidity sensing on grating topography directs human mesenchymal stem cell elongation. Biomech. Model. Mechanobiol. 13, 27–39. doi: 10.1007/s10237-013-0483-2
Zeng, M., Smith, A. J., Wietgrefe, S. W., Southern, P. J., Schacker, T. W., Reilly, C. S., et al. (2011). Cumulative mechanisms of lymphoid tissue fibrosis and T cell depletion in HIV-1 and SIV infections. J. Clin. Invest. 121, 998–1008. doi: 10.1172/JCI45157
Zhang, K., Cao, J., Dong, R., and Du, J. (2013). Early growth response protein 1 promotes restenosis by upregulating intercellular adhesion molecule-1 in vein graft. Oxidat. Med. Cell. Long. 2013:432409. doi: 10.1155/2013/432409 Zhao, Y., Truckenmuller, R., Levers, M., Hua, W. S., de Boer, J., and
Papenburg, B. (2013). High-definition micropatterning method for hard, stiff and brittle polymers. Mater. Sci. Eng. C Mater. Biol. Appl. 71, 558–564. doi: 10.1016/j.msec.2016.11.004
Conflict of Interest Statement:CvB and JdB are co-founders of and have a
financial interest in Materiomics b.v.
The remaining authors declare that the research was conducted in the absence of any commercial or financial relationships that could be construed as a potential conflict of interest.
Copyright © 2018 Vasilevich, Mourcin, Mentink, Hulshof, Beijer, Zhao, Levers, Papenburg, Singh, Carpenter, Stamatialis, Blitterswijk, Tarte and Boer. This is an open-access article distributed under the terms of the Creative Commons Attribution License (CC BY). The use, distribution or reproduction in other forums is permitted, provided the original author(s) and the copyright owner are credited and that the original publication in this journal is cited, in accordance with accepted academic practice. No use, distribution or reproduction is permitted which does not comply with these terms.