Publisher’s version / Version de l'éditeur:
Vous avez des questions? Nous pouvons vous aider. Pour communiquer directement avec un auteur, consultez la première page de la revue dans laquelle son article a été publié afin de trouver ses coordonnées. Si vous n’arrivez pas à les repérer, communiquez avec nous à PublicationsArchive-ArchivesPublications@nrc-cnrc.gc.ca.
Questions? Contact the NRC Publications Archive team at
PublicationsArchive-ArchivesPublications@nrc-cnrc.gc.ca. If you wish to email the authors directly, please see the first page of the publication for their contact information.
https://publications-cnrc.canada.ca/fra/droits
L’accès à ce site Web et l’utilisation de son contenu sont assujettis aux conditions présentées dans le site LISEZ CES CONDITIONS ATTENTIVEMENT AVANT D’UTILISER CE SITE WEB.
Research Report (National Research Council of Canada. Institute for Research in
Construction), 2002-10-01
READ THESE TERMS AND CONDITIONS CAREFULLY BEFORE USING THIS WEBSITE.
https://nrc-publications.canada.ca/eng/copyright
NRC Publications Archive Record / Notice des Archives des publications du CNRC :
https://nrc-publications.canada.ca/eng/view/object/?id=8278c850-5f52-47a3-96dc-beaea6e5d8f2 https://publications-cnrc.canada.ca/fra/voir/objet/?id=8278c850-5f52-47a3-96dc-beaea6e5d8f2
Archives des publications du CNRC
For the publisher’s version, please access the DOI link below./ Pour consulter la version de l’éditeur, utilisez le lien DOI ci-dessous.
https://doi.org/10.4224/20378705
Access and use of this website and the material on it are subject to the Terms and Conditions set forth at
Report from Task 8 of MEWS Project - MEWS Methodology for
Developing Moisture Management Strategies - Application to Stucco
Clad Wood-Frame Walls in North America
Beaulieu, P.; Bomberg, M. T.; Cornick, S. M.; Dalgliesh, W. A.; Desmarais,
G.; Djebbar, R.; Kumaran, M. K.; Lacasse, M. A.; Lackey, J. C.; Maref, W.;
Mukhopadhyaya, P.; Nofal, M.; Normandin, N.; Nicholls, M.; O'Connor, T.;
Quirt, J. D.; Rousseau, M. Z.; Said, M. N.; Swinton, M. C.; Tariku, F.; van
Reenen, D.
Report from Task 8 of MEWS
Project
MEWS Methodology for
Developing Moisture Management
Strategies - Application to
Stucco-clad Wood-Frame Walls In North
America
Research report 112
Date of Issue: October 2002
Authors:
Peter Beaulieu, Mark Bomberg, Steve Cornick, Alan Dalgliesh, Guylaine Desmarais,
Reda Djebbar, Kumar Kumaran Michael Lacasse, John Lackey, Wahid Maref, PhalguniMukhopadhyaya, Mostafa Nofal, Nicole Normandin, Mike Nicholls, Tim O’Connor, David Quirt, Madeleine Rousseau, Nady Said, Mike Swinton, Fitsum Tariku, David van Reenen
Published by
Institute for Research in Construction National Research Council Canada Ottawa, C nada a
K1A 0R6
MEWS PROJECT REPORT T8-02: March 2002
REPORT FROM TASK 8 OF MEWS PROJECT
MEWS METHODOLOGY FOR DEVELOPING MOISTURE
MANAGEMENT STRATEGIES
Application to Stucco-clad Wood-Frame Walls
in North America
IRC Research Team
Peter Beaulieu Mostafa Nofal Mark Bomberg Nicole Normandin Steve Cornick Mike Nicholls Alan Dalgliesh Tim O’Connor Guylaine Desmarais David Quirt
Reda Djebbar Madeleine Rousseau Kumar Kumaran Nady Said
Michael Lacasse Mike Swinton John Lackey Fitsum Tariku Wahid Maref David van Reenen Phalguni Mukhopadhyaya
MEWS Steering Committee
David Ritter, Louisiana Pacific Corporation Eric Jones, Canadian Wood Council Fred Baker, Fortifiber Corporation Gary Sturgeon, Masonry Canada Michael Bryner, EI DuPont de Nemours & Co Sylvio Plescia, CMHC
Nathalie Seguin, Fiberboard Manufacturers Association of Canada
Fadi Nabhan, IRC, NRC Canada Stephane Baffier, CPIA David Quirt, IRC, NRC Canada Paul Morris, Forintek Canada Corporation Kumar Kumaran, IRC NRC Canada Greg McManus, Marriott International Inc. Michael Lacasse, IRC NRC Canada Stephan Klamke, EIMA
MEWS METHODOLOGY FOR DEVELOPING MOISTURE
MANAGEMENT STRATEGIES
Application to Stucco-clad Wood-Frame Walls
in North America
Foreword
The objective of this report is to communicate, in a very concise form, some of the accomplishments of the MEWS (Moisture Management for Exterior Wall Systems) project. This will be done in terms of the research methodology adopted, as well as the outcome of its application to the first type of walls analysed in the project - Stucco-clad exterior wood-frame wall assemblies. Only a few examples will be cited in this report. Many reports have been produced detailing the process followed and the results obtained. The interested reader is welcome to refer to these documents for a more detailed investigation of any selected topics.
This document is the outcome of the consolidated efforts of a research team at the Institute for Research in Construction. The following organizations partnered the MEWS project with the Institute.
Louisiana Pacific Corporation Marriott International Inc
Fortifiber Corporation EIFS Industry Members Association EI DuPont de Nemours & Co. Canadian Wood Council
Fiberboard Manufacturers Assn., Canada Masonry Canada
Canadian Plastic Industry Association Canada Mortgage and Housing Corp. Forintek Canada Corporation National Research Council Canada
This document has been reviewed by all MEWS partners and consensus has been reached for its release as an official MEWS document. However, Forintek Canada Corporation has submitted a dissenting statement with regard to the definition and use of the term "Moisture Index" as used in the MEWS methodology. Forintek's comments are appended to the Task Group 4 Report: Environmental Conditions Final Report T4-02.
Introduction
At the institute for Research in Construction, National Research Council of Canada, the research project MEWS (Moisture Management for Exterior Wall Systems) has resulted in a methodology that leads to design considerations for improved moisture management strategies for any wall assembly at any geographic region in North America. This document summarizes the methodology and the outcome of its application to stucco-clad (Portland cement plaster) wood-frame walls. A companion document entitled “MEWS Methodology and Summary of Findings – Report T8-03” gives the details of the methodology and its application.
The Methodology
The long-term performance of any wall assembly of a building is the consequence of the hygrothermal responses of the wall as a whole and localized responses of any of its components and material layers; these responses are specific to each geographic location and to the indoor climate. In MEWS context, the long-term performance of wood and wood-based materials determines the long-term performance of the wall.
The project makes full use of IRC’s mathematical model hygIRC, benchmarked against many sets of laboratory experiments, for predicting the hygrothermal response of the wall as a whole as well as at a localized vulnerable area of the wall. New knowledge was required on the following fronts:
- Climate characterization for North America, in terms of moisture loads imposed on a wall - Typical practice of design and construction of walls with different cladding systems in
place
- Estimation of quantity and distribution of water ingress into the wall assembly, in relation with climatic loading
- Characterisation of hygrothermal properties of materials - Selection of indicators of the hygrothermal response of the wall
The following sections highlight the outcome in each of these fields of activities.
Estimation of the Climatic Moisture Loads in North America
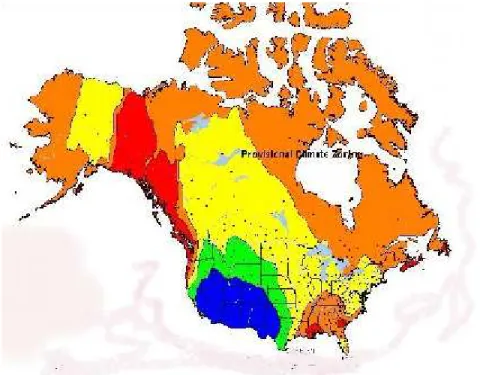
North American locations are characterized using a Moisture Index (MI) that can range from zero to 1.414. This index is a combination of a wetting index, which represents the amount of rain to which a wall can be exposed, and a drying Index, which represents the drying potential offered by the climate through evaporation. Based on one set of approximations for MI classification, North American locations are grouped in five weather zones. The resulting provisional map1 is shown in Figure 1. The severity of the moisture load increases with MI. The red zones in general see the most severe load, followed by the orange zones, the yellow zones and then the green zones. Walls in the blue zones experience the lowest moisture load.
Weather data from more than 300 locations in North America are analyzed in detail and 41 locations are selected to represent the full range. The MI for each of these 41 locations is listed in Table 1.
1
Local variations are not captured in the provisional map that is shown here for demonstration; other maps could be developed for specific purposes.
Figure 1. Climate zoning of North America; a provisional map for demonstration.
Table 1: Moisture Index for selected cities in North America
City MI City MI City MI
Mobile AB 1.22 Wilmington DE 0.98 Toronto ON 0.92 New Orleans LA 1.21 Raleigh NC 0.97 Minneapolis MN 0.90 St Johns NF 1.17 Iqaluit NU 0.96 Edmonton AB 0.89 Shearwater NS 1.15 Charlotte NC 0.96 Winnipeg MB 0.86 Wilmington NC 1.13 Baltimore MD 0.95 San Francisco CA 0.86 Vancouver BC 1.09 Chicago IL 0.95 Fargo ND 0.85 Miami FL 1.08 Pittsburgh PA 0.95 Calgary AB 0.81 Atlanta GA 1.06 Tampa FL 0.95 Fort Worth TX 0.79 Orlando FL 1.03 Madison WI 0.94 San Diego CA 0.74 Boston MA 1.01 Windsor ON 0.94 Colorado Springs CO 0.70 Houston TX 1.01 Montreal QC 0.93 Fresno CA 0.49 Victoria BC 1.00 Ottawa ON 0.93 Phoenix AZ 0.13 Fredericton NB 0.99 Kansas City MO 0.93 Las Vegas NV 0.11 Seattle WA 0.99 St. Louis MO 0.92
Review Typical Practice in the Design and Construction of the Walls
The project scope includes the following four types of wall assemblies, based on their cladding systems: stucco-clad, EIFS-clad, masonry clad and siding-clad wall assemblies. Information was gathered on the field practice for these four wall systems. For stucco-clad walls, it was found that in Canada and USA, the moisture management strategy commonly includes the application of a water resistive membrane behind the cladding (concealed weather barrier wall). Wall assemblies that include a drained furred cavity behind the cladding were starting to be used in BC. Both types of walls were examined in the project, with more emphasis on the concealed weather barrier wall assembly. Various material layers, the sequence of each layer and the dimensions of each layer in the wall assembly as well as types of deficiencies that can be found
in these systems were documented for later use in the water ingress laboratory evaluation as well as the hygIRC simulations.
Characterisation of Hygrothermal Properties of Materials
A detailed database on hygrothermal properties of a variety of building materials was developed at the Institute during the past decade. A number of new building products were included in MEWS and their properties were measured using well-established experimental and analytical procedures. An updated database was thus developed. This new database is used to define the range of properties for each generic material available in the North American market.
Estimation of Water Ingress into the Wall Assembly
Based on the information gathered in the Review of Practice activity, several 2.44 m X 2.44 m test specimens of the wall assembly were built and subjected to a testing protocol that includes tests under air pressure differential, simultaneously combined with a water spray (simulating wind-driven rain). Each specimen includes three penetrations: a window, a vent duct and an electrical outlet. Certain deficiencies were included at the interface between these components and the wall. These deficiencies provide a path for water ingress into the stud cavity. For example, the deficiency selected for the development of an equation to estimate water entry rate into the stud cavity as a function of the spray rate and the pressure difference consisted of a 1 mm x 45 mm crack at the interface between an electrical outlet cover plate and the cladding. The responses of each wall specimen are measured in terms of air leakage rates and quantity of water that penetrates through the deficiencies and reaches the inside face of the sheathing board. These measurements provide experimental data to derive mathematical relations that correlate the quantity of rainwater entry with wind speed, wind orientation and precipitation according to weather data from any geographic location.
Parametric Analyses and Hygrothermal Responses
Using hygIRC model
A computer model called hygIRC is used to investigate the hygrothermal responses of wall assemblies. The model predicts (not absolute but on a relative approach) real-time response of the wall to changing environmental conditions and hygrothermal loads. It simulates simultaneous heat, air and moisture transfer. For each combination of the parameters, hygIRC provides the hygrothermal response of the wall assembly, at each hour. These responses at any selected point are quantified in terms of a temperature, a moisture content (or RH) and a pair of airflow velocity vectors.
The following four mechanisms of moisture transfer are considered in hygIRC analyses: - Vapour diffusion due to vapour pressure differences across the wall, as defined by the
weather records and indoor conditions.
- Wind-driven rain impinging on the exterior face of the cladding, as defined by the weather records and a prediction method to convert vertical rainfall to rain deposit on a vertical surface due to the prevailing wind.
- Unintentional rainwater leakage into the stud space, as derived from testing of full-scale wall specimens in a dynamic wall test facility and adjusted to the weather records.
- Vapour transport that accompanies natural and unintentional airflow across the wall, as defined by the weather records and through specified airflow paths respectively.
Input data
Based on the review of practice, the vertical cross-section of a full height one-storey wall (2.4 m high) is generated. The cross section includes all the material layers as well as top and bottom plates, at their nominal thickness (see page 7 for an example). This 2-dimensional cross-section is defined within hygIRC as a matrix of several hundred rectangular sections and grid points. This definition allows for the calculation of the spatial and temporal distribution of various hygrothermal responses.
Seven specific locations from Table 1 are selected to represent the broad spectrum of MI found in North America and the five climatic zones. These are: Phoenix (MI 0.13); Fresno (MI 0.49); San Diego (MI 0.74); Winnipeg (MI 0.86); Ottawa (MI 0.93); Seattle (MI 0.99) and Wilmington (MI 1.13).
From multi-year weather data files (up to 30 years), two years are selected for each location. These two years of climate data define the exterior environmental conditions prevailing at each location for the parametric analyses. One of these is called a “wet” year to represent the highest rain load and the other an “average” year to represent an average rain load, characteristic of the location. Hourly weather records from these two years are put together to define a three-year weather cycle in the following sequence: wet-wet-average.
The interior environmental conditions considered are temperature and relative humidity. A summer and winter setting of RH and T are simulated in accordance with ASHRAE recommendations.
Out of the database of material properties, three sets of properties for each generic material are selected; the mean value and the lower and upper limits are used as parameters in the analyses.
Simulation Runs
Before the parametric simulation runs start, a year is used to “condition” a given simulated wall to a wet year of local weather and hence to the natural hygrothermal loads only. Each material in that wall starts with equilibrium moisture content that corresponds to an exposure to an environment of 50% RH and the assembly does not include any deficiency that could lead to water leakage into the stud space. Thus, one year into the simulation, the wall assembly attains a state natural to the wettest local weather, however with no deficiency. The subsequent wet year and average year of simulation are then used to assess the response of the walls for two years. At this stage of the simulation the walls may include a deficiency that allows water leakage into the stud cavity2; the local weather conditions determine the rate of water leakage. Snap shots of the wall responses from these two years of the weather sequence are recorded every ten days. This yields 73 records of temperature, moisture content (or RH) and airflow velocities throughout the wall for each simulated case.
Analysis of the Hygrothermal Responses
The wood framing and the sheathing board are looked upon as the critical layers most susceptible to the detrimental effects of undesirable moisture accumulation during the service life of the wall. A sheathing segment, for example 1.4 mm thick and 0.6 m high above the bottom plate of the stud cavity for stucco walls, is identified as the region of interest for the entire sets of the “73 records” of responses obtained from the hygIRC simulations.
A novel concept called RHT Index is used to quantify and compare the localized response at the selected segment mentioned above. This index captures the duration of the coexistence of moisture and thermal conditions above a set of threshold levels, during an exposure period of two years. The threshold levels depend on the physical process that is of interest in regard to the durability of any selected material in the wall. Two sets of threshold levels are considered in MEWS. A combination of 95 % RH and 5 °C temperature (called RHT95) averaged along the segment is selected for its potential relevance to the growth of wood decay fungi. The second combination considered for MEWS is 80 % RH and 5 °C temperature (called RHT80) averaged along the segment for its potential relevance to corrosion processes. The cumulative values of the RHT index, over the two-year period, obtained from all the 73 records are used in all discussions in this report.
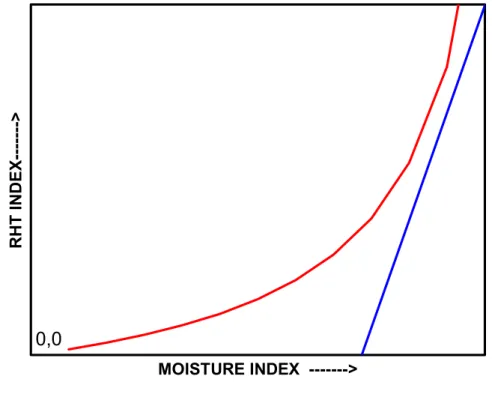
The graphical representation of the RHT response of a wall after two years of exposure to the local weather is presented in Figure 2. The blue line shows the behaviour of a wall with no
2
In the simulations, the water once enter the stud cavity can get out only through liquid and vapour diffusion; no drainage from the stud cavity is assumed.
deficiencies (or zero rainwater entry behind the sheathing), in response to the hygrothermal loads imposed by two years of local weather and indoor conditions. This blue line is characteristic for a given wall assembly of given set of material properties. The red line shows the wall’s response when an additional moisture load, for example in the form of water leakage into the same wall through a deficiency, is present. This latter curve will vary in shape and location on the RHT-MI plane, depending on the magnitude of that additional load.
Figure 2: Characteristic curves expressing the relationship between climate loading and moisture response of a wall assembly; the straight line represents an ideal wall construction with no water entry into the stud space whereas the curve represents a wall with deficiency.
Evaluation of the Wall Response
As indicated by the results from the parametric analyses, any strategy that brings the two curves in Figure 2 closer to zero RHT is a design consideration for better long-term performance of the wall.
These considerations can be any one or a combination of the following:
- Selection of materials with properties resulting in less wetting and/or better drying - Development and use of innovative materials with even better properties than above - Use of a drainage plane or drained and ventilated cavity between the cladding and the
sheathing
- Implementation of design details that reduce deficiencies or their impacts - Sheltering of the wall to reduce the moisture load on it
- Changes in the basic design of the wall system, as a last resort when other alterations are not sufficient
MOISTURE INDEX --->
RHT INDEX--->
Application to Stucco-Clad Walls
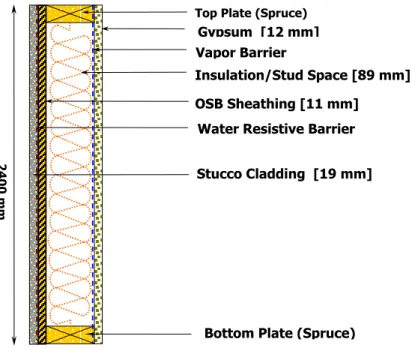
The basic design for a stucco-clad wood-frame wall, considered in MEWS analyses, is shown in Figure 3.
Top Plate (Spruce)
Gypsum [12 mm] Vapor Barrier
Insulation/Stud Space [89 mm] OSB Sheathing [11 mm]
Water Resistive Barrier
Stucco Cladding [19 mm]
2400 mm
Bottom Plate (Spruce)
Figure 3. Basic wall design selected for parametric studies of stucco-clad wall assemblies
The parameters considered for hygIRC simulations included the following: – seven locations in North America
– three types of stucco in terms of water vapour transport property – three levels of vapour permeance for vapour barrier
– three types of water resistive barrier (WRB or sheathing membrane) in terms of vapour transport property
– three types of OSB in terms of water vapour transport property – one plywood
– one fiberboard sheathing
– one basic level and location of water ingress (corresponding to a notional deficiency) into the stud cavity and five other variations of it
– one basic variation of the design with the introduction of a cavity behind the cladding – the above cavity, vented or non-vented
– one case of air leakage path between the exterior and interior – two sequences of three year weather exposure
– four levels of interior RH and temperature
A complete examination of all possible combinations of the parameters will amount to more than 200,000 simulations. Though necessary to assess fully the effect of each parameter, they could not all be accommodated within the scope of MEWS project. The decision was to select strategically a subset of the possible combinations. About 150 combinations were chosen for hygIRC simulations. The results from these simulations are discussed in detail in the companion document. Only a few salient features are presented here.
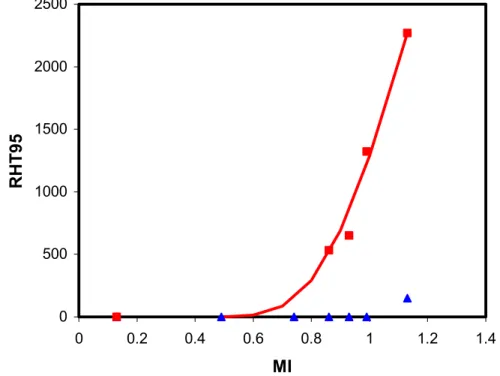
The most important features of the response of the wall shown in Figure 3, across North American climatic conditions, are presented in Figure 4 in which the index RHT95 is used. The
blue “triangles” show the characteristic response of a stucco-clad wall to driving rain and other climatic loads acting on the exterior surface of the wall. In this case no deficiencies that would allow water leakage into the stud cavity are present. Moisture is transported only through liquid and vapour diffusion across each material layer in the assembly. Air movement is restricted by the air permeance of each material layer. These transport processes respond only to the local weather and interior conditions. For all locations, except Wilmington, RHT95 is zero. For Wilmington it takes a value equal to 149. This indicates satisfactory service life for wood members in the deficiency free assembly for most of the regions in North America. As the MI approaches the upper limit, as indicated by the result for Wilmington with MI equal to 1.13, additional design considerations to control rain deposit on the exterior surface will improve the service life of wood and wood based members in the assembly.
The red curve in Figure 4 shows the characteristic response of the same wall, except with the deficiency present in the cladding. This deficiency effectively increases the moisture load into the wall, i.e. this opening in the cladding allows exterior water to enter into the stud cavity. Depending on the intensity of the wind and simultaneous rainfall, on an hourly basis, water enters in varying amounts through the opening. During the two-year simulations, for the most severe combination of high wind-speed and high rainfall that is found in the seven geographic locations selected, this additional load allows about a litre of water into the stud cavity in that severest hour.
0 500 1000 1500 2000 2500 0 0.2 0.4 0.6 0.8 1 1.2 1.4
MI
RHT95
Figure 4. The response of stucco clad walls to moisture loads in various climatic regions in North America; the “triangles” are for a deficiency free wall and the curve for the same wall with the notional deficiency assumed in MEWS.
The higher the RHT index, the longer is the exposure of the critical segment (1.4 mm x 600 mm of sheathing facing the insulated stud space, just above the bottom plate) to elevated moisture content and temperature. Figure 4 shows that this exposure increases exponentially with MI – and particularly so for MI higher than approximately 0.8. Information currently available in the literature associates certain levels of elevated thermal and moisture conditions with potential problems for wood-based products. Studies are underway to shed light on a correlation
between RHT95 and the long-term performance of such products. In the meantime, only a comparative analysis of the results is possible.
Analysis of Results
Results from the parametric study lead to observations similar to the following. These may lead to several design considerations for better moisture management.
Effect of Climate Severity
The magnitude of the response in terms of the RHT95 of the evaluated segment increases exponentially with MI. For the same combination of parameters (and deficiency), the RHT95s for Wilmington (warm and humid), Ottawa (cold and wet) and Phoenix (hot and dry) are approximately 2300, 650 and 0, respectively. Similarly for a given combination of parameters, for an ideal construction with no deficiencies, the above numbers are approximately 150, 0 and 0. This suggests that the design strategy for Wilmington should include enhanced protection of the walls from direct exposure to driving rain; simulations show that the RHT95 can be reduced to 9 from 150, with total shielding from rain, for a deficiency free wall in Wilmington. A wall with nearly zero deficiency may perform well in Ottawa even with direct exposure to rain; of course addition of shelters to deflect rain away from penetrations will lead to better moisture management.
Effect of Material Properties
Different climatic zones may benefit from use of different moisture management strategies through the selection of materials with certain properties. Various details can be found in the companion document. Two examples from the simulations are given below.
Liquid diffusivity and water vapour permeability are two properties of the stucco that are of great importance in controlling moisture loads of the wall. Simulations with a “theoretical” stucco material with higher water vapour permeance (comparable to that of mortar mix) coupled with much lower liquid diffusivity (in the range of that for wood in the longitudinal direction) than the stucco products characterised in the study can reduce the RHT95 of a deficiency free wall that is fully exposed to rain, even in regions of severe moisture loads like Wilmington (RHT95 dropped from 2300 to 8). This represents an opportunity for the development and application of innovative products.
The properties of four materials, viz. stucco, OSB, WRB and vapour barrier were used as parameters in the present investigation. The best combination of these materials has noticeable effect on the RHT95 values at various locations. For example, in Ottawa the worst combination of the above four materials gave RHT95 equal to 770 and the best combination 110. In these simulations the notional deficiency was present. In Wilmington the corresponding change in RHT95 is from 2300 to 960. These results indicate the potential for proper selection of material combinations to improve the service life of the assembly.
Effects of Cavity Behind Stucco
A cavity behind the stucco cladding offers several benefits to lower the RHT95 of the wall.
- Large-scale water ingress testing in IRC’s dynamic wall testing facility indicates that even small drainage channels (approximately 2 mm thick) can capture a large portion of the free water that reaches beyond the cladding, and bring it to a location for its evacuation to the outside. Such a drained cavity behind the stucco can result in a much lower moisture load in the stud space.
- A total separation of the cladding from the sheathing with a fully drained cavity (10 mm wide) does not admit water into the stud cavity. This was confirmed from the results in the dynamic wall testing facility; no water entered the stud cavity from the deficiency at the electrical outlet. For such a wall in Seattle, the simulation gave RHT95 = 0 in comparison with 1200 for the same combination of materials but without a cavity. This emphasises the advantages offered by fully drained cavities behind the cladding, in places like Seattle and Wilmington.
- Simulations indicate that ventilating any cavity (not necessarily fully drained and separated as above) between the cladding and the sheathing, using openings at top and bottom promotes evaporative drying. In Ottawa, for one combination of materials and with the notional deficiency, RHT95 was reduced from 390 to 4 in this case. In Seattle, the corresponding reduction is from 1200 to 150. Though these cavities can help, detailing of penetrations must still be made to prevent ingress of rainwater beyond the WRB.
Water Leakage into the Wall through Deficiencies
For the parametric analyses the notional deficiency that allows rainwater into the stud space is a 1 mm X 45 mm opening in one stud space. In the worst combination of rain and wind this may admit about one cup to a litre of water in one hour, depending up on the geographic location. In a cold climate, reduction of the effect of this deficiency to a quarter of the notional one has significant influence on the RHT. For example, in Winnipeg, for a given combination of parameters, the RHT95 was reduced from 530 to zero. This is true for Ottawa also where the RHT95 was reduced from 650 to nearly zero. For any locations with MI higher than both Winnipeg and Ottawa, such reductions in the size of the deficiency alone will not help to improve the performance. In Seattle the change for one wall is from 1300 to 320 and for Wilmington from 2270 to 1456. These indicate that for a concealed barrier wall, any level of rainwater penetration beyond the WRB should be avoided in locations such as Seattle and Wilmington.
Concluding Remarks
MEWS has resulted in an integrated methodology for assessing and predicting the long-term performance of any wall assembly at any location in North America. The methodology has been applied to stucco-clad wood-frame construction and several design considerations followed. The technical details that led to these considerations are given in the companion document “MEWS Methodology and Summary of Findings – Report T8-03”.
Though the effect of unintentional air leakage through the wall has been simulated, the information is not enough to make any general observation yet. The same is true with the level of vapour diffusion control needed in different climatic zones and for different indoor climates. We hope to follow up these issues at the Institute in future research projects.
In the remainder of MEWS project the approach presented here will be applied to Exterior Insulation Finish Systems, Masonry walls and walls with sidings.