READ THESE TERMS AND CONDITIONS CAREFULLY BEFORE USING THIS WEBSITE.
https://nrc-publications.canada.ca/eng/copyright
Vous avez des questions? Nous pouvons vous aider. Pour communiquer directement avec un auteur, consultez la première page de la revue dans laquelle son article a été publié afin de trouver ses coordonnées. Si vous n’arrivez pas à les repérer, communiquez avec nous à [email protected].
Questions? Contact the NRC Publications Archive team at
[email protected]. If you wish to email the authors directly, please see the first page of the publication for their contact information.
NRC Publications Archive
Archives des publications du CNRC
This publication could be one of several versions: author’s original, accepted manuscript or the publisher’s version. / La version de cette publication peut être l’une des suivantes : la version prépublication de l’auteur, la version acceptée du manuscrit ou la version de l’éditeur.
Access and use of this website and the material on it are subject to the Terms and Conditions set forth at Indoor climate in an open plan office: a comparison between measurements and CFD simulations
Zeng, J.; Shaw, C. Y.; MacDonald, R. A.
https://publications-cnrc.canada.ca/fra/droits
L’accès à ce site Web et l’utilisation de son contenu sont assujettis aux conditions présentées dans le site LISEZ CES CONDITIONS ATTENTIVEMENT AVANT D’UTILISER CE SITE WEB.
NRC Publications Record / Notice d'Archives des publications de CNRC: https://nrc-publications.canada.ca/eng/view/object/?id=0911aceb-eb00-4ef6-9e6e-88b1ce69d435 https://publications-cnrc.canada.ca/fra/voir/objet/?id=0911aceb-eb00-4ef6-9e6e-88b1ce69d435
Indoor climate in an open plan office: a comparison between measurements and CFD simulations
Zeng, J.; Shaw, C.Y.; MacDonald, R.A.
A version of this paper is published in / Une version de ce document se trouve dans : Proceedings of the 4th International Conference on Indoor Air Quality, Ventilation
& Energy Conservation in Buildings, v. 2, 2001, pp. 815-822
www.nrc.ca/irc/ircpubs
Indoor Climate in an Open Plan Office:
A Comparison between Measurements and CFD Simulations
J. Zeng
Zenastra Photonics Inc., Ottawa, Canada C.Y. Shaw and R. A. Macdonald
Institute for Research in Construction (IRC), National Research Council Canada (NRC) ABSTRACT
This paper presents the results of experimental measurements and computational fluid dynamics (CFD) simulations of the indoor environment of an open-plan office. The measurements were conducted in the Indoor Environment Research Facility (IERF) at IRC/NRC, in which six mock-up were setup to simulate an interior open-plan office. Two scenarios were investigated: isothermal and non-isothermal. The main focus of the isothermal case was on how to use measured data to specify the CFD boundary conditions for the supply air. Good agreement between the measured and predicted results was obtained for both the isothermal and non-isothermal cases.
INTRODUCTION
Numerical simulations based on CFD techniques have been increasingly applied to investigate ventilation, thermal comfort, and air quality in rooms [1, 2, 3, and 4]. To gain acceptance of the CFD results, a validation study is routinely carried out to determine the accuracy of the simulation results, particularly for cases with complex layouts of furniture and air diffusers. This paper presents the results of experimental studies and CFD simulations conducted on a mock-up open-plan office. The purpose was to establish the benchmark data for determining the accuracy of the simulation results, and assess the suitability of using CFD techniques to study the effects of workstation size, supply air diffuser locations, and workstation partition heights on the ventilation and indoor air quality conditions inside and outside individual workstations of open-plan offices.
This work is one of the tasks of a multi-year project to investigate the effects of reducing the size of workstations and increasing occupant density on ventilation, indoor air quality, lighting, acoustics and occupant satisfaction in open-plan offices [5].
EXPERIMENTAL FACILITY
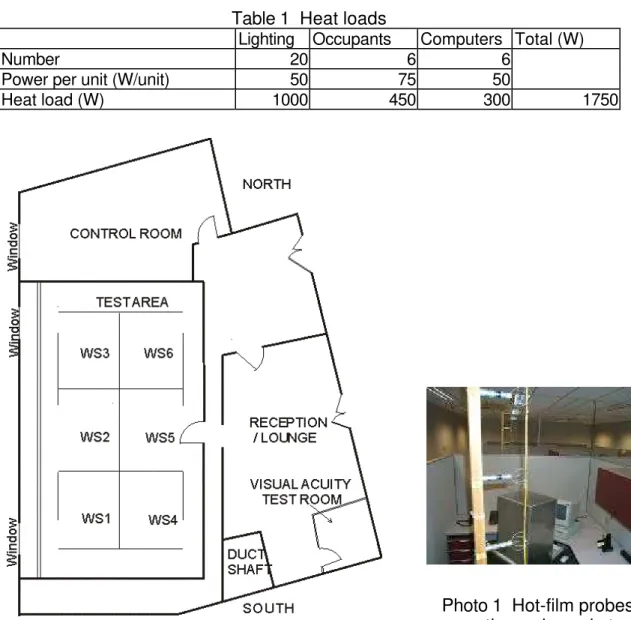
The experiment took place in a 12.2 x 7.3m indoor environment research facility (IERF), designed for acoustics, lighting, ventilation, and indoor air quality research [6] (Figure 1). For this experiment, the IERF was furnished with six mock-up workstations to
simulate a windowless open plan office space (Figure1). Modular systems furniture with 1.7 m partitions (66”) were used to provide six 2.8 m long × 2.1 m wide (WS1 to WS6) workstations. In addition, there were file cabinets and printers at both ends of the room. Each workstation had a computer with a 14-inch colour monitor. The furnishings and contents (tables, bookcases, and cabinets) of the workstations were identical. The ceiling light fixtures were 1'x4' 16-cell parabolic louvered fixtures with 2 lamps. Six linear ceiling supply air diffusers were used, one for each workstation. For this study, the linear diffusers were adjusted so that they discharged air straight downward to the floor. There were eight return air grilles on the ceiling. Figure 2 is a perspective view of this facility.
Six human body simulators were constructed to simulate the metabolic heat generated by office workers. For simplicity, the human body simulator consisted of three 25 W light bulbs and a mixing fan enclosed in a rectangular aluminum block. The rectangular block measured 0.45m long × 0.4m wide × 0.9 m high, which represents a standard adult with a surface area of 1.71 m2 [7].
MEASUREMENTS
The measurements were conducted under two conditions: isothermal and non-isothermal. For the isothermal condition, the focus was to determine the appropriate velocity boundary conditions of supply air diffusers. For both conditions, the return air was controlled at 23±0.5°C and 50±10% relative humidity.
The measured parameters included airflow rate, and velocity and temperature profiles. The supply air velocity was measured with a portable velocimeter. The vertical velocity and temperature profiles below the centre of each supply air diffuser were measured with hot-film probes and thermocouples (Photo 1). These measurements were conducted in two steps, each step covered three workstations.
CFD SIMULATIONS
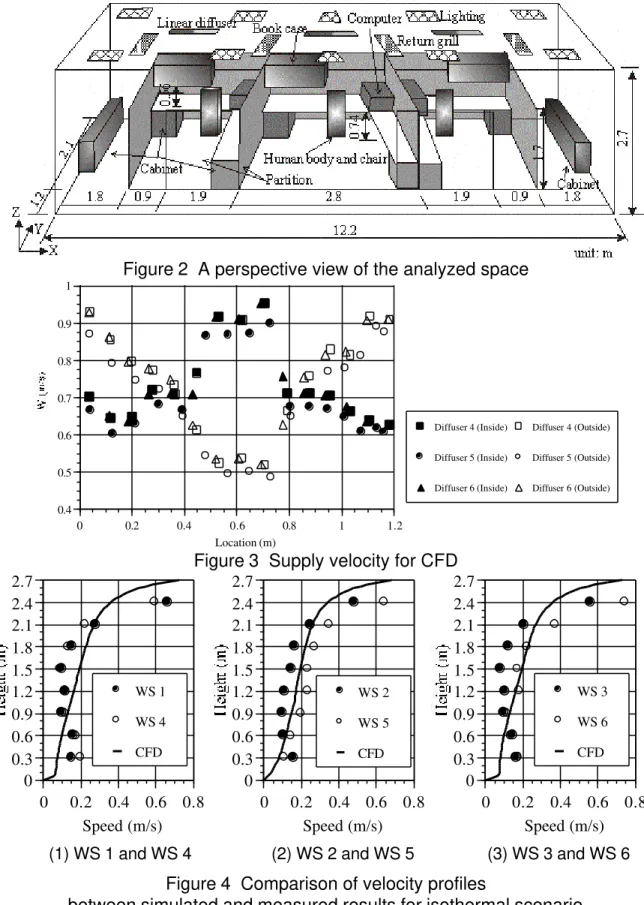
CFD simulations were performed under the same conditions as the experiments. Due to symmetry, only one-half of the space was considered, as shown in Figure 2. Based on Chen’s work [8 and 9], the Re-Normalization Group (RNG) k-ε model [10] was used for the simulations. In addition, the authors found that it was easier to get convergent solution with the RNG k-ε model than the standard k-ε model for this particular case. As the linear supply air diffuser had two slots, two grids were used. The aspect ratios of the grids in the whole space were less than 1:4. The grid numbers used were 157 (x) × 34 (y) × 34 (z). Other calculation conditions are described below.
ISOTHERMAL CONDITION
The linear diffuser had two slots. In this study, the diffuser had a vertical velocity component only, i.e., the air discharged downward to the floor. The velocity profile in the length direction for each slot was measured with a portable velocimeter. The results were use to determine the boundary condition for CFD simulations. Figure 3 shows the measured velocity profile for both slots. The turbulent intensity was estimated to be 50%.
The vertical velocity profile below the center of the linear diffuser was measured in each of the six workstations while the simulation was conducted for three workstations only. Thus, the measured data for each pair of symmetrical workstations are shown together in Figure 4.
Good agreement in the measured velocity profiles was obtained between each pair of workstations, particularly for workstations 1 and 4. The agreement between the predicted and measured results was also very good, particularly in the occupied zone, suggesting that the specified velocity boundary conditions were appropriate.
NON-ISOTHERMAL CONDITION
For the simulation runs under the non-isothermal condition, the velocity boundary conditions were assumed to be the same as the isothermal case. The supply temperature which was measured at 18.2°C was used as the thermal boundary condition for CFD simulations. Table 1 shows the heat loads in the space [11]. These data were used to define the heat boundary conditions for lighting, occupants and computer.
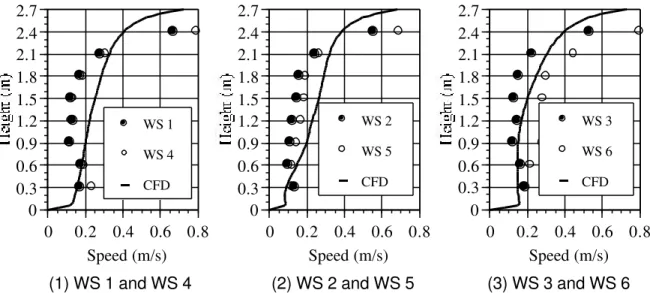
Flowfield - Figure 5 shows the predicted and measured velocity profiles. Good
agreement was obtained for the measured velocity profiles for each pair of symmetrical workstations. The simulated results also agreed very well with the measured results. Figure 6 illustrates the predicted velocity vectors under the non-isothermal condition. The supply airflow from the diffusers flowed straight downward to the floor. The airflow in the occupied zone was stronger than that of the isothermal case, as the supply air was cooler than the surrounding air (Figures for isothermal scenario are omitted). In addition, the airflow circulation around the heated body was also stronger than that for the isothermal condition. These two factors were responsible for a more active air circulation within the workstations in comparison with that under the isothermal condition.
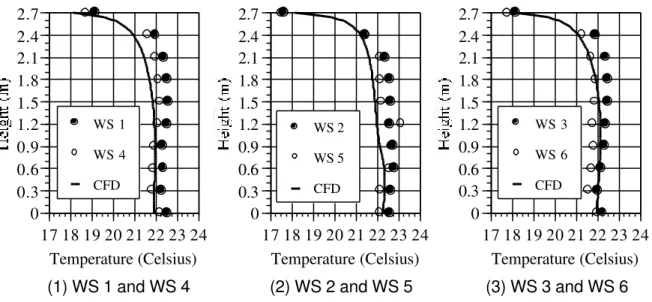
Temperature field - Figure 7 shows the simulated and measured temperature profiles.
Good agreement was obtained.
Figure 8 illustrates the temperature distribution in the space. The temperature underneath the diffuser was lower than that of the surrounding area. The temperatures
in the occupied zone varied from 22°C to 23°C, except for a small area where the temperature was below 22°C. The temperature distribution in the occupied zone was fairly uniform both inside and outside the workstations.
CONCLUSIONS
Good agreement was obtained between the measured and simulated results for both isothermal and thermal cases. Based on the results, CFD simulations will used mainly to determine the effects of diffuser layouts, workstation sizes, and partition heights on the ventilation and indoor air quality conditions of open-plan offices.
ACKNOWLEDGEMENT
This work is part of the COPE (Cost-effective Open Plan Environments) project sponsored by Public Works and Government Services Canada, Ontario Realty Corporation, USG Corporation, Natural Resources Canada, Steelcase, British Columbia Buildings Corporation, and the Building Technology Transfer Forum. The authors highly appreciate the valuable suggestions given by the COPE project members. The CFD simulations were conducted with a commercial code CFX 4 from AEA Technology Engineering Software Ltd.
REFERENCES
1. Murakami, S., S. Kato and J. Zeng. 1997. Flow and temperature fields around human body with various room air distributions, CFD study on computational thermal manikin (Part 1). ASHRAE Transactions, 103(1), 3-15.
2. Murakami, S., S. Kato and J. Zeng. 1998. Numerical simulation of contaminant distribution around a modeled human body, CFD study on computational thermal manikin (Part 2). ASHRAE Transactions, 104(2).
3. Murakami, S., S. Kato and J. Zeng. 2000. Combined simulation of airflow, radiation and moisture transport for heat release from a human body. Building and
Environment, 35, 489-500.
4. Chen, Q. Y. 1997. Computational fluid dynamics for HVAC: successes and failures.
ASHRAE Transactions, 103(1), 178-187.
5. http: //www.nrc.ca/irc/ie/cope
6. Shaw, C. Y., S. A. Barakat, G. R. Newsham, J. A. Veich, and J. Bradley. 1995. NRC indoor environment research facility. The 16th AIVC Annual Conference on Implementing the Results of Ventilation Research Proceedings, Palm Springs,
California, September 19-22.
7. ASHRAE. 1997. ASHRAE handbook - Fundamentals. Atlanta: American Society of Heating, Refrigerating and Air-Conditioning Engineers, Inc.
8. Chen, Q., 1995, Comparison of different k-ε models for indoor airflow computations,
9. Chen, Q., 1996, Prediction of room air motion by Reynolds-stress models. Building
and Environment, 31(3), 233-244.
10. Yokhot, V., Orzag, S.A., Thangam, S. Gatski, T.B., and Speziale, C.G. 1992. Development of turbulence models for shear flows by a double expansion technique,
Physics Fluids A, 4(7), 1510-1520.
11. Wilkins, C., M. H. Hosni. 2000. Heat gain from office equipment. ASHRAE Journal, 42(6), 33-43.
Figure 1 Indoor Environment Research Facility (IERF) Table 1 Heat loads
Lighting Occupants Computers Total (W)
Number 20 6 6
Power per unit (W/unit) 50 75 50
Heat load (W) 1000 450 300 1750
Photo 1 Hot-film probes and a thermal couple tree
Figure 2 A perspective view of the analyzed space 0.4 0.5 0.6 0.7 0.8 0.9 1 0 0.2 0.4 0.6 0.8 1 1.2 Location (m) Diffuser 4 (Inside) Diffuser 5 (Inside) Diffuser 6 (Inside) Diffuser 4 (Outside) Diffuser 5 (Outside) Diffuser 6 (Outside)
Figure 3 Supply velocity for CFD
0 0.3 0.6 0.9 1.2 1.5 1.8 2.1 2.4 2.7 0 0.2 0.4 0.6 0.8 Speed (m/s) WS 1 WS 4 CFD 0 0.3 0.6 0.9 1.2 1.5 1.8 2.1 2.4 2.7 0 0.2 0.4 0.6 0.8 Speed (m/s) WS 2 WS 5 CFD 0 0.3 0.6 0.9 1.2 1.5 1.8 2.1 2.4 2.7 0 0.2 0.4 0.6 0.8 Speed (m/s) WS 3 WS 6 CFD
(1) WS 1 and WS 4 (2) WS 2 and WS 5 (3) WS 3 and WS 6 Figure 4 Comparison of velocity profiles
0 0.3 0.6 0.9 1.2 1.5 1.8 2.1 2.4 2.7 0 0.2 0.4 0.6 0.8 Speed (m/s) WS 1 WS 4 CFD 0 0.3 0.6 0.9 1.2 1.5 1.8 2.1 2.4 2.7 0 0.2 0.4 0.6 0.8 Speed (m/s) WS 2 WS 5 CFD 0 0.3 0.6 0.9 1.2 1.5 1.8 2.1 2.4 2.7 0 0.2 0.4 0.6 0.8 Speed (m/s) WS 3 WS 6 CFD
(1) WS 1 and WS 4 (2) WS 2 and WS 5 (3) WS 3 and WS 6 Figure 5 Comparison of velocity profiles
between simulated and measured results for thermal scenario
0.25 m/s
(1) Central section of diffusers
0.25 m /s
(2) Plan at breathing level
Figure 6 Predicted flowfield for thermal scenario
Partition Occupant
0 0.3 0.6 0.9 1.2 1.5 1.8 2.1 2.4 2.7 17 18 19 20 21 22 23 24 Temperature (Celsius) WS 1 WS 4 CFD 0 0.3 0.6 0.9 1.2 1.5 1.8 2.1 2.4 2.7 17 18 19 20 21 22 23 24 Temperature (Celsius) WS 2 WS 5 CFD 0 0.3 0.6 0.9 1.2 1.5 1.8 2.1 2.4 2.7 17 18 19 20 21 22 23 24 Temperature (Celsius) WS 3 WS 6 CFD
(1) WS 1 and WS 4 (2) WS 2 and WS 5 (3) WS 3 and WS 6 Figure 7 Comparison of temperature profiles
between simulated and measured results for thermal scenario
23 23 21 22 22 22 23 22 22 21 21 23
(1) Central section of diffusers
23
22 22
(2) Plan at breathing level
Figure 8 Predicted flowfield for thermal scenario
Partition Occupant