Centralized Execution, Decentralized Control:
Why We Go Slow in Defense Acquisition
by John M. Mehrman
Lieutenant Colonel, United States Air Force
B.S. Mechanical Engineering, Rensselaer Polytechnic Institute, 1999 M.S. Aeronautical Engineering, Air Force Institute of Technology, 2006
Master of Military Operational Art and Science, Air University, 2011 SUBMITTED TO THE SYSTEM DESIGN AND MANAGEMENT PROGRAM IN PARTIAL
FULFILLMENT OF THE REQUIREMENTS FOR THE DEGREE OF MASTER OF SCIENCE IN ENGINEERING AND MANAGEMENT
AT THE
MASSACHUSETTS INSTITUTE OF TECHNOLOGY FEBRUARY 2018
2018 John M. Mehrman. All rights reserved
The author hereby grants to MIT permission to reproduce and to distribute publicly paper and electronic copies of this thesis document in whole or in part
in any medium now known or hereafter created.
Signature redacted
Signature of Author
el John M. Mehrman
System Design and Management Program 19 January 2018
Certified by
Signature redacted
Bryan R. Moser, Ph.D. MIT System Design and Management, Academic Di ector and Senior Lecturer University of Tokyo, Associate Professor Thesis Supervisor
Signature redacted
Accepted byMASSACHUSETS INSTITUTE Joan S. Rubin
OF TECHNOLOGY Executive Director, System Design and Management Program
JUN 2
0
2018
Disclaimer
The views expressed in this document are those of the author and do not reflect the official position or policies of the United States Air Force, Department of Defense, or Government
Centralized Execution, Decentralized Control:
Why We Go Slow in Defense Acquisition
By
John M. Mehrman
Lieutenant Colonel, United States Air Force
Submitted to the System Design and Management Program on 19 January 2018 in partial fulfillment of the requirements for the degree of Master of Science in Engineering and
Management
Abstract
The slow pace to field new defense weapon systems is allowing potential
adversaries to catch up to the technological advantage the U.S. has maintained since
World War 11. Despite hundreds of studies, and a near constant state of "acquisition reform", the problem continues.
This research analyzed the defense acquisition process as a socio-technical system, focusing on the source selection process as subset of the Defense Acquisition System (DAS) for modeling purposes to investigate the value of the separation of contracting and program management authorities. Network graphs showed how Conway's law predicted the effect of the separation of authorities on the topographic structure of the source selection process and a high network distance between the separate authorities. An agent-based model was built that showed a 26% cost (112 days) in terms of schedule because of the separation of authorities. The benefit of the separation was investigated by scoring the comments received by the Multi-Functional Independent Review Team (MIRT) for five different source selections and found that
less than 1 % of comments had a likely impact on the decision and less than 4% had a
likely or highly likely impact on protestability.
The results showed that while there is a small benefit to the separation of
authorities currently implemented in the source selection process, the cost is very high. Enough data and evidence were generated to recommend taking steps to better
structurally combine the two authorities and better integrate source selection expertise into the process.
Thesis Supervisor: Bryan R. Moser
Acknowledgements
First, I want to thank the Air Force, for giving me yet another opportunity to grow and learn. The opportunity to spend a year at MIT to recharge, reflect, and prepare academically for the next stage of my career has been invaluable.
I want to acknowledge my colleagues and friends in the Air Force acquisition community that provided immensely valuable thoughts, data, and most importantly, their valuable time, supporting this project. Lieutenant General Arnold Bunch from SAF/AQ, John Weyrick, Kelly Shackelford, and Chris Hampton in the F-16 program office, Jason Cedek and Barry Foster in the AFLCMC ACE office, David Hall, Nick Braun, Gail Krentz, and Captain Joey Baza in AFLCMC/PK, James Clift from the AFLOA, and Lieutenant Colonel Chad Searle from the AFNWC.
The entire faculty, staff, teaching assistants, and fellows of the System Design and Management program have been enormously supportive. Not only did they welcome my ideas, but they also shared their fascinating insights and stories that helped me navigate the challenging curriculum and better understand this complex world we live in. I especially want to thank Joan Rubin and Bill Foley who
enthusiastically supported me when I inquired about continuing from the certificate program to pursue the full master's degree.
I also wanted to thank Bryan Moser for welcoming me to his Global Technical Leaders research group and advising me during the thesis. The amount of time and patience he gave to guide me through the long research process was remarkable. His passion for seeking a better understanding of the management of complex systems and sharing with others is truly inspiring.
Lastly, I wanted to thank my wife and son for their endless support,
encouragement, and the extra moves. Being a military family isn't the easiest, but we have been able to share many amazing opportunities because of it. Your love and support is all I need in life.
Table of Contents
A bstract
...
5
Acknow ledgm ents
...
7
Table of Contents ... 9 List of Figures ... 11 List of Tables ... 12 Introduction ... 13 Motivation ... 13 Defense Acquisition ... 14
The Army "Null" Program ... 17
Problem Statement ... 18
Background and Related Research ... 23
DAS Background ... 23
Acquisition Reform ... 28
Hypothesis ... 31
Model Selection ... 34
Defining Value ... 37
Determ ining Cost ... 40
Determ ining Benefit ... 46
A nalysis ... 53
System Definition ... 53
S ta k e h o ld e rs ... 5 6 Source Selection Process ... 62
Orient ... 67
Stakeholder Value Network ... 68
N e tw o rk G ra p h ... 7 1 Cost ... 73
T e a m P o rt M o d e l ... 7 4 TearnPort Baseline Model Forecast ... 81
Source Selection Design W alk and Cost Results ... 85
Benefit ... 91
Air Force Protest Analysis ... 92
P ro ce s s B e n e fi ts ... 9 3 Conclusions ... 99
Summary of Benefit...101
Value of the Separation of Authorities ... 103
Additional Conclusions...105
Recom m endations and Future Research
...
109
Recommendations...109
Take More Risk in the Source Selection Process ... 109
E x p a n d th e A C E ... 1 12 Use ABMs and Project Design for Schedule Development...113
Future Research ... 114
U nd e rsta nd ing B e nefit...114
Examination of Protests ... 114
Coordination Distance - Separation of Authorities...115
G lossary
...
117
List of Figures
Figure 1. DoD Decision Support Systems (Defense Acquisition University 2017) ... 15
Figure 2. DoD Decision Process in 5 Dimensions (Defense Acquisition University 2017)... 16
Figure 3. Integrated Defense Acquisition Life Cycle Management System (Shachtmon 2010) ... 17
Figure 4. John Boyd's O-O-D-A Loop (Osinga 2005)... .... 20
Figure 5. Phases, Milestones and Decision Points of the DAS (AcqNotes n.d.)... 24
Figure 6. Output Measures of the DAS (USD(A T&L) 2016)... 24
Figure 7. DAS Program Tiered Chain of Command (Defense Acquisition University 2017) ... 25
Figure 8. Major Defense Acquisition Reform Studies and Initiatives (McNew 2011) ... 29
Figure 9. Outcome Measures of the Source Selection System...38
Figure 10. TeamPort A BM Software Symbology (Global Project Design 2016)...44
Figure 11. TeamPort ABM Software Architecture View (Global Project Design 2016)...46
Figure 12. Source Selection Value D iagram ... 47
Figure 13. Example Comment from Air Force Source Selection CRM ... 50
Figure 14. High Level Source Selection Process Diagram ... 54
Figure 15. AFLCMC Source Selection Standard Process - Key Decision Points (AFLCMC/AQ 2013) ... 64
Figure 16. AFLCMC Source Selection Standard Process (AFLCMC/AQ 2013)...66
Figure 17. Source Selection Stakeholder Value Network (SVN)...70
Figure 18. Source Selection Process Network Graph - Yifun Hu Algorithm...72
Figure 19. Baseline TeamPort Model Stakeholder Organization ... 76
Figure 20. Baseline TeamPort Model Product Breakdown Structure ... 77
Figure 21. Baseline TeamPort Model Activities and Phases (1 of 2)... 78
Figure 22. Baseline TeamPort Model Activities and Phases (2 of 2)...78
Figure 23. Baseline TeamPort Source Selection Model Sketch ... 80
Figure 24. AFLCM C Source Selection Design Tradespace ... 87
Figure 25. Source Selection SVN Separation of Authorities Evolution ... 90
Figure 26. Source Selection Network Graph Separation of Authorities Evolution ... 91
Figure 27. Air Force Competitive Action Protest Rate and Protest Effectiveness (AFLOA 2017) ... 92
Figure 28. Sam ple CRM Scoring Sheet...94
Figure 29. Com bined Com m ent Im pact Pie Charts ... 97
Figure 30. Value of the Separation of Authorities in Source Selections ... 103
List of Tables
Table 1. Source Selection CRM Scoring Scale... 50
Table 2. Baseline TeamPort Model Stakeholder Team Sizes ... 75
Table 3. Team Port Baseline Process Project Design - Activity, Work Effort, Contracts ... 79
Table 4. TeamPort Baseline Process Project Forecast - Schedule, Work, Coord ... 83
Table 5. TeamPort Baseline Process Total Work Forecast...84
Table 6. Source Selection Process Tradespace - Separation of Authorities ... 86
Introduction
The Congress has grown increasingly concerned that the U.S. military technological advantage is eroding as great power competitors modernize their militaries to counter our ability to project power. Part of this erosion is due to the defense acquisition system, which has grown too risk-adverse, takes too long, and costs too much to innovate, develop, and field new capabilities (McCain, 2017).
-Senator John McCain
Motivation
The U.S. defense acquisition system (DAS) is too slow. The U.S. military relies on a qualitative technical advantage to defend ourselves and our allies. This strategy has served the U.S. well since WWII. We have been able to secure the nations interests despite a decreasing number of military personnel, planes, ships, and tanks. However, the government process for acquiring new military technologies has become increasingly bloated with multiple sources of process overhead. It is not uncommon for major programs to take 10-15 years to field a new system. For perspective, shortly after Alan Sheppard's first U.S. manned flight into space, President Kennedy announced his vision to land a man on the moon. It only took 9 more years to fulfill his vision. Other
nation states have closed the technological gap, especially as the information age has lessened the barriers to knowledge transfer. In short, our current acquisition system is threatening the ability of the U.S. to maintain its technological advantage and to ensure the nation's defense.
Defense Acquisition
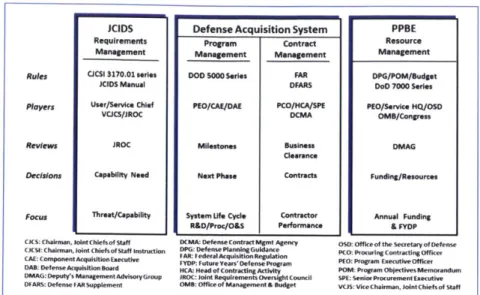
New systems are acquired in the Department of Defense (DoD) through the combination of three distinct processes as shown in Figure 1: The Joint Capabilities Integration and Development System (JCIDS), the Planning, Programming, Budgeting, and Execution (PPBE) process, and the Defense Acquisition System (DAS). Together, they are referred to as the "DoD Decision Process" or for acquisition simply the Big "A".
JCIDS defines the operational requirements for the system based upon inputs from the
commands that use the systems. PPBE is the process by which the annual defense budget is planned and executed, covering the next 5 years of activities although only one year is authorized and appropriated by congress annually. The DAS is the process the defense acquisition community uses to develop, produce and field a system, usually through the contracting of private companies. The DAS is also referred to as the Little "a" to denote that the full acquisition process requires the other two DoD decision processes to field a capability.
Figure 1. DoD Decision Support Systems (Defense Acquisition University, 2017)
All three processes need to operate in unison to field a desired capability.
Imbalance between requirements, funding and acquisition strategy for a weapon system lead to program failure, and keeping the three aligned can be difficult. The five
dimensions of the DoD Decision Support System can be seen in Figure 2 which illustrates the complexity involved in aligning the various regulations that define the processes and the numerous stakeholders involved. While cumbersome, this decision system has fielded some remarkable capabilities that have kept the U.S. at the forefront of military power in the world. The current Big A dates largely back to the 1960s when Robert McNamara was Secretary of Defense and sought to better organize how the DoD conducted business, making it more like a corporation. In fact, yet another name is "the corporate process".
CJCSi 5123.01 CJCS 3170.01 VCJCS/JROC Oversight Joint CaPabilkies - "neration and Development System (Joo") Planning, Debinse Plogramming,
Acquisition deti, and
system Euecution (PPSE)
Process
DoDD 5000.01 DoDD 7045.141 DoDI 5000.02 DEPSECDEF Milestone Decision Oversight
Authority (MDA) Oversight
JCIDS
Requirements Management
Rules CJCSI 3170.01 series
JCIDS Manual
Players User/ServIce Chief
VCJCS/JROC
Reviews JROC
Decisions Capability Need
Focus Threat/Capability
OJCS: Chairmn. iontChlefsof Staff CJSI: Chaina soint Chiefsof Staff instruction CA: ComponentAcquisitionEscutive OAR: Defense Acquisdtoyoard DMAG: Deputy's Managemnent Advisory Group
DrARS: Defense FAR Supplemnent
Defense Acquisition System
Program Contract Management Management
DOD 5000 Series FAR
DFARS
PEO/CAE/DAE PCO/MCA/SPE DCMA Milestones Business
Clearance Next Phase Contracts
System ef Cycle Contractor
R&o/ProC/O&S Performance
DCMA: DefenseContract Mpmt Agency DPG: Defense Planning Guance FAR: Federal Acquisiton ReuLtion
FYDPr Future tes Defense Prsgram
JCR: Heed of Contracting Acts
JROC: Joint Rtequiremnents oversight Council 0O.4: Office of ManagementS, Budget
PPBE Resource Management DPG/POM/Budget DoD 7000 Series PEO/Service HQ/O5S OMB/Congress DMAG Funding/Resources Annual Funding & FYDP
OSO: Officeof the Secretaryof Defense PCO- Procurinsg Contracting Officer
PEO: Program Executiveoffcer
PONI: Program 0blectfves Memorarmi SUE: SeniorProcuremnt Eecstlv VCJS: ViceChairmas. JottChlefsof Staff
Figure 2. DoD Decision Process in 5 Dimensions (Defense Acquisition University, 2017)
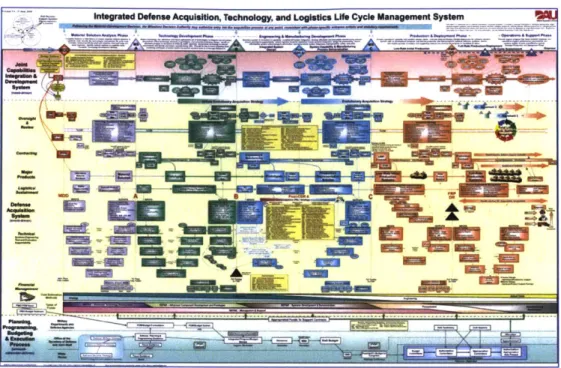
The DAS alone is an enormously complex process. The Defense Acquisition University (DAU), where all acquisition professionals in the DoD are trained for their position, publishes a wall chart that shows the process. It is unreadable in any form smaller than about 3 X 2 feet. That wall chart is shown in Figure 3 in a size much smaller, but you don't need to be able to read it to see the complexity of the process. Looking at it from afar, it's amazing that anything gets fielded. This version was found on the web in an article titled, "Pentagon's Craziest PowerPoint Slide Revealed"
(Shachtman, 2010). The DoD had to create DAU just to teach the unique complexity of the DAS process.
Integrated Defense Acquisition, Technology, and Logistics Ut. Cycle Management System
Figure 3. Integrated Defense Acquisition Life Cycle Management System (Shachtman, 2010)
The Army "Null" Program
In 2011, facing pressure to reduce the schedule on a new ground vehicle, the Army Ground Combat Systems (GCS) office conducted a baseline program review to find efficiencies and reduce timelines for major defense acquisition programs. Their baseline program was 16.5 years from the development decision to full rate production for a single variant ground vehicle system with limited technology development. This was unbelievable and unacceptable to many in the DoD. By the time you field a
decade and a half including the capability gap and threats that were trying to be addressed.
The Army GCS office went further and build a baseline schedule that removed all of the design, build and test activities from the schedule. This left only the DAS required documentation, reviews, and processes. They called it the "null program" and they came up with 10 years (Polsen, 2011). For a Major Defense Acquisition Program (MDAP), they showed that the fastest you can go through the DAS process, without actually producing anything, is 10 years. These are enormously complex systems, but the current DAS process matches the complexity of the weapon system with the complexity of the bureaucracy to support it.
Problem Statement
For all of its problems, the DAS has delivered some of the most complex and technologically advanced systems in the world. Systems that have changed the nature of defense and for some, society as a whole. Successful systems such as ICBMs, nuclear submarines, the global positioning system, space surveillance and
communication, precision guided munitions, and unmanned aerial vehicles were
delivered using the DAS. However, as more layers of bureaucracy and oversight have been added to the process over the years, the system has slowed to glacial speed. As an example, the F-35 Joint Strike Fighter program awarded a system design and development contract to Lockheed Martin October of 2001 and achieved first flight in December of 2006 (Joint Strike Fighter Program Office, n.d.). It has been over 16 years
since contract award, and the system has still not reached initial operational capability with the U.S. Air Force.
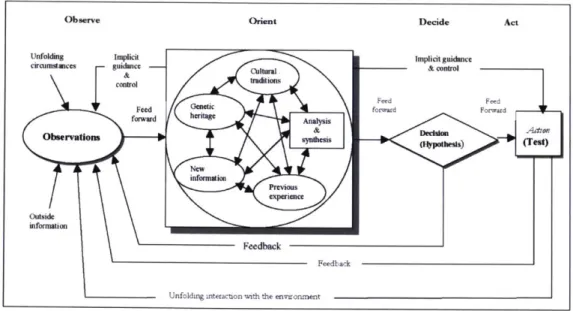
John Boyd, an Air Force fighter pilot and strategist, developed a framework of the decision-making process that can be applied from the individual to the national level called the "OODA" loop, shown in Figure 4. He studied systems theory amongst a wide and eclectic mix of disciplines and drew his OODA loop like a controls diagram with inputs, output and feedbacks. His model generally follows the scientific method, and starts with observing, where you are gathering data from the environment. Next comes orientating, where analysis and synthesis of the observation is combined with your previous experiences, knowledge and biases. Lastly a decision is made based upon a hypothesis and turned into action or a test. Feedback loops connect the model
elements to form a continuous process. When applied to warfare, Boyd hypothesized that to win you, "should operate at a faster tempo or rhythm," than your adversary's OODA loop (Osinga, 2005).
Observe Orient Decide Act
circumstaces -- guidac -- 1 11 cnto
control in
Feed Genetic forwad Forwr Id
ObNrvtanrd, heritage (Taysi information Peiu Cxperiance iormation Fftdback Feedb-ack
Unfoldig uiteraction with the environment
Figure 4. John Boyd's O-O-D-A Loop (Osinga, 2005)
Viewing the DAS through the perspective of John Boyd, our adversaries are now able to operate and react to our DAS OODA loop faster than we can get through it. The
technological advantage we built through the Cold War, culminating in our complete dominance in the first Gulf War, has eroded as we have been mired in Afghanistan and Iraq as part of the Global War on Terrorism. The forces of globalization and the world wide web have increased the speed of knowledge and technology dispersion, and are further enabling our adversaries to catch up to our technological advantage quickly. Comparing Chinese 5th Generation fighter development to the F-35, the Chinese J-20 fighter achieved first flight in January 2011 yet was just declared operational in October of 2017 (Gady, 2017). That is almost double the speed of fielding the F-35.
Our adversaries are able to react more quickly than we can and if we don't change how we field new weapons, they will soon overtake our technological advantage. This leads to the problem statement of this research:
System Problem Statement
To improve Air Force acquisition timelines while maintaining a technological advantage,
By analyzing the DAS as a system and investigating its dynamics, Using systems analysis tools and methodologies
Background and Related Research
Organizations which design systems... are constrained to produce designs which are copies of the communication structure of these organizations. (Conway, 1968)
-Melvin E. Conway
DAS Background
As discussed previously, the DAS is an enormously complex bureaucracy of people, regulations and processes. The U.S. spends around $500B a year on defense with about $100B going to the USAF. The 2017 President's Budget request for the DoD included $71.7B for Research, Development, Test and Evaluation and another $112.OB for Procurement for the year. Acquisition is big business. The DAS is organized around
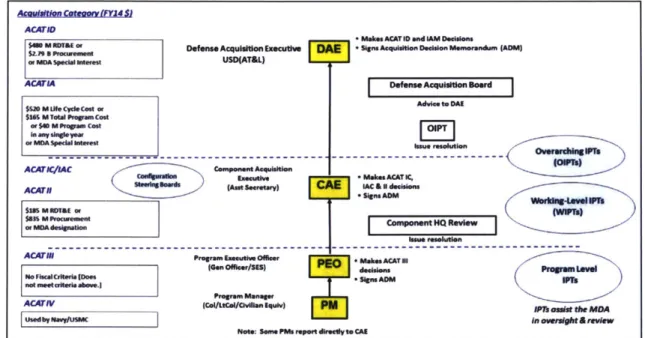
milestone decision points (A, B, and C) where the program is fully evaluated by a designated Milestone Decision Authority (MDA) to determine if it should proceed to the next phase. A diagram of the DAS phases and milestones is shown in Figure 5.
A
MAnesisl Aemid w MOO mu~ OperatloawS T.cImoIawU.bnmIon& TeUlkn"f RMaldnwM& CDD 0e PO a FP I Pre-Systamn AcquisitionsA
Engineerimg& Mantimcdbi kwelPmInA
Production& Deplonient FijiRate IP (F Prodcbon Opara~laDi Tea on Emkubm (TE NcLeaend =Decision Point = Milestone Decision
)
= Major ReviewFigure 5. Phases, Milestones and Decision Points of the DAS (AcqNotes, n.d.)
A system diagram of the DAS is shown in Figure 6. The outputs of the DAS are programs whose properties include cost, schedule, and performance. Value to the department is measured by the balance of those properties (USD(AT&L), 2016). That is a broad definition of value and will require further clarification to be useful for analysis.
UDAP program and Contract analysis
knput oua rpre outcomnes
Te Defense 4 otValU*
Acquisition System - Schedule to the
#31efrIMnnM Deparhment
Figure 6. Output Measures of the DAS (USD(A T&L), 2016)
The DAS system is described by policies, regulations and guidance captured in DoDD 5000.01 The Defense Acquisition System (USD(AT&L), 2007) and DoDI 5000.02
Operation of the Defense Acquisition System (USD(AT&L), 2017). The DAS uses a
tiered approach to oversight, with higher cost programs receiving more oversight. Each support FC Sustainment Systems Acquisitions W 0 0.a is " "
program is assigned an Acquisition Category (ACAT) level that is based upon the total estimated RDT&E and Procurement funding needed to field the system. ACAT I programs are the largest and are also referred to as Major Defense Acquisition Programs (MDAP) or Major Automated Information Systems (MAIS) for information systems (Defense Acquisition University, 2017). In the 2017 PB, MDAP/MAIS
programs accounted for 40% ($72.7B) of all RDT&E and Procurement funding for the DoD (USD(AT&L), 2016).
Figure 7. DAS Program Tiered Chain of Command (Defense Acquisition University, 2017)
The levels of oversight and authorities that correspond to each ACAT level can be found in Figure 7. The general line of authority for a program runs from the Program
ACA$NCOMMMItvFY11
sk= M .k ACAT 10 md AM Dem1.ns SLiaE P,.aamm Defens, Acquilion Executiv ftE -i d1.u, DAqih n Mewmmm.6dm (ADM)
or ud hRwin USD(AT&L)
ACAIM DOW Aapddtm Board
SWO M We Cy*Caest
7
SM TouPo Cast
ImamysweIh FO
Kneou- M (-.3u
Susmiraw. * MakinACAT IC, 3bu dsw (AntSew-twVy) C AC & I deebi
(: fgna ADM
Sm MWAE oF (WW"
$us5 M feremeuI
AgCEIT/ * MakS ACAT N
NonbmCrimI. rAt m a Wt .Dom * AM Ph
Ndabo.o
AC~r#V JeVCAI/c.UCan IPL~) W at athe MDA
CIn Oersight &eview
Manager (PM) to the Program Executive Officer (PEO) who generally has a portfolio of programs in a certain area such as the AF PEO for Fighters and Bombers. PEOs report to the Service/Component Acquisition Executive (SAE/CAE) who is an Assistant
Secretary in the Air Force. The SAE/CAE reports to the Defense Acquisition Executive (DAE) who is responsible for all acquisitions in the DoD and is the Undersecretary of Defense for Acquisition, Technology, and Logistics (USD(AT&L)).
The DAS manages risk through oversight, under the premise that the larger the program, the higher the consequence of a mistake or failure. The ACAT level
determines who the Milestone Decision Authority (MDA). An MDA is assigned for each program and has the statutory authority to decide when a program is ready to move to the next phase of the DAS. They document decisions and guidance to Program
Managers through Acquisition Decision Memorandums (ADMs). The larger the program or ACAT, the higher up the acquisition chain of command the MDA will be and the more layers of oversight will be applied.
However, adding more complexity to the DAS, there is another authority chain that has not yet been discussed. As shown back in Figure 2, contracting authorities in the DAS are separate from program management. The other two DoD decision
systems do not have this separation of authorities. Almost all defense acquisition
programs require contracts to execute. The general acquisition model of the U.S. is that private companies develop and build end-items for the government. Contracts are agreed upon between the government and these companies to deliver goods and/or services. In FY15, the DoD contracted for $132.6B of supplies and equipment and $146.5B of services (USD(AT&L), 2016). Not all of these contracts are in support of the
acquisition system, but point to the magnitude of transactions that the contracting management chain is responsible for each year. Regulations for contracting are captured in the Federal Acquisition Regulations (FAR). Supplements for the DoD (DFARS) and Air Force (AFFARS) include additional guidance specific to the agency (Federal Acquisition Regulations, n.d.).
FAR subpart 1.6 outlines the authorities and responsibilities of a contracting officer. Only contracting officers have the authority to enter into, administer or terminate a contract. Contracting authorities are delegated from the head of a government
agency (Secretary), often through multiple levels, to the contracting officer through the SF 1402 Certificate of Appointment, otherwise known as a Warrant. The Warrant appoints the contracting officer and provides specific limits on their authority. They can then bind the government, within the limits documented in laws, regulations, and their SF 1402, to pay for the product or service per the terms of the contract. Contracting officers are responsible for ensuring performance of all necessary actions for effective contracting, ensuring compliance with the terms of the contract, and safeguarding the interests of the U.S. in its contractual relationships. In addition, contracting officers are responsible for ensuring that contractors receive impartial, fair, and equitable treatment (Federal Acquisition Regulations, n.d.). Because of the separation of authorities in the DAS, a successful relationship between a program manager and contracting officer is crucial for program success.
Acquisition Reform
Defense acquisition is often criticized for its cost, schedule, and performance shortfalls. The DAS has been in a near constant state of reform since the Office of the Secretary of Defense was created in 1947, with over 150 significant "studies" conducted on acquisition reform since WWII (Reeves, 1996). A 1970 study found that there were 79 different offices issuing acquisition policy leading to 30,000 pages of regulations. During the Cold War build-up in the early 1980s, major weapon system cost growth was especially bad, and the pace of reform increased (Schwartz, 2013). Many of today's acquisition reform initiatives date back to the Packard Commission Report, which arguably led to the most impactful changes to the DAS (McNew, 2011). A summary of the major studies and initiatives is shown in Figure 8.
Year Major Defense Acquisition Reform Study or Initiative 1949 Hoover 1 1953 Rockefeller Committee 1953 Hoover 2 1961 McNamara Initiatives 1970 Fitzbugh Commission
1972 Commission on Government Procurement
1983 Grace Commission
1985 Packard Commission
1989 Defense Management Review
1993 Section 800 Panel Report
1993 National Performance Review
1994 Federal Acquisition Streamlining Act (FASA)
1996 Clinger-Cohen Act
1997 Defense Reform Initiative
2000 The Road Ahead
2001 Rumsfeld Reform Vision
2005 Defense Acquisition Performance Assessment (DAPA)
2009 Weapon System Acquisition Reform Act (WSARA)
2010 - Pres Better Buying Power (BBP) 1.0 to 3.0
2016 - Pres Section 809 Panel
Figure 8. Major Defense Acquisition Reform Studies and Initiatives (McNew, 2011)
There are many excellent reviews of the various acquisition reform initiatives. Instead of reviewing the details of the initiatives here, several previous reviews are included in the bibliography. There are some general trends within the studies that are worth mentioning related to this research. The first, is that the studies often oscillate between recommendations. The preference for cost or fixed price contracts for development has switched about every ten years (Cancian, 1995). The various
initiatives have also oscillated between centralized control of acquisition under OSD and decentralized control with OSD in more of an oversight role (Reeves, 1996). The
oscillations show that the system is overcorrecting to undesired system output. In control theory terms, the gain is too high for the time constant of the system leading to overshoot and instability. The second general trend is the opposite, that often the same recommendations are made throughout the years (McNew, 2011). This indicates that the underlying cause is never really acted upon. One consistent recommendation is the consolidation and reduction of the bureaucracy and regulations that govern acquisition. While a few initiatives have actually succeeded in reducing regulations, such as the Federal Acquisition Streamlining Act (FASA) of 1994 which resulted in the creation of the Federal Acquisition Regulations (FAR) (Schwartz, 2013), they continue to still be viewed as too many and yet continue to grow. The latest acquisition reform initiative, the Section 809 panel, has been specifically tasked with reviewing acquisition
regulations and recommending for elimination those not necessary to meet the overall objectives of the system (Advisory Panel on Streamlining and Codifying Acquisition Regulations, 2017).
Despite the numerous reform efforts, development contracts have experienced a median cost growth of 32% since 1993 (Schwartz, 2013). Everyone from congress to the Service Chiefs still complain that the system is broken - too slow, too expensive, and too complex (Hebert A. , 2017). In fact, several have argued that rather than improving the system, acquisition reform efforts have made the DAS less effective and efficient. (Schwartz, 2013) "In an attempt to not repeat past failures, additional staff,
processes, steps, and tasks have been imposed. While well intended, collectively these modifications are counterproductive" (U.S. Army, 2010).
The last general trend of these initiatives is that they have led to minimal effective and lasting changes to the DAS. These panels are generally conceived by asking a collection of subject matter experts (SMEs) related to the acquisition of complex systems to convene a panel and recommend changes. This usually includes former senior acquisition executives, high ranking operational military commanders, business executives and maybe someone from academia to sit on panel and hypothesize on what the problems could be by looking at the current architecture of the system and the high-level output data. Very few of the recommendations are based on a scientific approach that involves generating a hypothesis and then testing based on a theory of and underlying mechanism with empirical data. Instead, the panels make a bunch of recommendations, some are implemented fully or partially, and then the results at the highest-level outputs are measure several years later. The DAS is still not functioning as desired and it's extraordinarily difficult to trace the effectiveness of any single recommendation to the overall output of the system. Then, commission another
acquisition reform effort and the continuous process of acquisition reform begins anew.
Hypothesis
This research aimed at going deeper by looking at the dynamics of the DAS and how the multitude of parts interact to develop and produce a system. Given the
complexity of the DAS, this was a lofty goal. To start, a hypothesis needed to be developed to test against. The Air Force recently commissioned the Air Force Science
Board for yet another study of the DAS titled "Owning the Technical Baseline for Acquisition Programs in the U.S. Air Force." The group was tasked to make
recommendations so they USAF could better "own the technical baseline for its
acquisition programs." The general feeling was that USAF acquisition program offices had lost the capability to provide close technical oversight of contractors building the next generation of weapon systems. One of the recommendations was to clarify the roles and authorities of the program manager (PM) and contracting officer (CO). The view was that the current mix of authorities and accountabilities, "are causing a dysfunctional, as opposed to creative, tension, which is negatively impacting
government acquisition team effectiveness." Expanding, the team concluded that the bifurcation of the PM and CO communities has resulted in two chains of authority managing a program (Air Force Studies Board, 2016).
This was an interesting perspective and hypothesis, but no data was presented to justify the position. Clearly this recommendation required a deeper look into the mechanisms of interaction among teams in a system to really understand the tradespace. Thus, the following research hypothesis was developed:
Hypothesis
The current extent of the separation of contracting and program management authorities in the Defense Acquisition System has a
Research Methodology
More than ambition, more than ability, it is rules that limit contribution; rules are
the lowest common denominator of human behavior. They are a substitute for rational thought. (Rickover, 1954)
- Admiral Hyman Rickover
Model Selection
One definition of a complex systems is that it, "has many elements or entities that are highly interrelated, interconnected, or interwoven" (Crawley, Cameron, & Selva, 2016). The DAS also meets the definition of a Complex Adaptive System (CAS).
Holland described CAS as "systems that have large numbers of components, often called agents, that interact and adapt or learn" (Holland, 2006). The DAS has 1000s of stakeholders, defined here at the meso-level comprising of a group of individuals with a
distinct mission and interests. These "agents" work together accomplishing the different
activities required to execute the process. These activities require coordination among the agents to complete the activities and for each agent to make decisions about how to execute their activity.
However, one of the challenges of applying systems analysis methodologies to the DAS is the enormous size and complexity of the system. Testing the hypothesis
previously presented for the entire DAS would be extraordinarily challenging. There are hundreds of interactions and variables that interact non-linearly with an equal number of
emergent behaviors. Even the yearly reports by the USD(AT&L) about the performance of the DAS, which is at least an attempt to more scientifically study the DAS, collects data at the macro-level and tries to draw conclusions about the effectiveness of policy changes by noting the trending of cost, schedule and performance measurements (USD(AT&L), 2016). Since multiple aspect of the DAS are changed between any given year, determining the positive or negative contribution of each change to the overall system data is nearly impossible.
Thus, for this research the source selection process was selected for the application of modelling and systems methodologies to better capture the effects of the separation of authorities on the system. The source selection process is a sub-process of the DAS and is used to select a contractor to provide goods and/or services to the DoD. The source selection process happens at least once for a defense acquisition program, usually right before the Milestone B decision point prior to the Engineering and Manufacturing Development (EMD) phase.
More specifically, this research analyzed a best-value competitive source selection. The federal government has a preference of utilizing competition in contracting actions. One of the central tenets of the USD(AT&L) Better Buying Power (BBP) initiatives is to "promote effective competition." In a memorandum to the workforce describing actions to improve DoD competition from 2014, the USD(AT&L) Frank Kendall described competition, "as the most valuable means we have to motivate industry to deliver effective and efficient solutions" ... and, "when we create and maintain a competitive
environment, we are able to spur innovation, improve quality and performance, and lower costs for the supplies and services we acquire" (Kendall, 2014).
The source selection process has a lot of qualities that make it a good substitute for the entire DAS to test different hypothesis about how the DAS functions. First, the source selection process is done almost entirely in serial fashion with the rest of the DAS processes. During source selection, almost the entire program office will be focused on completing the process. Therefore, the effect of multiple processes
consuming overlapping resources, and agents having to choose which parallel process demand they need to satisfy at a given moment, is greatly reduced. Second, the source selection process is long, averaging between 1 to 3 years. Like the DAS, emergent behaviors that have longer time-constants before they reveal themselves may also be found in the source selection process. Also, even finding insights that only apply to the source selection process can translate to improvements in efficiency that have a large effect on the overall DAS timelines.
Additionally, the source selection process has several unique attributes that make it a good sub-process specifically for testing the hypothesis. First, the source selection process has elements clearly as a result of the separation of authorities. Second, the source selection process is vary controlled. Once the Request for Proposal (RFP) is released and contractors begin working on their proposals, the government source selection team is largely isolated from the externalities present in the rest of the DAS. They are not allowed to discuss how the source selection process is progressing outside of the key stakeholders. This "cone-of-silence" isolates the source selection
team from many of the political and bureaucratic pressures that can be challenging to model and isolate from other variables in the rest of the DAS.
Defining Value
Now that a source selection process has been chosen to analyze effects for extrapolation to the larger DAS, value has to be defined in relation to the source selection process. In general, value is, "the delivery of benefit at cost" (Crawley, Cameron, & Selva, 2016). Or, in equation form:
Value = Benefit - Cost (1)
If the benefit is greater than the cost than you have a positive value. Conversely, if the benefit is less than the cost you have a negative value. The challenge with value as a measurement is that the units of benefit and cost are often not the same, making the overall value determination subjective at best. The DoD in particular has this problem because while cost of acquisition programs has the unit of dollars, the benefit of that money as a contribution to the defense of the nation has no units. A commercial airline, on the other hand, has a good idea of how much revenue an airplane can
generate. Revenue is their benefit and the units are the same as their cost. Therefore, they can easily determine the value of purchase a new airplane.
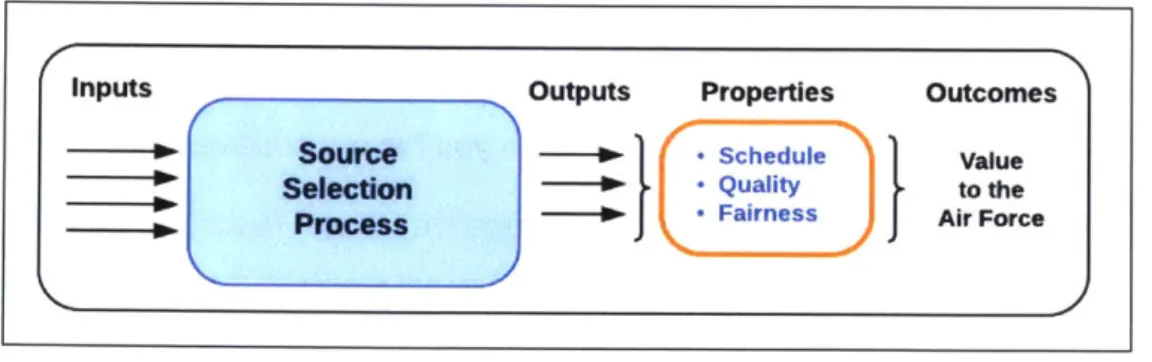
Defining value for a source selection starts with analyzing system. As described in the 2011 DoD Source Selection Procedures, the goal of the process is to, "deliver quality, timely products and services to the Warfighter and the Nation at the best value for the taxpayer" (USD(AT&L), 2011). Figure 9 below is a system level view of the source selection system outcomes in the same format as the DAS diagram in Figure 6. The output of the source selection process is a decision on which contractor proposal provides the best-value when evaluated against the Air Force's requirements. The product of that output is a documented decision and contract with the selected bidder. The source selection process output has several properties: the quality of the decision, the fairness of the decision process, and the schedule required to execute the process.
Inputs Outputs Properties Outcomes
Source -1 - Schedule Value
Selection -- o- . Quality to the
Process - Fairness Air Force
Figure 9. Outcome Measures of the Source Selection System
The source selection process serves two primary functions. The first function supports the more obvious purpose of the process which is to select a contractor to deliver goods and/or services to the Air Force. Broadly, this function supports a decision and the desire is to make the best decision by selecting the best source from the pool of bidding contractors. In most source selections, the Source Selection
Authority (SSA) determines which combination of performance, cost, and schedule offered by the competing contractors provides the best-value to the government. In other words, the lowest cost doesn't always win. For the source selection process, the property of the first function is quality, as in the quality of the decision.
The second function is to ensure the fairness of the process so all bidders have an equal opportunity to bid and be selected. As stated in the FAR, the source selection process is, "designed to foster and impartial and comprehensive evaluation of offerors' proposals" (Federal Acquisition Regulations, n.d.). According to the Government Accountability Office (GAO), "the laws and regulations that govern contracting with the federal government are designed to ensure that federal procurements are conducted fairly" (GAO, 2009). For government procurements, if a bidder feels the process has been unfair, they can file a protest to the GAO or the agency that issued the RFP. If the protest is sustained, corrective actions must be accomplished. This can include
everything from a relatively quick re-evaluation of a proposal and updated decision to starting the source selection over with a new RFP and bids.
The fairness function is unique to government procurement. When a private company decides on a source, they don't need to be fair. They can make the decision any way they want and only need to justify themselves to upper management or shareholders. A losing bidder has no recourse to protest the fairness of the decision. This is certainly a big factor in why commercial source selections are significantly faster than the government. The government source selection process needs to include activities and expend resources to ensure the fairness function is satisfied.
Determining Cost
Once value was defined and the source selection process outputs, properties, and functions were analyzed, the value equation was broken into its two elements for analysis. Cost was simpler to define and analyze for the source selection process, so analysis started there. Monetary cost for the source selection process is minimal, especially when compared with the size of the contracts that accompany large defense programs. Variations to the process would have a barely measurable monetary savings to the government. As stated in the motivation, it is the pace of the entire acquisition process that is allowing our adversaries to catch up to our technological advantage. Having a source selection process that can take well over a year has a large schedule cost on the DAS. Therefore, from a value perspective, cost was defined as the schedule to complete the process, aligning with the schedule output property of Figure 9.
The next step was to find a way to determine how the separation of authorities could affect schedule. Going back to the quote that started the Background and Related Research chapter, organizations often design complex systems in a way that mirrors their organizational structure, or lines of communication (Conway, 1968). This is often referred to as Conway's Law and the same idea can be expanded to organizations that create processes. Conway's theory can help explain why innovation tends to happen more in startup companies. The design of a small company's system is not constrained by the stove-pipes of communication that characterize larger, more established companies. Once an organizational structure is in place, all problems are
viewed through the lens of that organizational structure. The evidence can be seen by observing how established companies struggle to adapt to changing markets and technologies. Those that have longevity are often the ones that can adapt the organization to keep innovating.
With Conway's law in mind, the source selection process was analyzed from the stand point of additional process scope or topology that could be related directly back to the separation of authorities. Using a concept discussed by Moser and Wood applied to complex socio-technical systems, Project Design was used to reverse engineer out costs (schedule) associated with the separation of authorities (Moser & Wood, 2015). The premise being that the source selection process was designed by an organizational structure that had a clear separation of program management and contracting
authorities. Then, the following question was asked: If the organizational construct no longer constrained the process design, would the project architecture (source selection) be designed in a different way that reduces schedule? When looking for data on
different constructs of source selections, not enough of varying structure with data could be found to investigate separation of authority effects. Some examples were found were process steps were rearranged or eliminated. They weren't enough to draw conclusions and you still had the problem that source selection schedules are also dependent on many other factors outside of just the process. Therefore, comparing two different source selection schedules is not always apples-to-apples.
Project Design relies on three elements: 1) representation through sociotechnical system models, 2) analytics through behavior based simulation models, and 3)
workshops where the project team can engage in a cooperative project architecture process where they can test different approaches, learn more about the trade space, and converge to an optimized solution (Moser & Wood, 2015). This process can help to alleviate the organizational effects of Conway's law on the project because the team in experimenting, learning and witnessing the tradespace themselves.
The workshop is done at the beginning of the project to build the design. In this case, the source selection process had already been designed, but using the same methodology, the process model was changed from the baseline source selection process to find different architectures and the schedule differences captured. The delta in schedule could then be associated as the cost of the element that was changed in the process. In that sense, topological changes to the process effecting the interaction of the stakeholders were explored, as well as steps in the process that could be
considered duplicative or overlapping in function where scope could be reduced. This Project Design methodology has the advantage of being controlled, where
non-changing elements can be held constant so measured difference can be related. The disadvantage is that it is based upon a model of the system instead of direct
measurement. Therefore, results are based upon the assumptions and limitations of the model.
An Agent-Based Model (ABM) was used to represent and analyze the source selection process as a system. ABMs are a meso-level class of individual,
organizational and societal (lOS) modeling and simulation techniques. Meso-level models, "represent interactions and influences among individuals in groups and cover both individual and group phenomena and their interactions". The meso-level is in
contrast to macro-level models that represent interactions at the large group or society level and micro-level models that represent interactions at the purely individual level. ABMs are useful for the study of complex systems when: "(1) the systems are
composed of multiple interacting entities and (2) the systems exhibit emergent properties..." (Committee on Organizational Modeling from Individuals to Societies, National Research Council, 2008). Both are the case in the source selection process.
ABMs are well suited for application to organizational processes. Stakeholders can be modeled as individuals or teams of individuals that interact as part of a process such as source selections. Rules are developed in the model that apply logic and algorithms to those interactions to include stochastic variation so the inherent uncertainty of any social interaction can be captured. Generally, when projects or process schedules are forecasted, the work effort for each task is estimated and then combined in a logical order of progression. By finding the critical path through the tasks, and knowing how many people are working on the activity at any given time, the
schedule can be estimated. However, Brooks pointed out that this only holds true when tasks can be portioned among many workers with no communication among them. He went on to note that when communication is required among the sub-tasks, the effort of communication must be included in the amount of work required to complete the task (Brooks Jr., 1995). With an ABM, not only can the work effort be modeled for each task, but also the coordination (Brooks' communication) between different agents in the process can be captured and estimated. Coordination between agents is modeled as a factor affecting work and schedule (Moser & Wood, 2015).
In response to the same observation as this research, that despite the number of studies and acquisition reform efforts, only marginal improvements have been
witnessed over the years, Schwen et. al. premised that ABMs would be an effective tool to, "identify significant causal factors that contribute to the performance of the
procurement system." They noted that ABMs are, "particularly well suited for
developing and testing theory about the complex behavior of the meta-organization..." such as the DoD (Schwenn, Colombi, Wu, Oyamma, & Johnson, 2015).
TeamPort was the ABM software selected for this research because it has a simple user interface combined with a powerful advanced mathematics engine for detailed insights into project dynamics. TeamPort facilitates the Project Design process by including both the system model and simulation elements. The simple graphical interface allows for rapid architecture changes and simulation runs making the Project Design process very rapid. Figure 10 shows the symbology used in the TeamPort user interface.
Teams Products Phases Activities
Figure 10. TeamPort ABM Software Symbology (Global Project Design, 2016)
A project or process model starts by describing the project architecture. First, the teams are identified and connected through an organizational structure. Teams can be
sized from 1 to 100s of people. Second, the products that the team develops as part of the project or process are defined. Products can be defined at multiple levels in a Product Breakdown Structure (PBS) for easier analysis. Next, activities are defined for each product and linked together in a work breakdown structures (WBS) flow. The work effort required to complete each activity is a primary input and is measured in man-hours. In this case, work effort does not include coordination or communication time. Dependencies between activities can also be defined. Teams are then assigned roles (called contracts) for each activity linking products, activities, and teams together. Lastly, activities can be organized in phases for aggregate analysis. Figure 11 shows the architecture window of the TeamPort software and how the teams (agents), activities, products and phases are linked together. The black dashed lines indicate dependencies between activities. The detail panel on the right is where the different model parameters for each element can be entered (Global Project Design, 2016).
Q L 1 li
0777m
To add clcmvet h keccicodo 0ProductsOTeams
941L
0'M Phases T2Pigwa.,Tear, 1, Tj i A c t i v it i e s~ ~ ~ - - ---A
Kw~fimfo WO
tai PneFigure 11. TeamPort ABM Software Architecture View (Global Project Design, 2016)
Once the project architecture is defined, a Monte Carlo simulation can be run that produces a detailed forecast report about the project dynamics. Output includes project and team level work, coordination, and wait times. It also includes detailed data that can be viewed from the team, activity, or product perspective.
Determining Benefit
Going back to Figure 9 and examining the properties of the outputs of the source selection process, quality and fairness are left. Increasing both quality and fairness have a benefit to the source selection process. Not making a quality decision on the best contractor to build and deliver a system will have long lasting negative ramifications
on the Air Force. In addition, the fact that it is a government procurement, means that the process must be fair. If a contractor perceives the process has been unfair to them, they have an opportunity to protest. The protest process at the very least takes time and resources to adjudicate, and in a worst case can lead to a complete overturn of the decision causing the entire source selection process to be repeated. Figure 12 below is an update to Figure 9 that includes a mapping of the source selection process output properties to the cost and benefit elements of the value equation.
Inputs Outputs Properties Outcomes
Source
1
- Schedule Cost valueSelection - -Quality to the
Se.ePons Processnei --- o - Fairness Beei Air Force
Figure 12. Source Selection Value Diagram
Quality and fairness are not outputs that can be easily captured in an agent-based model. The best source for quality and fairness measurements are from the system directly. Investigating the outputs of the source selection process, it is also challenging to measure the quality of the decision. While measuring whether a program was successful in meeting its objectives (cost, schedule, and performance), there are a multitude of other execution externalities that effect a program, tracing program failure back to a poor source selection decision is problematic. In addition, you only get to pick
one path so maybe the source selection decision was the best of many bad choices, and the program would have failed anyway. You can't test the other paths.
You can test the output of the source selection process for fairness in the form of a protest. The number of protests is not the best measurement because that is a
perceived unfairness and the offeror that protests only knows what they proposed. They have no knowledge of the details of other offerors proposals. However, protests that were upheld can be measured. Most source selection protests go through the Government Accountability Office (GAO). The GAO publishes a descriptive guide that covers how a bidder can file a protest against a solicitation. 4 C.F.R 21.2 sets for the requirements for filing a protest. A bidder has until the initial evaluations are due to submit a protest alleging improprieties in the RFP. If they want to protest the decision or how they were evaluated, they have until 10 days after the debriefing of the source selection is received. Once a protest is received, the GAO forwards it to the agency responsible for the source selection for initial evaluation. In the Air Force, the protest goes to the Air Force Legal Operations Agency (AFLOA). After receipt, the agency has 30 days to send a written report back to the GAO. This can be in the form of corrective actions the agency proposes in response to the protest, or documentation supporting and agency claim that the process was conducted fairly. In the latest case, the GAO will issue a decision within 100 days of the protest filing (GAO, 2009). For this research, AFLOA was contacted and protest data was requested for the last 10 years of Air Force source selections.
But this only helps investigate the output of the current source selection process. It does not measure how the separation of authority's effects whether a protest will be
sustained and the process deemed unfair. To get more insight into the effect of the separation of authorities, the inner workings of past source selections was analyzed. It was noted, and will become more apparent in the system definition and orient sections, that execution of contracting authorities through the contract clearance process
primarily involved reviewing the evaluation teams work. This requires an interaction between the SSEB/PCO and both the MIRT and CCA.
The interaction between the MIRT and SSEB/PCO is documented in the form of a comment resolution matrix (CRM). The interaction involves the SSEB/PCO
submitting all of the relevant source selection documentation prior to a key decision point to the MIRT for a review. The MIRT documents its comments in the CRM. The comments include the reviewer names, document section/paragraph/line number, a rating of the comment (critical, substantive, or administrative), and the comment itself with justification. The SSEB/PCO then reviews each comment and documents the resolution (accept, partially accept, or reject). Once again, justification for the resolution is documented in the CRM. In some cases, the CRM resolution is returned to the MIRT to get concurrence on the resolution and justification. An example comment in a CRM from an Air Force source selection is shown in Figure 13.
Member Office Document Comment Resolution Name Symbol (Chart#, EN#, Comment (A/RIP)
R - Chart XX shows whether the offeror has fully met the MoM;
Chart XX indicates there are several requirements that are while the Subfactor Chief Summary Worksheets breaks out the not met. Page X of the associated SF-2 worksheet indicates individual requirements of the meeting the MoM. So the Subfactor
#1 XX IEB #XX that the requirement is met. Further on, the worksheet Chief Summary details that they have partially met the explains as to why the requirement in not met. These requirements; however, they have not met any of the four MoMs areas need to be consistant in full which is represented in the charts.
Corrective Action: None
Figure 13. Example Comment from Air Force Source Selection CRM
To measure the benefit of this MIRT and SSEB interaction, the CRMs from five different AFLCMC source selections were collected. The source selections were all conducted in the last 12-18 months. The source selections were chosen for review by the AFLCMC/PKC staff that is responsible for running the MIRT teams. Each comment was then scored using a 0 to 5 scale representing the likelihood that the comment effected either the quality of the decision or the fairness of the process. The 0 to 5 scale definition can be seen in Table 1 below.
Table 1. Source Selection CRM Scoring Scale
Probability of
Score Likelihood Occurrence
5 Near Certainty > 80% to < 99% 4 Highly Likely > 60% to < 80% 3 Likely > 40% to < 60% 2 Low Likelihood > 20% to < 40% 1 Not Likely > 1% to < 20% 0 No Likelihood < 1%
Both the author and an AFLCMC source selection subject matter expert (SME) scored each comment in the five CRMs. The scores were then aggregated for analysis. To protect the sensitivity of the source selections and any company proprietary
information, the CRMs are not included in this report. Only the aggregate results will be shown. By scoring each property separately, the benefit of the interaction can also be measured separately for the effect on quality and fairness of the source selection process.