HAL Id: hal-01688420
https://hal.archives-ouvertes.fr/hal-01688420
Submitted on 16 Mar 2018
HAL is a multi-disciplinary open access
archive for the deposit and dissemination of
sci-entific research documents, whether they are
pub-lished or not. The documents may come from
teaching and research institutions in France or
abroad, or from public or private research centers.
L’archive ouverte pluridisciplinaire HAL, est
destinée au dépôt et à la diffusion de documents
scientifiques de niveau recherche, publiés ou non,
émanant des établissements d’enseignement et de
recherche français ou étrangers, des laboratoires
publics ou privés.
Combustion and gasification characteristics of chars
from raw and torrefied biomass
E. M. Fisher, Celine Dupont, L. I. Darvell, Jean-Michel Commandre, A.
Saddawi, J. M. Jones, M. Grateau, T. Nocquet, Sylvain Salvador
To cite this version:
E. M. Fisher, Celine Dupont, L. I. Darvell, Jean-Michel Commandre, A. Saddawi, et al.. Combustion
and gasification characteristics of chars from raw and torrefied biomass. Bioresource Technology,
Elsevier, 2012, 119, pp.157-165. �10.1016/j.biortech.2012.05.109�. �hal-01688420�
Combustion and gasification characteristics of chars from raw and torrefied biomass
E.M. Fisher
a,⇑, C. Dupont
b, L.I. Darvell
c, J.-M. Commandré
d, A. Saddawi
c, J.M. Jones
c, M. Grateau
b,
T. Nocquet
b, S. Salvador
eaSibley School of Mechanical and Aerospace Engineering, Upson Hall, Cornell University, Ithaca, NY 14853, USA bCommissariat à l’Energie Atomique et aux Energies Alternatives, LITEN/DTBH/LTB, Grenoble, France cSchool of Process, Environmental and Materials Engineering, University of Leeds, Leeds, LS2 9JT, UK dCIRAD, UPR 42 Biomasse Energie, Montpellier, France
eUniversité de Toulouse, MINES ALBI, RAPSODEE, FRE CNRS 3213, Campus Jarlard, route de Teillet, 81013 ALBI CT CEDEX 09, France
Keywords: Torrefaction Oxidation Gasification Biomass Kinetics
a b s t r a c t
Torrefaction is a mild thermal pretreatment (T < 300!C) that improves biomass milling and storage prop-erties. The impact of torrefaction on the gasification and oxidation reactivity of chars from torrefied and raw biomass was investigated. Thermogravimetric analysis was used to study the differences in O2and
steam reactivity, between chars prepared from torrefied and raw willow, under both high- and low-heat-ing-rate conditions. High-heatlow-heat-ing-rate chars were prepared at 900!C with a residence time of 2 s. Low-heating-rate chars were prepared with a heating rate of 33!C/min, a maximum temperature of 850 or 1000!C, and a residence time of 30 min or 1 h, respectively, at the maximum temperature. Pretreatment by torrefaction consistently reduced char reactivity. Torrefaction’s impact was greatest for high-heating-rate chars, reducing reactivity by a factor of two to three. The effect of torrefaction on a residence time requirements for char burnout and gasification was estimated.
1. Introduction
Torrefaction is a mild thermal pretreatment that occurs below
300!C under an inert atmosphere. Under these conditions the
ini-tial biomass is converted mainly into a solid product whose prop-erties are intermediate between coal and biomass. As described by
Chew and Doshi (2011), the torrefied product has a brown color,
decreased H/C and O/C ratios, and an increased energy density. In addition, it is hydrophobic, brittle and, in comparison to raw
bio-mass, more easily fluidizable (Svoboda et al., 2009) and less prone
to agglomerate (Chen et al., 2011). These properties give the
torr-efied product advantages over raw biomass for transportation, storage, milling and feeding. Hence, torrefaction appears as a very
promising pretreatment for co-firing with pulverized coal in exist-ing large industrial facilities and gasification in entrained flow reactors.
Biomass combustion or gasification consists of two partially overlapping processes: (1) the release of water and volatiles, i.e. pyrolysis (also known as volatilization or charring), followed by (2) the slower reaction of the solid residue (char) with oxygen or steam, respectively. As the second process is slower than the first, it has an important impact on reactor sizing, control and efficiency (Costa et al., 2003; Di Blasi, 2009; Dupont et al., 2011). Char prop-erties depend strongly on pyrolysis conditions, especially on the
heating rate during pyrolysis (Di Blasi, 2009). Although there is
no one generally accepted definition of char reactivity, it is possible to determine a global char reactivity from mass loss histories, by defining it as the time derivative of the conversion. This global reactivity is influenced by the char surface area and surface acces-sibility as well as by intrinsic kinetic parameters.
⇑ Corresponding author. Tel.: +1 607 255 8309; fax: +1 607 255 1222. E-mail address:emfisher@cornell.edu(E.M. Fisher).
Two key attributes of torrefied biomass, in comparison to raw biomass, are relevant to char morphology and thus to char reactiv-ity: the reduced amount of volatiles to be released during pyroly-sis, and the different distribution of particle sizes produced during milling. Both of these differences are expected to be most influential under fast pyrolysis conditions, as described below.
When raw biomass is rapidly pyrolyzed, the resulting rapid re-lease of volatiles deforms biomass structures and typically leads to
higher macropore surface areas and thus to higher reactivities (Di
Blasi, 2009). It appears that torrefaction, which shifts volatiles re-lease to the low-heating-rate torrefaction process, could reduce this effect, thus lowering the reactivity of high-heating-rate chars. The typical distribution of particle sizes present in torrefied vs. raw biomass may also have an important effect. Pulverized woody
biomass particles are typically 300
l
m or even larger in their smalldimension, while pulverized coal particles are closer to 50
l
m(Tillman, 2000; Skeen et al., 2010). While industrial-scale size dis-tribution data are not available for torrefied materials, it appears that pulverized torrefied biomass has a size distribution more
com-parable to that of coal than that of raw biomass (Bridgeman et al.,
2010; Repellin et al., 2010). Transport limitations during heating are reduced for smaller particles, resulting in a higher effective heating rate. Although research in this area has been limited, initial particle size has been observed to have an impact on morphology
of biomass chars (Avila et al., 2011) and on reactivity of coal chars
(Zhu et al., 2008). Experimental particle size distributions in the present study (given below) reflect the anticipated differences be-tween torrefied and raw biomass that will occur in full-scale devices.
Combustion kinetics of torrefied biomass have received little
attention up to now (Bridgeman et al., 2010; Arias et al., 2008),
and steam gasification kinetics have been studied only
qualita-tively to date (Couhert et al., 2009). In the current work, reactivities
of several chars from torrefied and non-torrefied biomass are com-pared under oxidation and gasification conditions. Two different types of chars are studied: high-heating-rate chars formed under conditions representative of pulverized coal furnaces or entrained flow gasifiers, and low-heating-rate chars formed under conditions representative of moving grate combustors or low temperature reactors. The range of heating rates occurring in practical biomass
conversion devices is discussed byMehrabian et al. (2011).
2. Experimental methods 2.1. Drying and torrefaction
Short rotation coppice willow chips, harvested in 2008 and stored first in heaps, then in bags, until their use in spring 2010, were supplied by Rothamsted Research, Harpenden, UK. The chips were sieved to select those with their two smallest dimensions
be-tween 5.6 and 9.5 mm, and then dried thoroughly at 110!C
follow-ing a procedure similar to the European standard CEN/TS 14774. After drying, batches of 70 g of chips were stored in closed plastic bags until use.
A packed bed of chips in a 6-cm-ID reactor was placed in the central zone of a temperature-programmed furnace and torrefied under a gentle nitrogen flow of 0.8 standard liters per min (slpm). Batches of 70 g of willow were torrefied with the following
im-posed temperature program: ramp at 5!C/min from room
temper-ature to 150!C; hold at 150 !C for 45 min; ramp at 5 !C/min to
desired end temperature (270 or 290!C); hold at end temperature
for either 41 or 38 min, giving a total time above 200!C of
approx-imately 60 min. Temperatures were measured with several sheathed thermocouples inserted into the packed bed of biomass, and compared to the imposed temperature program. The actual
temperatures lagged the set point temperatures by a few degrees during the ramp period. Also, measured peak temperatures
dif-fered from the set point maximum by as much as 15–22!C, with
temperatures above the set point near the downstream edge of the biomass bed, and below the set point near the upstream edge of the biomass bed. Mass losses during torrefaction were 23% and
37% on a dry basis, for the 270 and 290!C cases, respectively.
2.2. Production and storage of chars
Conditions for char production are summarized in Table 1,
which also gives a brief code name for each char, to be used below. Torrefied or raw willow samples were milled in a Retsch PM 100 ball mill. Different milling regimens were used for the raw vs. the torrefied biomass; the milling regimen was chosen empiri-cally to ensure that virtually all the material passed through a 1-mm sieve. Raw biomass was processed at 450 rpm for 1 min, 525 rpm for 1 min, and 650 rpm for 45 s. Torrefied biomass was processed at 450 rpm for 30 s, followed by 650 rpm for 45 s. In all cases, samples were then passed through a 1-mm sieve. Sieved samples were stored in closed plastic bags until use; typical stor-age times were 1–2 months.
The procedure for producing low-heating-rate (LHR) chars was the following: Three samples of sieved material were placed in nickel crucibles. Sample masses ranged between 0.91 and 1.32 g. The crucibles were put inside a quartz reactor, which was placed in a furnace and purged for an hour at room temperature under a gentle nitrogen or argon flow. Next, with the inert flow
contin-uing, the reactor contents were heated at 33!C/min from room
temperature to the desired peak temperature of either 1000!C or
850!C. The reactor was held at the peak temperature for the
de-sired time (60 or 30 min, respectively), at the end of which the tube furnace was switched off. The inert flow was maintained for
sev-eral hours as the tube furnace and contents cooled to 65!C or
low-er; then samples were removed and weighed.
Fractional mass losses during charring are listed in Table 1.
Mass losses were repeatable to within 1.4%.
High-heating-rate (HHR) chars were produced in a drop tube reactor, which is representative of the very high heat transfer encountered in industrial units. The reactor was fully characterized
byVan de Steene et al. (2000),Commandré et al. (2005), and
Du-pont et al. (2008). It consists of an alumina tube of
2000 ! 75 mm (L ! ID), inserted into a vertical electric heater with three independent heating zones; the total isothermal reaction zone is 1 m long. The raw and torrefied willow particles were con-tinuously fed by a controlled weighing system at a flow rate of 0.5 g/min, transported in a 2-slpm nitrogen carrier gas, and in-jected into the reactor through a water-cooled feeding tube. A dis-persion dome was placed at the outlet of the feeding tube to distribute the solid particles homogeneously over the reactor cross section. Another nitrogen stream passed through a pre-heater to
reach the reactor temperature of 900!C and then met the mixture
of cold wood particles and nitrogen carrier stream at the dispersion dome. The total nitrogen flow rate was 18 slpm. A water-cooled sampling probe was inserted from the bottom of reactor to collect gas and remaining solid. The active length (the distance between the bottom of the feeding tube and the top of the sampling probe) was of 1.2 m. Due to the small size of the particles, their residence time was close to the gas residence time, that is about 2 s.
Minimally handled char samples, in many cases in ‘‘button’’ form, as formed in the low-heating-rate charring crucibles, were stored in sealed glass vials, in a dessicator, and ground immedi-ately before reactivity testing. Oxidative reactivity results were found to be very similar for samples tested within the first month after charring, and those freshly ground and tested 5 months after charring. Gasification reactivity tests were
performed approximately 10 months after charring, using freshly ground samples. In all cases, chars were ground in an agate mortar but not sieved. However, in separate grinding and sieving tests,
vir-tually the entire ground sample passed through a 250-
l
m sieve.2.3. Oxidative reactivity measurements
Non-isothermal oxidation kinetics were determined thermo-gravimetrically at 1 atm in a Netzsch STA 449C Jupiter simulta-neous analyzer. Samples of 10 ± 1 mg were placed in an alumina crucible with 10.6 mm height and 6 mm ID The sample was first
heated at 10!C/min to a temperature of 100 !C, maintained at
100!C for 20 min, and finally heated to 800 !C at 10 !C/min. A
he-lium flow of 0.08 slpm was maintained during the initial ramp and
the first 15 min of the 100!C period, after which the same flow rate
of 12.5 vol.% O2 in He was substituted. Good repeatability in the
TGA traces was obtained, and the stability of mass before O2
intro-duction indicated the adequacy of the drying period. A
representa-tive TGA trace, for char HHR-T-290, is shown inFig. 1(a).
The oxidation reactivity of the char, rox, was determined from
the mass measurements using Eq.(1). rox is the time derivative
of the conversion, X. In this equation, mirefers to the mass at the
start of the O2introduction, i.e. after the biomass has been dried
at 100!C for 15 min. The ash mass, mash, was taken to be equal
to the average mass over the temperature between 640 and
700!C. Eq.(1) was evaluated at selected temperatures between
400 and 600!C, with mass measurements averaged over 5 !C
inter-vals to reduce noise. rox¼ dXdt
! "
; X #mmi$ mðtÞ
i$ mash ð1Þ
It has been shown in previous work on carbon particle bed oxi-dation in a thermogravimetric analysis (TGA) apparatus with a
similar temperature range and sample size (Salvador et al., 2003)
that oxygen transfer limitations may slow the reaction. The results of char oxidation in the current work should not be taken as purely kinetically controlled; they nevertheless enable direct comparison between different samples.
2.4. Gasification reactivity measurements
Char gasification with steam took place isothermally in a ther-mogravimetric analysis device operating at atmospheric pressure (SETARAM Setsys coupled with steam generator Wetsys). Samples of 5 ± 0.1 mg were placed in the crucible of the thermobalance. This crucible was a cylinder of 2.5 mm height and 8 mm ID. The
sample was heated at a rate of 24!C/min to 800 !C under a N2
gas flow of 0.05 slpm until volatilization was complete. After the
gasification temperature of 800!C was reached and no further
mass loss was observed, the gas was switched to a H2O/N2mixture
(27 vol.% H2O, with an uncertainty below 4%) with the same total
flow rate, and gasification occurred. A representative TGA trace,
for char HHR-T-290, is shown inFig. 1(b).
Similarly to the process for oxidation reactivity, the gasification
reactivity, rgas, was based on the measurements of mass loss versus
time, as shown in Eq.(2).
rgas¼ dXdt ! "
; X #mmi$ mðtÞ
i$ mf ð2Þ
In this expression, mi, m(t) and mfare the masses of char at the
start of steam gasification (after heating in N2), at time t and at the
end of gasification respectively.
The average gasification reactivity rgas, integwas also defined
be-tween two stages of conversion X1and X2by:
rgas; integ¼ Rtx2 tx1 rgasðtÞdt 1$XðtÞ tx2$ tx1 ð3Þ Note that there is no standardized definition of reactivity. Here
X1and X2are chosen to be 5% and 70%. This choice allows a global
reactivity to be obtained without taking into account the very beginning and the end of the reaction, during which the occurrence of specific phenomena may obscure the global trend.
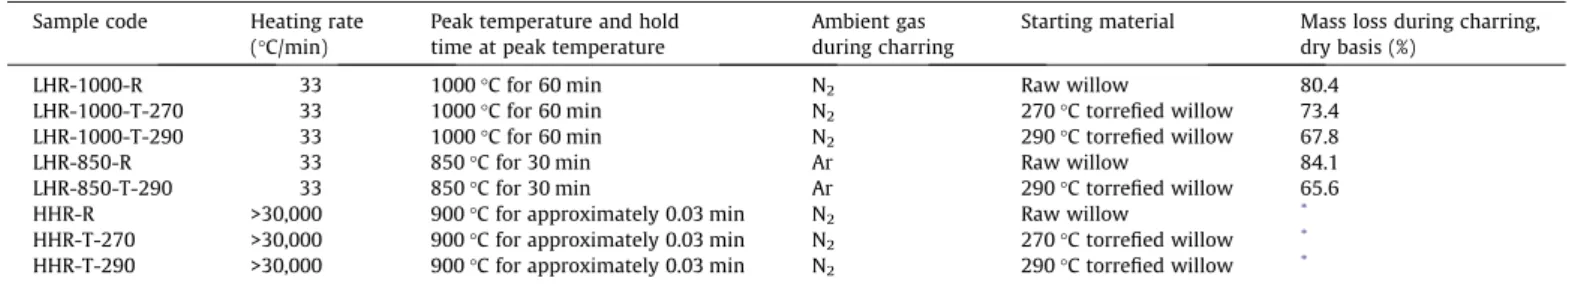
Table 1
Charring conditions, fractional mass loss during charring on a dry basis, and codes for char samples. Sample code Heating rate
(!C/min)
Peak temperature and hold time at peak temperature
Ambient gas during charring
Starting material Mass loss during charring, dry basis (%)
LHR-1000-R 33 1000!C for 60 min N2 Raw willow 80.4
LHR-1000-T-270 33 1000!C for 60 min N2 270!C torrefied willow 73.4
LHR-1000-T-290 33 1000!C for 60 min N2 290!C torrefied willow 67.8
LHR-850-R 33 850!C for 30 min Ar Raw willow 84.1 LHR-850-T-290 33 850!C for 30 min Ar 290!C torrefied willow 65.6 HHR-R >30,000 900!C for approximately 0.03 min N2 Raw willow *
HHR-T-270 >30,000 900!C for approximately 0.03 min N2 270!C torrefied willow *
HHR-T-290 >30,000 900!C for approximately 0.03 min N2 290!C torrefied willow * *Mass loss could not be determined in the high-heating-rate drop tube experiments.
0 20 40 60 80 100 0 200 400 600 800 0 20 40 60 80 100 ma ss (% o f i ni tia l ma ss ) T ( C ) Time (min)
(a)
0 20 40 60 80 100 0 200 400 600 800 0 20 40 60 80 100 ma ss (% o f i ni tia l ma ss ) T (C) Time (min)(b)
Fig. 1. Representative TGA mass and temperature profiles, for char HHR-T-290, for (a) oxidation; (b) gasification.
Preliminary experiments and calculations have shown that
un-der the operating conditions (T = 750–900!C; particle size <50
l
m;sample mass = 5 mg), the intrinsic kinetics regime was reached and
that there were no limitations by heat or mass transfer (Nocquet,
2009).
The repeatability of the experiments was checked by repeating each test. The relative difference of average reactivity between two tests was always below 5%.
2.5. Char characterization
Ultimate and proximate analyses were performed. The C, H, N and S contents were determined according to a British Standard
method (BS EN 15104, 2011). O content was obtained by
differ-ence. Proximate analyses were carried out according to the
Euro-pean standards (DD CEN/TS, 2004a, 2004b, 2005).
The Scanning Electron Microscopy (SEM) equipment used for solid particles observation was a Philips XL30.
3. Characteristics of biomass, torrefied biomass, and chars Results of the ultimate analysis of willow, torrefied willow, and char, and of the procimate analysis of willow and torrefied willow
are shown inTables 2 and 3, respectively. As seen byBridgeman
et al. (2008), both torrefaction and charring reduced H and O con-tent. Torrefaction also reduced moisture and volatiles content, while ultimate analyses were not performed for chars because of
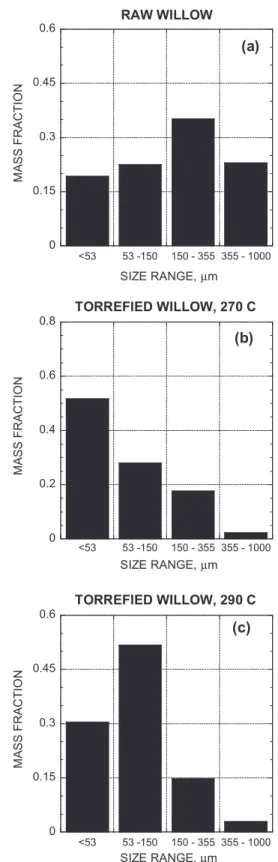
the limited sample size available.Fig. 2shows the particle size
dis-tribution, obtained by sieving, of the raw and torrefied biomass after milling and immediately before charring. Clearly, the two torrefied samples show very different size distributions than the raw willow sample, with much larger fractions of the mass in the small size ranges. This result is in agreement with the findings of
previous studies (Arias et al., 2008; Almeida et al., 2009). In
con-trast to previous work (Bridgeman et al., 2010) the increase in
tor-refaction temperature between 270 and 290!C did not lead to an
increase in fractions in the smallest size ranges (<50
l
m). As theamount of biomass in each ball mill batch was not tightly
con-trolled, this result may simply arise from slightly different grinding conditions.
The improved fluidization of torrefied particles is generally associated with an absence of little thread-like fibers at the edge of milled torrefied particles, provided that the treatment condi-tions were severe enough. This seems to be confirmed by SEM
observations (Supplementary material): particles of raw biomass
have numerous needle-like fibers at their edges, and particles
Table 2
Ultimate analysis of biomass, torrefied biomass, and char samples; mass percent on an as-received basis (after drying, milling, and storage).
Sample Code C H N S Raw willow (R) 48.28 5.86 0.32 <0.01 Torrefied willow, 270!C (T-270) 54.29 5.57 0.38 <0.01 Torrefied willow, 290!C (T-290) 58.38 5.55 0.38 <0.01 LHR-1000-R 87.65 0.81 0.48 0.02 LHR-1000-T-270 85.46 0.62 0.39 0.04 LHR-1000-T-290 89.89 0.61 0.40 0.02 LHR-850-R 88.01 1.23 0.53 <0.01 LHR-850-T-290 89.66 1.29 0.55 <0.01 HHR-R 73.77 1.20 0.56 0.02 HHR-T-270 86.56 1.20 0.52 0.01 HHR-T-290 85.85 1.19 0.55 0.03 0 0.15 0.3 0.45 0.6 <53 53 -150 150 - 355 355 - 1000
RAW WILLOW
M AS S FRA C TI O N SIZE RANGE, µm(a)
0 0.2 0.4 0.6 0.8 <53 53 -150 150 - 355 355 - 1000TORREFIED WILLOW, 270 C
M AS S FRA C TI O N SIZE RANGE, µm(b)
0 0.15 0.3 0.45 0.6 <53 53 -150 150 - 355 355 - 1000TORREFIED WILLOW, 290 C
MA SS FR AC TI ON SIZE RANGE, µm(c)
Fig. 2. Particle size distribution before charring. Table 3
Proximate analysis of biomass and torrefied biomass samples, mass percent. See
Table 1for an explanation of the sample codes. Sample description Moisture
content Volatile content Fixed carbon Ash content Raw willow (R) 4.5 77.4 16.9 1.23 Torrefied willow, 270!C (T-270) 2.7 70.8 24.8 1.63 Torrefied willow, 290!C (T-290) 2.7 60.1 35.3 1.91
torrefied at 270!C retain some such fibers. In contrast, these fibers
appear to be completely absent on particles torrefied at 290!C.
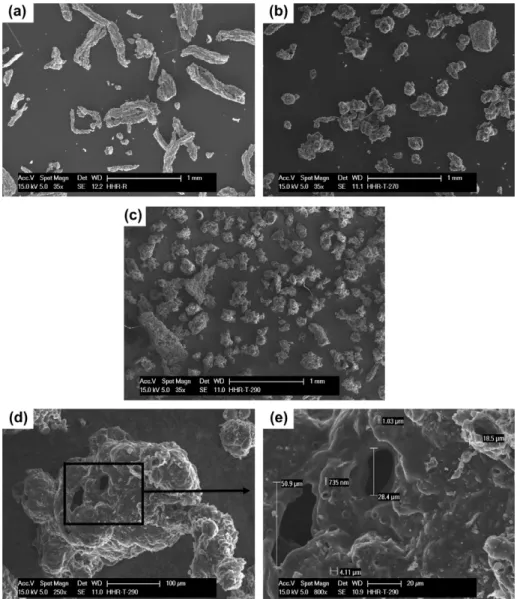
Regarding chars, in agreement withCetin et al. (2004), the
pyro-lysis heating rate appears to have great influence on structure un-der the conditions explored. Regardless of the pyrolysis temperature, the presence or absence of torrefaction, and the par-ticle size, almost all parpar-ticles from low-heating-rate chars kept the
fibrous structure of the initial wood. This is illustrated inFig. 3a–c;
under these conditions there were also some smaller low-aspect-ratio particles with irregular morphologies. In contrast, for high-heating-rate chars, particles exhibited either a deformed fibrous structure (dominant for chars from raw biomass, as shown in
Fig. 4a) or an exploded spherical shell structure (dominant for
chars from torrefied biomass, as shown inFig. 4b and c). As
high-lighted inFig. 4d and e, macropores in the size range 0.5–50
l
mcould be seen on the exterior of the high-heating-rate chars. These pores appeared in high-heating-rate chars from both torrefied and raw biomass, but no pores were visible in similar close-up images of the low-heating-rate chars.
As explained in the introduction, torrefaction was expected to impact the structure of high-heating-rate chars by reducing the deformation of biomass structures during rapid volatiles release in pyrolysis. No significant effect was anticipated on the structure of low-heating-rate chars, and this expectation was borne out in the
SEM photographs shown for representative cases inFig. 3a and b
(raw), andFig. 3c (torrefied). Hence, as expected, although particles
of low-heating-rate char produced from torrefied biomass appeared to be generally smaller than those from raw biomass, their structure remained fibrous, as for other low-heating-rate chars.
In contrast, pretreatment by torrefaction had a dramatic impact on the structure of high-heating-rate chars, but not in the expected way. It had been anticipated that, due to lower volatiles release, the structures of chars from torrefied samples would more closely resemble those of the original biomass than would those of the
chars produced from raw biomass. Instead, as shown in Fig. 4b
and c, the torrefied chars consist almost entirely of low-aspect-ra-tio particles with no resemblance to the original biomass particles.
The raw willow high-heating-rate chars consist mainly of large, distorted fibrous particles that retain the basic shape of the original
biomass particles (Fig. 4a).
The dominance of smaller sizes in the distribution of torrefied
biomass samples may explain the difference in structure. Avila
et al. (2011)found that small particles ('100
l
m) showed signifi-cantly more loss of initial biomass structures during charring thanlarge particles ('800
l
m) did, for certain biomass types ininter-mediate-heating-rate experiments. This appears to be logical: the gas release occurs more slowly in larger particles due to heat trans-fer limitations and hence the gas can be released without destroy-ing the initial solid structure. Thus, the smaller particles that predominate the torrefied wood samples in the current study would produce the exploded sphere structures that are most
prominent inFig. 4b and c, while the larger particles constituting
the majority of raw biomass particles produced deformed fibrous
char particles instead (Fig. 4a). Thus it is clear that the initial
par-ticle size has a major influence on the subsequent char structure, perhaps even greater than the impact of the amount of volatiles released.
4. Reactivity results and discussion 4.1. Oxidation results
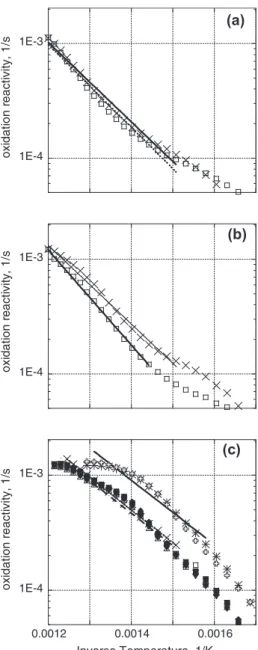
Oxidative reactivity results are shown inFig. 5. In several cases,
duplicate data points are displayed, showing excellent repeatabil-ity; these correspond to TGA experiments performed on different days, sometimes more than four months apart. Arrhenius
parame-ters fit to the data points shown are reported inTable 4. The char
reactivities show distinctly non-Arrhenius behavior over the temperature range of interest, and their Arrhenius parameters de-pend strongly on the choice of temperature interval.
The results obtained in the current study (raw biomass curves
fromFig. 5a–c) confirm those from previous studies showing that
higher-heating-rate chars were more reactive than
low-heating-rate chars from the same solid fuel (Di Blasi, 2009; Guerrero
et al., 2005; Dall’Ora et al., 2008), and higher char formation
tem-peratures lead to lower reactivities (Dall’Ora et al., 2008). The same
trends are seen in the torrefied biomass data, by comparing the
T-290 curves fromFig. 5a–c. Differences between HHR chars and LHR
chars are greater than those between LHR chars with different peak preparation temperatures.
Fig. 5shows the differences between oxidation reactivities of
chars from torrefied vs. raw biomass under the same charring con-ditions. The charring method has a distinct and consistent effect on the impact of torrefaction on reactivity. When chars were formed with low heating rates and a long residence time at a high final
temperature (LHR-1000 conditions;Fig. 5a), torrefaction had little
effect on char reactivity, reducing it by only about 5–10%. At the
milder low-heating-rate conditions (LHR-850 conditions;Fig. 5b),
chars from torrefied wood were less reactive by about a factor of 1.5 than those from raw wood. With high-heating-rate char
forma-tion (Fig. 5c), torrefaction had an even larger effect. Very little
dif-ference was observed between the chars from torrefied samples prepared at two different temperatures, but the two torrefied sam-ples produced chars with substantially lower reactivities than the char from the raw willow. This result is consistent with findings
for high-heating-rate chars produced in a pyroprobe (Bridgeman,
2008). The torrefied and non-torrefied high-heating-rate chars
dif-fer in reactivity by a factor of about two.
The reactivity vs. temperature curves indicates a roughly linear relationship at lower temperature, followed by a portion with re-duced apparent activation energy, likely due to the onset of trans-port limitations. The temperature sensitivity of the rates can also
be seen in Table 4. Oxidation had higher activation energies for
chars from torrefied than from raw biomass, and higher activation energies for LHR than for HHR chars. In this table, the Arrhenius fit is applied over a fixed conversion range that extends into the transport-limited regime. This leads to considerably lower values
of activation energy than those reported byDi Blasi (2009).
4.2. Gasification results
Gasification reactivity was tested in isothermal mode at a
tem-perature of 800!C.
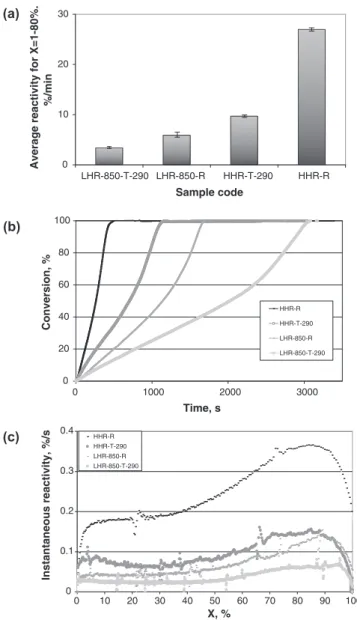
The average reactivity between 5% and 70% of conversion was
the parameter used to compare samples inFig. 6a. Reactivities
dif-fering by a factor of 9 can be seen, ranging from about 26%/min (for the high-heating-rate raw char HHR-R), to about 3%/min (for the low-heating-rate torrefied char LHR-850-T-290). For both low and high heating rate, the reactivity of char from torrefied biomass was lower than that char from raw biomass. This result is
consis-tent with findings byCouhert et al. (2009)for gasification in an
en-trained flow reactor. Quantitatively, for the high-heating-rate
chars, the average reactivity is three times lower with torrefaction pretreatment. For low-heating-rate chars (LHR-850), the trend was less marked, with an average reactivity of a factor of 1.5 lower with torrefaction pretreatment.
In agreement with previous findings (Cetin et al., 2004;
Mer-moud et al., 2006), the higher the pyrolysis heating rate, the higher the reactivity. Hence, the char produced from raw biomass at high heating rate had a five times higher reactivity than the correspond-ing char produced at a low heatcorrespond-ing rate. The high-heatcorrespond-ing-rate
chars’ porous structure, which can be observed inFig. 5c and d,
is generally assumed to be responsible for this higher reactivity.
As shown inFig. 6b, all samples exhibited very different kinetics
of conversion but similar shapes of the curve of conversion versus
time. Hence, as can be seen inFig. 6c, the gasification rate was
roughly constant at low levels of conversion, then underwent a
sig-nificant increase starting at a conversion of about 40% for high-heating-rate raw chars and at a conversion of about 60% for the other chars. Finally, the gasification rate sharply decreased at the very end of the reaction. This rate evolution characterized by an in-crease of the rate at high conversions is in agreement with
previ-ous findings on wood chars (Marquez-Montesinos et al., 2002;
Dupont et al., 2011) and is probably related to catalytic effects of inorganic elements. The qualitative similarity of the conversion curves suggests that the global gasification mechanism was not af-fected by the torrefaction pretreatment.
4.3. Discussion
Both oxidative and gasification kinetics show the same qualita-tive effects of pretreatment by torrefaction and of charring condi-tions: reactivity was lower for chars from torrefied willow, and lower for chars created under low heating rate conditions.
Quantitatively, for the higher-heating-rate chars, pretreatment by torrefaction reduced both oxidative and gasification reactivity by factors of two to three, as indicated above. For the low-heat-ing-rate chars with less severe charring conditions (LHR-850), the effect of pretreatment by torrefaction is smaller (reduction by about a factor of 1.5). For the low-heating-rate chars with severe charring conditions (LHR-1000), which is tested only under oxida-tive conditions, the effect of pretreatment by torrefaction on reac-tivity is minimal.
To the extent that they were studied here, the choice of torre-faction conditions had little impact on char reactivity. High-heat-ing-rate chars prepared from samples torrefied at different temperatures showed essentially the same oxidative reactivities. The effect of torrefaction conditions was not tested under gasifica-tion condigasifica-tions or for low-heating-rate chars.
It is possible to speculate on possible reasons for impact of tor-refaction on reactivity. For formation under HHR conditions, the smaller particles associated with torrefied samples would heat up faster and thus have longer residence times at peak tempera-ture. This difference could lead to lower reactivity via thermal
annealing (Shim and Hurt, 2000). Reduced volatiles content could
reduce pore formation in HHR chars and thus lead to lower surface areas for torrefied biomass, offering an alternative explanation for the observed differences.
From a process viewpoint, a simple calculation based on the dif-ferent Arrhenius parameters implies that the temperature of a high-heating-rate gasification reactor processing torrefied biomass
would need to be more than 100!C higher to achieve the same
level of conversion as would be achieved for raw biomass. Similar observations imply longer burn-out time requirements for torr-efied materials. Hence, using torrtorr-efied products rather than raw biomass in entrained flow reactors or combustors may significantly impact process control and design. However, as expected, oxida-tive reactivities of chars from torrefied materials are higher than
those from bituminous coal (Zhang et al., 2008; Jones et al.,
1E-4 1E-3 ox id at io n re act ivi ty, 1 /s
(a)
1E-4 1E-3 ox id at io n re act ivi ty, 1 /s(b)
1E-4 1E-3 0.0012 0.0014 0.0016 ox idat io n reacti vit y, 1/ s Inverse Temperature, 1/K(c)
Fig. 5. Oxidative reactivity Arrhenius plots. Lines show the range over which the Arrhenius fits ofTable 4were obtained. (a) chars produced at low heating rates to 1000!C. exes: char from raw biomass (LHR-1000-R); squares: char from torrefied biomass (LHR-1000-T-290). (b) chars produced at low heating rates to 850!C. exes: char from raw biomass 850-R); squares: char from torrefied biomass (LHR-850-T-290). (c) chars produced at high heating rates. Crosses and exes: char from raw biomass (HHR-R); triangles: char from biomass torrefied to 270!C (HHR-T-270); squares: char from biomass torrefied to 290!C (HHR-T-290).
Table 4
Arrhenius parameters for oxidative reactivity; seeTable 1 for an explanation of sample codes. R = Aexp($EA/(RT)), where T is in Kelvin.
Sample code A (sec$1) EA(kJ/mole) Temperature range for Arrhenius fit (!C) Conversion, X, over range of Arrhenius fit LHR-1000-R 14.7 66.1 390–580 5–70 LHR-1000-T-290 21.4 69.1 390–590 5–70 LHR-850-R 17.6 65.7 390–570 5–70 LHR-850-T-290 112 79.1 420–580 5–70 HHR-R 7.44 53.2 360–490 5–70 HHR-T-270 4.15 54.0 390–540 5–70 HHR-T-290 4.93 54.4 390–530 5–70
2004) which means that burnout times or reactor temperatures se-lected for coal should be adequate even for torrefied biomass. 5. Conclusions
Torrefied biomass is viewed as an attractive feedstock for com-bustion and gasification, mainly because of its advantages over raw biomass in storage, handling, and transportation. The current study has found lower combustion and gasification reactivities for chars produced from torrefied biomass fuels, in comparison to those pro-duced from the same raw biomass fuels, especially under high-heating-rate charring conditions. These char reactivity differences imply that combustor and gasifier design or operating conditions may need to be adjusted when switching from a raw biomass to a torrefied biomass fuel. The causes of the reactivity differences can be resolved only through further research.
Acknowledgements
We acknowledge the financial assistance of Cornell’s ADVANCE Center, funded by NSF Grant #0547373, and of UK Engineering and
Physical Sciences Research Council Grant EP/HO48839. EMF thanks Dr. Xiaomian Baxter, Univ. of Leeds for her help.
Appendix A. Supplementary data
Supplementary data associated with this article can be found, in
the online version, at http://dx.doi.org/10.1016/
j.biortech.2012.05.109. References
Almeida, G., Commandré, J.M., Duplan, J.L., Dupont, C., Leboutte, D., Melkior, T., Perré, P., Rémond, R., Rousset, P., Sajet P., Sanz-Garcia, E., 2009. From biomass torrefaction to solid injection in pressurized gasifier: model and experiences, 17th European Conference on Biomass, Hamburg.
Arias, B., Pevida, C., Fermoso, J., Plaza, M.G., Rubiera, F., Pis, J.J., 2008. Influence of torrefaction on the grindability and reactivity of woody biomass. Fuel Process. Technol. 89, 169–175.
Avila, C., Pang, C.H., Wu, C.T., Lester, E., 2011. Morphology and reactivity characteristics of biomass particles. Bioresour. Technol. 102, 5237–5243. Bridgeman, T., 2008. Enhancing the Fuel Properties of Solid Biofuels by Torrefaction,
University of Leeds, PhD Thesis.
Bridgeman, T.G., Jones, J.M., Shield, I., Williams, P.T., 2008. Torrefaction of reed canary grass, wheat straw and willow to enhance solid fuel qualities and combustion properties. Fuel 87, 844–856.
Bridgeman, T.G., Jones, J.M., Williams, A., Waldron, D.J., 2010. An investigation of the grindability of two torrefied energy crops. Fuel 89, 3911–3918.
BS EN 15104:2011 ‘‘Solid biofuels. Determination of total content of carbon, hydrogen and nitrogen. Instrumental methods’’.
Cetin, E., Moghtaderi, B., Gupta, R., Wall, T.F., 2004. Influence of pyrolysis conditions on the structure and gasification reactivity of biomass chars. Fuel, 2139–2150. Chen, W.-H., Cheng, W.-Y., Lu, K.-M., Huang, Y.-P., 2011. An evaluation on improvement of pulverized biomass property for solid fuel through torrefaction. Appl. Energy 88, 3636–3644.
Chew, J.J., Doshi, V., 2011. Recent advances in biomass pretreatment – torrefaction fundamentals and technology. Renew. Sust. Energy Rev. 15, 4212–4222. Commandré, J.-M., Salvador, S., VanDeSteene, L., Gadiou, R., 2005. The formation
and reduction of NO during the combustion of powdered petroleum coke – the case of cement plant precalciner conditions. Combust. Sci. Technol. 177, 579– 611.
Costa, M., Silva, P., Azevedo, J.L.T., 2003. Measurements of gas species, temperature, and char burnout in a low NOx pulverized-coal-fired utility boiler. Combust. Sci. Technol. 175, 271–289.
Couhert, C., Salvador, S., Commandré, J.M., 2009. Impact of torrefaction on syngas production from wood. Fuel 88, 2286–2290.
Dall’Ora, M., Jensen, P.A., Jensen, A.D., 2008. Suspension combustion of wood: influence of pyrolysis conditions on char yield, morphology, and reactivity. Energy Fuels 22, 2955–2962.
DD CEN/TS 14774–3: 2004a, Solid biofuels, Methods for the determination of moisture content - Oven dry method - Part 3: Moisture in general analysis sample.
DD CEN/TS 15148:2005, Solid biofuels, Method for the determination of the content of volatile matter.
DD CEN/TS 14775:2004b, Solid biofuels, Method for the determination of ash content.
Di Blasi, C., 2009. Combustion and gasification rates of lignocellulosic chars. Prog. Energy Combust. Sci. 49, 2658–2671.
Dupont, C., Commandré, J.M., Gauthier, P., Boissonet, G., Salvador, S., Schweich, D., 2008. Biomass pyrolysis experiments in an analytical entrained flow reactor between 1073 and 1273 K. Fuel 87, 1155–1164.
Dupont, C., Nocquet, T., Da Costa Jr., J.A., Verne-Tournon, C., 2011. Kinetic modelling of steam gasification of various woody biomass chars: influence of inorganic elements. Bioresour. Technol. 102, 9743–9748.
Guerrero, M., Ruiz, M.P., Alzueta, M.U., Bilbao, R., Millera, A., 2005. Pyrolysis of eucalyptus at different heating rates: studies of char characterization and oxidative reactivity. J. Anal. Appl. Pyrolysis 74, 307–314.
Jones, J.M., Pourkashanian, M., Williams, A., Rowland, L., Zhu, W., Thomas, K.M., 2004. Conversion of char nitrogen to NO during combustion. J. Energy Inst. 77, 82–89.
Marquez-Montesinos, F., Cordero, T., Rodriguez-Mirasol, J., Rodriguez, J.J., 2002. CO2
and steam gasification of grapefruit skin char. Fuel 81, 423–429.
Mehrabian, R., Scharler, R., Obernberger, I., 2011. Effects of pyrolysis conditions on the heating rate in biomass particles and applicability of TGA kinetic parameters in particle thermal conversion modeling. Fuel 93, 567–575. Mermoud, F., Salvador, S., Van de Steene, L., Golfier, F., 2006. Influence of the
pyrolysis heating rate on the steam gasification rate of large wood char particles. Fuel 85, 1473–1482.
Nocquet, T.,2009. Rapport - Détermination d’un modèle cinétique de vapogazéification de différentes biomasses forestières à l’aide d’essais en thermobalance, CEA Grenoble.
Repellin, B., Govin, A., Rolland, M., Guyonnet, R., 2010. Energy requirement for fine grinding of torrefied wood. Biomass Bioenergy 34, 923–930.
0 10 20 30 LHR-850-T-290 LHR-850-R HHR-T-290 HHR-R Sample code Average reactivity for X=1-80%. %/min 0 20 40 60 80 100 0 1000 2000 3000 Time, s Conversion, % HHR-R HHR-T-290 LHR-850-R LHR-850-T-290 0 0.1 0.2 0.3 0.4 0 10 20 30 40 50 60 70 80 90 100 X, % Instantaneous reactivity, %/ s HHR-R HHR-T-290 LHR-850-R LHR-850-T-290
(a)
(b)
(c)
Fig. 6. Gasification reactivity: (a) Average gasification reactivity of chars for conversion between 5 and 70% (b) Conversion of chars versus time (c) Instanta-neous gasification reactivity.
Salvador, S., Commandré, J.M., Stanmore, B., 2003. Reaction rates for the oxidation of highly sulphurised petroleum cokes: the influence of thermogravimetric conditions and some coke properties. Fuel 82, 715–720.
Shim, H.S., Hurt, R.H., 2000. Thermal annealing of chars form diverse organic precursors under combustion-like conditions. Energy Fuels 14, 340–348. Skeen, S.A., Kumfer, B.M., Axelbaum, R.L., 2010. Nitric oxide emissions during coal
and coal/biomass combustion under air-fired and oxy-fuel conditions. Energy Fuels 24, 4144–4152.
Svoboda, K., Porohely, M., Hartman, M., Martinec, J., 2009. Pretreatment and feeding of biomass for pressurized entrained flow gasification. Fuel Process. Technol. 90, 629–635.
Tillman, D.A., 2000. Biomass cofiring: the technology, the experience, the combustion consequences. Biomass Bioenergy 19, 365–384.
Van de Steene, L., Salvador, S., Charnay, G., 2000. Controlling powdered fuel combustion at low temperature in a new entrained flow reactor. Combust. Sci. Technol. 159, 255–279.
Zhang, S.-Y., Lu, J.-F., Zhang, J.-S., Yue, G.-X., 2008. Effect of pyrolysis intensity on the reactivity of coal char. Energy Fuels 22, 3213–3221.
Zhu, W., Song, W., Lin, W., 2008. Effect of the coal particle size on pyrolysis and char reactivity for two types of coal and demineralized coal. Energy Fuels 22, 2482– 2487.