HAL Id: hal-01584365
https://hal.archives-ouvertes.fr/hal-01584365
Submitted on 8 Sep 2017HAL is a multi-disciplinary open access
archive for the deposit and dissemination of sci-entific research documents, whether they are pub-lished or not. The documents may come from teaching and research institutions in France or abroad, or from public or private research centers.
L’archive ouverte pluridisciplinaire HAL, est destinée au dépôt et à la diffusion de documents scientifiques de niveau recherche, publiés ou non, émanant des établissements d’enseignement et de recherche français ou étrangers, des laboratoires publics ou privés.
J.B. Féret, A.A. Gitelson, S.D. Noble, S. Jacquemoud
To cite this version:
J.B. Féret, A.A. Gitelson, S.D. Noble, S. Jacquemoud. PROSPECT-D: towards modeling leaf optical properties through a complete lifecycle. Remote Sensing of Environment, Elsevier, 2017, 193 (may), pp.204-215. �10.1016/j.rse.2017.03.004�. �hal-01584365�
1 PROSPECT-D: towards modeling leaf optical properties through a complete lifecycle
1
J.-B. Féret1, A.A. Gitelson2, 3, S.D. Noble4, S. Jacquemoud5 2
1
Irtsea, UMR TETIS, Maison de la Télédétection, 500 Rue Jean François Breton, 34000 Montpellier, 3
France 4
2
Faculty of Civil and Environmental Engineering, Israel Institute of Technology, Technion City, Haifa, 5
Israel 6
3
School of Natural Resources, University of Nebraska, Lincoln, USA 7
4
College of Engineering, University of Saskatchewan, 57 Campus Drive, Saskatoon, SK, S7N 5A9, 8
Canada 9
5
Institut de physique du globe de Paris - Sorbonne Paris Cité, Université Paris Diderot, UMR CNRS 10
7154, Case 7071, 35 rue Hélène Brion, 75013 Paris, France 11
Date: Friday, January 13, 2017
12
Keywords: Anthocyanins, Pigments, Hyperspectral, Leaf optical properties, PROSPECT, Radiative
13
transfer model 14
Abstract
15
Leaf pigments provide valuable information about plant physiology. High resolution monitoring of 16
their dynamics will give access to better understanding of processes occurring at different scales, and 17
will be particularly important for ecologists, farmers, and decision makers to assess the influence of 18
climate change on plant functions, and the adaptation of forest, crop, and other plant canopies. In 19
this article, we present a new version of the widely-used PROSPECT model, hereafter named 20
PROSPECT-D for dynamic, which adds anthocyanins to chlorophylls and carotenoids, the two plant 21
pigments in the current version. We describe the evolution and improvements of PROSPECT-D 22
compared to the previous versions, and perform a validation on various experimental datasets. Our 23
results show that PROSPECT-D outperforms all the previous versions. Model prediction uncertainty is 24
decreased and photosynthetic pigments are better retrieved. This is particularly the case for leaf 25
carotenoids, the estimation of which is particularly challenging. PROSPECT-D is also able to simulate 26
realistic leaf optical properties with minimal error in the visible domain, and similar performances to 27
other versions in the near infrared and shortwave infrared domains. 28
2
1. Introduction
29
Climate change is expected to affect vegetation worldwide, influencing air temperature, 30
biogeochemical cycles, and the frequency and intensity of plant disease. Leaf pigments are key 31
components of life on Earth: they are major contributors to individual plant health via complex 32
mechanisms allowing photosynthesis, plant growth, protection, adaptation to environmental 33
changes and phenological events. Their dynamics directly affects nutrient, nitrogen, carbon and 34
water cycles (Shipley et al., 2006; Joiner et al., 2011). Leaf pigments are therefore good indicators of 35
changes in environmental conditions from local to global scales. 36
Three main families of pigments are found in leaves: chlorophylls, carotenoids, and 37
anthocyanins. Chlorophyll–a and –b, the two types of molecules in higher plants, are the 38
fundamental light-absorbing pigments involved in photosynthesis. Carotenoids are accessory 39
pigments that contribute to light-harvesting and they also have essential photo-protective 40
properties. If xanthophylls and carotenes are the two major divisions of the carotenoid group, more 41
than 700 naturally occurring molecules have been identified so far, mainly in tissues other than 42
leaves (Britton et al., 2004). Anthocyanins are part of the flavonoid family: they are closely associated 43
with the colors in the autumn foliage of deciduous plant species. The term anthocyanin (anthos being 44
Greek for flower, and kyanos for blue) has been used since Marquart (1835) to represent the coloring 45
matter responsible for the various colors found in flowers, fruits and foliage in many plant species. 46
The exception are the core Caryophyllales, most of which produce betalains (betacyanins and 47
betaxanthins) (Brockington et al., 2011). While these betalain-producing families do include several 48
species of notable agronomic interest, both crops and weeds, they represent a small fraction of 49
plants investigated in a remote sensing context and are not considered in this work. 50
The anthocyanins include over 500 molecules, which accumulate in the vacuoles of various 51
cells and tissues. They create a pink, red, purple or blue coloration in the tissue depending on the 52
molecule, temperature, pH, and the presence or not of other molecules that may interact with them 53
(Davies, 2004; Gould et al., 2009). Their role is still not fully understood and described. For example, 54
3 until recently their biosynthesis during senescence was suspected to be nature’s extravagancy 55
without a vital function, resulting from evolution in the absence of selection (Matile, 2000), and the 56
reason for their presence was explained as a by-product of the flavonoid biosynthetic pathway. 57
However, research over the past twenty years has demonstrated multiple functional implications of 58
these pigments during the plant life cycle, to the point that they have been called the “Nature’s Swiss 59
army knife” by Gould (2004). Among the identified functions of anthocyanins are the protection of 60
the photosynthetic apparatus from damage due to excess light (Lee and Gould, 2002), environmental 61
stresses such as freezing or air pollution, plant pathogens, and predation (Lev-Yadun and Gould, 62
2008). An exhaustive review of the role of anthocyanins in plant leaves can be found in (Davies, 2004) 63
and (Gould, 2004). 64
Leaf pigments interact with solar radiation and change in response to environmental 65
conditions to optimize plant metabolism following complex pathways, within constraints of available 66
resources and stressors. As a result, leaf optical properties are directly impacted by the composition 67
of pigments. Remote sensing has proved to be a particularly suitable tool for the estimation of leaf 68
pigments, both at level of the leaf (e.g., Féret et al., 2008; Gitelson et al., 2006; le Maire et al., 2004; 69
Richardson et al., 2002; Sims and Gamon, 2002) and the canopy (e.g., Asner et al., 2015b; Atzberger 70
et al., 2010; Gitelson et al., 2005; Haboudane, 2004; Hmimina et al., 2015). The retrieval of pigment 71
content from remote sensing data involves two main approaches. The first approach is data-driven. It 72
includes univariate statistical models derived from spectral indices (e.g., Gitelson et al., 2006), 73
multivariate statistical models such as partial least squared regressions (e.g., Asner and Martin, 2009) 74
and machine learning algorithms (e.g., Verrelst et al., 2015). The relationships derived from these 75
predictive models are usually established empirically; they strongly depend on the variability and 76
quality of the data used to adjust these models, therefore they may lack robustness. The second 77
approach is based on radiative transfer models that exist both at leaf and canopy scales. Leaf models 78
generally simulate their spectral directional-hemispherical reflectance and transmittance while 79
canopy models simulate their spectral and bidirectional reflectance assuming that the leaf and soil 80
4 optical properties, the vegetation architecture, and the conditions of acquisition are known. The 81
combination of the two approaches (data-driven and physical) is also becoming increasingly popular 82
because it provides alternatives to extensive data collection required by the first, and high 83
computational resources required by the second (Féret et al., 2011; Verrelst et al., 2015). 84
To date, most studies devoted to vegetation pigments have focused on chlorophyll. This can be 85
explained by multiple factors. First, leaf chlorophyll content is the variable that has the strongest 86
effect on canopy reflectance in the VIS, and is a valuable proxy of nitrogen content and gross primary 87
production (e.g., Gitelson et al., 2012; Peng and Gitelson, 2012), which have strong impact in terms 88
of food and biomass production globally. Second, leaf chlorophyll content can be estimated with 89
relatively good accuracy using simple statistical regression models based on the relationship between 90
this variable and various spectral indices (e.g. Féret et al., 2011; Gitelson et al., 2006; le Maire et al., 91
2004). Third, the availability of physical models including chlorophyll as input parameters allowed 92
investigating and better understanding its influence on the signal measured by satellite sensors, 93
leading to improved predictive models for leaf and canopy chlorophyll content in a more systematic 94
way than experimental data collection would have permitted. This is the case of the combined 95
PROSPECT leaf optical properties model (Jacquemoud and Baret, 1990) and SAIL canopy bidirectional 96
reflectance model (Verhoef, 1984; Verhoef et al., 2007), also referred to as PROSAIL, which has been 97
used for more than 25 years (Jacquemoud et al., 2009). 98
Current challenges such as food security, global warming and massive biodiversity loss now 99
require fine monitoring of vegetation status, with a level of information beyond inputs provided by 100
chlorophyll content alone. We need to address various issues related to vegetation, including stress, 101
invasive species, plant diseases and photosynthetic phenology, which implies monitoring the 102
dynamic of various pigment types such as carotenoids (Gamon et al., 2016) and anthocyanins. One of 103
the most studied “pigment-related” indicators derived from remote sensing is the Photochemical 104
Reflectance Index (PRI, Gamon et al., 1992) based on two narrow spectral bands in the green 105
spectrum: the PRI related to the xanthophyll cycle in the leaf; it captures the physiological response 106
5 of vegetation in response to a short term environmental stress inducting slight changes in 107
photosynthetic activity (Gamon et al., 1997, 1992, 1990). However, the primary driver of the PRI over 108
long time periods, at both leaf and canopy scales, is not the xanthophyll cycle, but rather the 109
changing leaf carotenoid pigment pool, typically expressed as the changing ratio of chlorophyll to 110
carotenoid pigments (or its inverse) (Filella et al., 2009; Nakaji et al., 2006; Stylinski et al., 2002). 111
Therefore, information about pigment content in vegetation is crucial when monitoring 112
photosynthetic phenology. At local scale, estimating pigment content from individuals using portable 113
devices, close range remote sensing or UAV can be useful for monitoring purposes in precision 114
agriculture or ecophysiology. At global scale, the ability to precisely monitor photosynthetic 115
phenology with satellite imagery is extremely valuable and would provide important input for models 116
of global terrestrial carbon uptake. Few studies focus on the direct estimation of carotenoids at leaf 117
scale (Chappelle et al., 1992; Gitelson et al., 2006, 2001; Sims and Gamon, 2002) and canopy scale 118
(Asner et al., 2015a, 2015b; Gamon et al., 2016; Hernández-Clemente et al., 2014, 2012; Ustin et al., 119
2009; Zarco-Tejada et al., 2013). Even fewer focus on the estimation of anthocyanin, also at leaf 120
(Gamon and Surfus, 1999; Gitelson et al., 2001, 2006; Sims and Gamon, 2002; Steele et al., 2009) and 121
canopy (Rundquist et al., 2014) scales. The presence of overlapping features in the specific 122
absorption coefficient (SAC) of carotenoids and anthocyanins makes it difficult to separate and 123
quantify these accessory pigments using basic methods such as spectral indices, especially at canopy 124
scale (Ustin et al., 2009). 125
Monitoring vegetation status, stress, and shifts in the ecosystem functional properties is 126
critical. It will require sophisticated methods of leaf pigment content estimation, possibly combined 127
with the next generation of high resolution imaging spectrometers like Hyspiri (NASA), EnMAP (DLR) 128
or Hypxim (CNES), and vegetation radiative transfer models that incorporate all major pigments. 129
Present leaf optical properties models do not include pigments other than chlorophylls and 130
carotenoids, limiting the application of the physical approach to the study of these pigments 131
(Blackburn, 2007). SLOP (Maier et al., 1999), PROSPECT-5 (Féret et al., 2008), and soon after LIBERTY, 132
6 specifically designed for pine needles (Di Vittorio, 2009), are the three models that use carotenoids. 133
The dorsiventral leaf model designed by Stuckens et al. (2009) also differentiates chlorophylls from 134
carotenoids, but the SACs are those used in PROSPECT-5. 135
This article introduces a new version of the widely-used PROSPECT model, called PROSPECT-D, 136
which for the first time includes all three main pigments that control the optical properties of fresh 137
leaves, i.e., chlorophylls, carotenoids, and anthocyanins. The suffix -D stands for "dynamic" because 138
the model makes it possible to simulate leaf optical properties through a complete lifecycle, from 139
emergence, to anthocyanin-expressing stress responses, through to senescence. Given the success 140
and widespread use of PROSPECT-5, a major requirement for the development of PROSPECT-D was 141
to preserve, and ideally to improve on, the performance of PROSPECT-5 for pigment estimation in 142
samples containing little or no anthocyanin, while adding support for those that do. We performed a 143
new calibration of the SAC of each pigment, and updated the refractive index used by the model. 144
PROSPECT-D was then tested on several datasets displaying many plant species with a large range of 145
leaf traits including pigment composition. We evaluated its performance using two criteria resulting 146
from iterative optimization of leaf chemical and structural properties: the difference between the 147
measured and the modeled leaf directional-hemispherical reflectance and transmittance spectra, 148
and the accuracy of corresponding pigment estimation. We compared these two criteria for the new 149
and current versions of the model. 150
151
2. Calibration of the model
152
Several strategies for the calibration of PROSPECT have been investigated since its first version. 153
All of the procedures have points in common, such as the adjustment of one or several optical 154
constants (SAC of leaf chemical constituents, refractive index) over the VIS, near infrared and 155
shortwave infrared (SWIR) domains. A standard method consists in determining the optical constants 156
individually or simultaneously at each wavelength by using an iterative procedure (Féret et al., 2008; 157
Li and Wang, 2011). So far, there is no unique method, and adaptations have been proposed to 158
7 calibrate PROSPECT: Malenovský et al. (2006) adjusted SACs for needle-shaped leaves; Féret et al. 159
(2008) have simultaneously determined the refractive index and SAC of leaf constituents; Chen and 160
Weng (2012) have computed an individual refractive index for each leaf sample. In this section, we 161
provide information about the calibration of PROSPECT-D, including the selection of the calibration 162
dataset, as well as the main steps leading to updated optical constants. 163
2.1. Available datasets
164
Six independent datasets collected by several researchers for diverse purposes have been used 165
in this study (Table 1). They share directional-hemispherical reflectance and/or transmittance 166
spectra, and at least two pigments out of three (chlorophylls, carotenoids, and anthocyanins) 167
measured using wet chemistry. The ANGERS dataset includes more than 40 plant species; all the 168
other datasets are monospecies: European hazel (Corylus avellana L.) in HAZEL, Norway maple (Acer 169
platanoides L.) in MAPLE, Virginia creeper (Parthenocissus quinquefolia (L.) Planch) in VIRGINIA, and 170
Siberian dogwood (Cornus alba L.) in DOGWOOD-1 and -2. Table 1 summarizes the spectral and 171
chemical information available for each dataset. Additional information about the protocols used to 172
conduct the experiments, collect the leaves, measure their optical properties and determine their 173
wet chemistry can be found in (Féret et al., 2008; Gitelson et al., 2009, 2006, 2001; Merzlyak et al., 174
2008). Note that DOGWOOD-2 does not contain transmittance spectra; that the total chlorophyll 175
content (𝐶𝑎𝑏, expressed in g cm2) is available in all datasets; that the total carotenoid content (𝐶𝑥𝑐,
176
expressed in g cm2) and the total anthocyanin content (𝐶𝑎𝑛𝑡ℎ, expressed in g cm2) have not been
177
determined in HAZEL and ANGERS, respectively. Finally, the 400-780 nm spectral range used for the 178
calibration of the pigment content is common to all datasets except DOGWOOD-1. 179
8
Table 1. Description of the leaf datasets used in this study. * The ANGER dataset is available online http://opticleaf.ipgp.fr/index.php?page=database. 181
Database Reference Spectral range (nm) Number of leaves Optical properties Chlorophyll content 𝑪𝒂𝒃 (g cm2 ) Carotenoid content 𝑪𝒙𝒄 (g cm2 ) Anthocyanin content 𝑪𝒂𝒏𝒕𝒉 (g cm2) Mean SD Min Max Mean SD Min Max Mean SD Min Max
ANGERS* 1, 2 400-2500 308 R & T 34.41 21.85 0.78 106.70 8.84 5.14 0.00 25.28 N/A N/A N/A
VIRGINIA 3, 4 400-800 81 R & T 11.05 14.60 0.09 53.76 2.98 3.06 0.15 12.27 8.63 10.77 0.00 37.50
MAPLE 3, 4, 6 400-780 48 R & T 7.43 7.36 0.14 32.98 5.25 2.37 1.82 10.40 8.75 6.83 1.12 21.66
DOGWOOD-1 3, 4, 5 440-796 20 R & T 4.53 4.84 0.07 15.03 2.96 2.06 0.42 5.71 6.88 5.52 0.40 15.49
HAZEL 3, 4 400-800 13 R & T 26.37 3.55 22.69 34.62 N/A N/A N/A 7.13 4.19 0.25 13.61
DOGWOOD-2 6 400-1000 51 R 23.77 7.58 1.53 39.81 5.39 2.26 1.73 10.76 12.71 8.21 1.07 30.23
1: Féret et al. (2008); 2: Féret et al. (2011); 3: Merzlyak et al. (2008); 4: Gitelson et al. (2009); 5: Gitelson et al., (2001); 6: Gitelson et al. (2006). 182
9 184
2.2. Data selection for calibration
185
The calibration of PROSPECT-D requires the leaf samples to have general properties at a 186
minimal level: i) pigment content expressed in the same unit for chlorophylls, carotenoids, and 187
anthocyanins, and ii) reflectance and transmittance spectra in the 400-780 nm wavelength range. A 188
challenge to calibrating a high performance leaf optical properties model is the lack of 189
comprehensive datasets meeting these two criteria. Among those available, only VIRGINIA and 190
MAPLE fulfill these conditions. Preliminary calibration tests using part or all of these datasets led to 191
SACs with strong discrepancies and poor performances for the estimation of pigment content. 192
Therefore we considered alternative methods combining different data sources and expanding the 193
pool of available calibration data to fill in the gaps. Féret et al. (2008) exploited the ANGERS dataset 194
to calibrate PROSPECT-4 and -5. It is characterized by a wide range of leaf types and pigment 195
contents, and it proved to be well suited for the determination of the SAC of the chlorophyll and 196
carotenoid pigments. These desirable properties of ANGERS come from the variety of leaf types: 197
while chlorophyll and carotenoids contents are usually highly correlated in mature leaves, ANGERS 198
includes juvenile, stressed and senescent leaves lowering this correlation and allowing the SAC of 199
each of these pigments to be adjusted independently from the others, despite their overlapping 200
domain of absorption. Therefore we took the decision to include ANGERS in the calibration dataset 201
and to estimate the corresponding 𝐶𝑎𝑛𝑡ℎ using a spectral index. To avoid the associated uncertainty
202
leading to errors in the SACs, we combined a subset of ANGERS with a subset of VIRGINIA that 203
included accurate measurements of 𝐶𝑎𝑛𝑡ℎ obtained by wet chemistry (Merzlyak et al., 2008). Leaves
204
from VIRGINIA were collected in a park at Moscow State University; they contained very high levels 205
of anthocyanin and low to moderate levels of chlorophyll and carotenoids; they displayed the 206
maximum range of anthocyanin among all the available datasets. In this section, we first explain how 207
𝐶𝑎𝑛𝑡ℎ was estimated in ANGERS, and then how we split ANGERS and VIRGINIA into calibration and 208
10 validation subsets. Finally, we present a sensitivity study intended to analyze the influence of the 209
expected 𝐶𝑎𝑛𝑡ℎ uncertainty in ANGERS on the performances of the model.
210 211
2.2.a. Estimation of leaf anthocyanin content in ANGERS
212
Several nondestructive methods to estimate 𝐶𝑎𝑛𝑡ℎ from leaf reflectance have been identified
213
and tested on experimental data for which the anthocyanin content has been measured. These 214
methods included spectral indices and machine learning algorithms such as support vector regression 215
(Gitelson et al., 2001, 2006, 2009; van den Berg and Perkins, 2005; Pfündel et al., 2007). The modified 216
Anthocyanin Reflectance Index (𝑚𝐴𝑅𝐼) designed by Gitelson et al. (2006) led to the best results 217
when using a leave-one-out cross-validation. This index is defined by: 218
219 220
𝑚𝐴𝑅𝐼 = (𝑅𝑔𝑟𝑒𝑒𝑛−1 − 𝑅𝑟𝑒𝑑 𝑒𝑑𝑔𝑒−1 ) × 𝑅𝑁𝐼𝑅 Eq. 1
221
where 𝑅𝑔𝑟𝑒𝑒𝑛 is the mean reflectance between 540 nm and 560 nm, 𝑅𝑟𝑒𝑑 𝑒𝑑𝑔𝑒 the mean reflectance
222
between 690 nm and 710 nm, and 𝑅𝑁𝐼𝑅 the mean reflectance between 760 nm and 800 nm. We first
223
studied the relationship between 𝑚𝐴𝑅𝐼 and 𝐶𝑎𝑛𝑡ℎ over the 213 samples for which information about
224
anthocyanins was available, i.e., all datasets of Table 1 with the exception of ANGERS. We found a 225
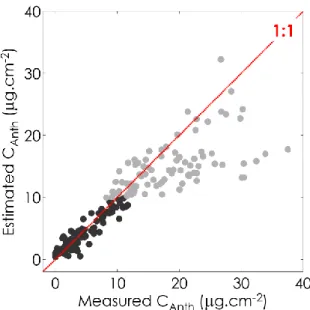
strong linear relationship for 𝑚𝐴𝑅𝐼 values smaller than 5 (137 samples, R2 = 0.90, RMSE = 1.18 µg 226
cm2) and a weak one for 𝑚𝐴𝑅𝐼 values greater than 5 (76 samples, R2 = 0.37, RMSE = 6.35 µg cm2) 227
(Figure 1). These samples with 𝑚𝐴𝑅𝐼 < 5 correspond to mature green, yellow, and reddish/red 228
leaves with 𝐶𝑎𝑛𝑡ℎ values less than 12 µg cm2. Leaves with 𝐶𝑎𝑛𝑡ℎ values higher than 12 µg cm2 are
229
generally dark red and contain small amounts of chlorophyll. In that case, absorptance between 540 230
nm and 560 nm exceeded 90% and further increases of anthocyanin did not change leaf optical 231
properties. A linear model for anthocyanin estimation (Eq. 2) was then derived from the subset 232
excluding the samples with 𝑚𝐴𝑅𝐼 > 5 and 𝐶𝑎𝑛𝑡ℎ> 12 µ𝑔 cm2.
11 234
𝐶𝑎𝑛𝑡ℎ= 2.11 × 𝑚𝐴𝑅𝐼 + 0.45 Eq. 2
235
Eq. 2 was applied to the ANGERS dataset to determine 𝐶𝑎𝑛𝑡ℎ. The anthocyanin content ranged
236
from 0 to 17.1 µg cm2, with a mean value of 1.7 µg cm2. 237
238
Figure 1. Relationship between 𝐶𝑎𝑛𝑡ℎ obtained from wet chemistry and 𝐶𝑎𝑛𝑡ℎ estimated from
reflectance data after application of Eq. 2. The black dots correspond to the 137 leaf samples with 𝑚𝐴𝑅𝐼 < 5 (R2
= 0.90) and the grey dots correspond to the 76 leaf samples with 𝑚𝐴𝑅𝐼 > 5 (R2 = 0.37). Eq. 2 was adjusted only on the black dots.
2.2.b. Selection of the calibration samples
239
In order to keep as many samples as possible, we decided to build a calibration dataset made of leaf 240
samples selected both in ANGERS and VIRGINIA. The influence of the uncertainty associated to 𝐶𝑎𝑛𝑡ℎ
241
in ANGERS is expected to be mitigated by the accuracy of 𝐶𝑎𝑛𝑡ℎ in VIRGINIA.
242
In VIRGINIA we identified samples characterized by low 𝐶𝑎𝑏 (< 20 𝜇𝑔 𝑐𝑚−2) and 𝐶𝑥𝑐 (< 5 𝜇𝑔 𝑐𝑚−2)
243
in order to decrease the combined influence of the pigments on leaf optical properties, but also to 244
minimize the correlation among pigments. It should allow capturing the influence of anthocyanins 245
12 independently from the other pigments. We randomly selected 20 samples, leaving a total of 61 246
samples of VIRGINIA for the validation. 247
In ANGERS we discarded at first 14 atypical samples, the spectral behavior of which was 248
incompatible with PROSPECT assumptions. For example, we removed samples collected on 249
Eucalyptus gunnii and Cornus alba, the overall reflectance of which was very high in the VIS because 250
of the presence of wax (Barry and Newnham, 2012); and three samples of Schefflera arboricola 251
displaying uncharacteristic optical properties in the blue (400-450 nm). We also removed samples 252
with 𝑚𝐴𝑅𝐼 > 5 as the uncertainty associated to 𝐶𝑎𝑛𝑡ℎ was particularly high (Figure 1). Finally we
253
eliminated leaf samples that had little influence on the calibrated SACs. For that purpose we 254
determined a reference SAC for each pigment using the 314 preselected leaf samples (20 from 255
VIRGINIA and 294 from ANGERS). The ANGERS samples inducing changes in the SACs higher than 5% 256
between 425 nm and 475 nm were kept in the calibration datasets, the others were transferred to 257
the validation dataset. 258
In total, a dataset named CALIBRATION and combining subsets of ANGERS (144 samples) and 259
VIRGINIA (20 samples) was used for the calibration phase. 260
2.2.c. Sensitivity of the calibration to the uncertainty associated with 𝑪𝒂𝒏𝒕𝒉 in ANGERS
261
As abovementioned, determining 𝐶𝑎𝑛𝑡ℎ with a spectral index like 𝑚𝐴𝑅𝐼 leads to uncertainty likely to
262
impact the quality of the calibration. We performed a sensitivity analysis with the aim of 263
understanding the influence of this uncertainty on the SACs and on the overall performances of the 264
model. It consisted in adding a Gaussian noise ( = 1.18 µg cm2) to 𝐶𝑎𝑛𝑡ℎ in ANGERS prior to the
265
calibration and validation procedure. We repeated the operation 50 times. 266
267
2.3. Selection of the refractive index
268
PROSPECT is based on the generalized plate model proposed by (Allen et al., 1970, 1969). A 269
plant leaf is modeled as a pile of elementary layers characterized by an absorption coefficient and a 270
refractive index provided at a given wavelength. In the first version of the model, Jacquemoud and 271
13 Baret (1990) used an albino maize leaf to obtain an experimental spectrum of the refractive index for 272
the elementary layers. le Maire et al. (2004) and Féret et al. (2008) adopted a new strategy based on 273
numerical optimization to determine the optical constants of PROSPECT at the same time. Their 274
refractive index performed slightly better than the previous versions at estimating leaf chemical 275
constituents, but the strong spectral variations observed in the visible wavelengths induced small 276
artifacts in the optical properties of leaves displaying high pigment content. Stuckens et al. (2009) 277
also adjusted a unique refractive index for all leaves. 278
Attempts to obtain a unique refractive index spectrum for all leaves are actually unfounded 279
and inconsistent with the Kramers-Kronig relations that state that the real (refractive index) and 280
imaginary (absorption coefficient) parts of the complex refractive index of a medium are physically 281
linked (Lucarini et al., 2005). These relations allow direct computation of the refractive index of a 282
medium based on its absorption properties on an extended spectral domain. Chen and Weng (2012) 283
used the Kramers-Kronig relations to derive an effective refractive index adjusted to each leaf 284
sample, obtaining very promising results. However, leaf chemical and spectral databases are often 285
incomplete; in particular they cover a limited range of the electromagnetic spectrum, so such a 286
method is impracticable. As a consequence we considered the refractive index to be independent of 287
the leaf sample in this study, but changed strategy compared to PROSPECT-5 in order to avoid the 288
abovementioned artifacts resulting from numerical optimization. Two options were tested: 1) using 289
the refractive index imbedded in PROSPECT-3, and 2) taking the average refractive index derived 290
from minimum and maximum values computed by Chen and Weng (2012) and corresponding to the 291
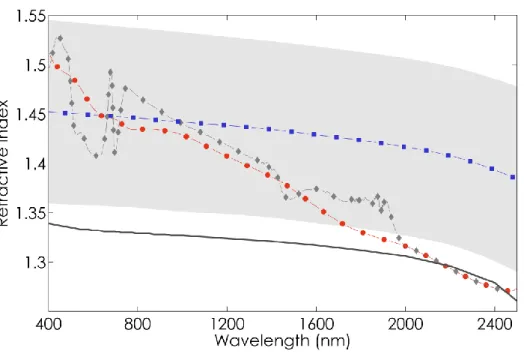
boundaries of the grey area in Figure 2. The spectra displayed in Figure 2 strongly differ in shape in 292
the VIS: the overall profile of the refractive indices computed by Chen and Weng (2012) is quite 293
similar to that measured for pure liquid water (Hale and Querry, 1973), gradually decreasing from the 294
visible to the infrared, whereas the indices in PROSPECT-3 and -5 are very much alike in the near and 295
shortwave infrared (1000-2500 nm) and show a steeper decrease. Divergence between the refractive 296
index derived from Chen and Weng (2012) and those used in PROSPECT-3 and -5 strongly increases 297
14 with wavelength. We performed the full calibration of PROSPECT (including optimal adjustment of 298
SAC as described in Section 2.2.b) with each refractive index. 299
300
Figure 2. Comparison of the refractive index used in PROSPECT-3 (red dots), PROSPECT-5 (grey
diamonds) and corresponding to the mean refractive index proposed by (Chen and Weng, 2012) (blue squares). The grey area corresponds to the range of variation of the refractive index proposed
by Chen and Weng, (2012); the plain grey line corresponds to the refractive index for pure liquid water (Hale and Querry, 1973).
301
2.4. Optimal adjustment of the specific absorption coefficients
302
The adjustment of the SAC for each group of pigments is based on numerical optimization 303
routines applied to experimental data. As in PROSPECT-5 we assumed that the chlorophyll a:b ratio 304
was constant and we combined carotenes and xanthophylls in the carotenoid group. Similarly 305
anthocyanins were assumed to include all types of anthocyanins contributing to light absorption in 306
the VIS. Given the well-known sensitivity of the anthocyanin absorption properties to pH, which is 307
due to a reversible structural change that occurs in the C ring of the molecule, this hypothesis may be 308
15 incorrect in certain situations. However, environment inside a vacuole is generally slightly acid, with 309
pH values reported to fall within the range of 5.0 to 6.0 pH units, with a mean pH of 5.5 (Mathieu et 310
al., 1989; Martinière et al., 2013). 311
Solved SAC values were constrained to be positive. To prevent erroneous absorption 312
assignments, the wavelength domains were narrowed to 400-750 nm for chlorophylls, 400-560 nm 313
for carotenoids, and 400-660 nm for anthocyanins. These ranges are broader than in vitro due to the 314
detour effect: the lengthening of the optical path-length within the leaf results in substantial 315
flattening of the absorption spectrum in vivo (e.g., Rühle and Wild, 1979; Fukshansky et al., 1993). 316
The calibration followed a two-steps algorithm described in Féret et al. (2008). First, we 317
determined the structure parameter 𝑁𝑗 of each leaf 𝑗 in the calibration datasets on the basis of an
318
iterative optimization: 𝑁𝑗 was estimated based on a multivariate iterative optimization,
319
simultaneously with three absorption coefficients using reflectance and transmittance values 320
measured at three wavelengths corresponding to the minimum absorptance (𝜆1), maximum
321
reflectance (𝜆2), and maximum transmittance (𝜆3) of the leaf. These values are generally located on
322
the NIR plateau. The iterative optimization was performed using the merit function: 323 324 𝑀𝑙𝑒𝑎𝑓𝑁(𝑁𝑗, 𝑘(𝜆1), 𝑘(𝜆2), 𝑘(𝜆3)) = ∑ (𝑅𝑚𝑒𝑎𝑠,𝑗(𝜆𝑙) − 𝑅𝑚𝑜𝑑(𝑁𝑗, 𝑘(𝜆𝑙))) 2 + (𝑇𝑚𝑒𝑎𝑠,𝑗(𝜆𝑙) − 𝑇𝑚𝑜𝑑(𝑁𝑗, 𝑘(𝜆𝑙))) 2 3 𝑙=1 Eq. 3 325
with 𝑅𝑚𝑒𝑎𝑠,𝑗(𝜆𝑙) and 𝑇𝑚𝑒𝑎𝑠,𝑗(𝜆𝑙) the measured reflectance and transmittance of leaf 𝑗 at the
326
wavelength 𝜆𝑙, 𝑅𝑚𝑜𝑑 and 𝑇𝑚𝑜𝑑 the modeled values, and 𝑘(𝜆) the absorption coefficient of a
327
compact layer at the wavelength 𝜆, which is adjusted simultaneously with 𝑁𝑗. In Eq. 3, 𝑘(𝜆) is not
328
decomposed into specific absorption of the different chemical constituents. This step occurs in the 329
NIR where pigments have little if any influence, so 𝑘(𝜆) is primarily affected by water absorption. 330
The SAC to be calibrated were then computed by inverting PROSPECT on the 𝑛 = 164 leaves of the 331
calibration dataset. We minimized the merit function 𝐽 at each wavelength: 332
16 333 𝐽 ({𝐾𝑠𝑝𝑒,𝑖(𝜆)}𝑖=1:𝑛) = ∑ (𝑅𝑚𝑒𝑎𝑠,𝑗(𝜆) − 𝑅𝑚𝑜𝑑,𝑗(𝑁𝑗, 𝑘(𝜆))) 2 𝑛 𝑗=1 + (𝑇𝑚𝑒𝑎𝑠,𝑗(𝜆) − 𝑇𝑚𝑜𝑑,𝑗(𝑁𝑗, 𝑘(𝜆)))2 Eq. 4 334 where 335 336 𝑘(𝜆) = ∑ 𝐾𝑖 𝑠𝑝𝑒,𝑖(𝜆) × 𝐶𝑖,𝑗 𝑁𝑗 Eq. 5 337
𝑘(𝜆) is the absorption coefficient of a compact layer at the wavelength 𝜆, 𝐾𝑠𝑝𝑒,𝑖(𝜆) is the SAC
338
of constituent 𝑖, 𝐶𝑖,𝑗 is the corresponding content for leaf 𝑗, 𝑁𝑗 is the leaf structure parameter of leaf
339
𝑗 , and 𝑛 corresponds to the number of biochemical constituents for which the SACs are 340
simultaneously calibrated. 341
342
3. Validation: datasets and criteria for the comparison of model performances
343
We performed model inversions on the validation dataset with PROSPECT-D, as well as 344
PROSPECT-3 and -5. The performances of the different versions of the model were compared in 345
terms of pigment content estimation and leaf spectra fit. The validation was performed using all leaf 346
samples after exclusion of the calibration samples. 347
PROSPECT was inverted on the validation dataset using an iterative method for optimization. It 348
consists in finding the best combination of leaf chemical and structural parameters that minimizes 349
the merit function: 350
351 352
17 𝑀𝑖𝑛𝑣(𝑁, { 𝐶𝑖}𝑖=1:𝑝) = ∑ (𝑅𝑚𝑒𝑎𝑠,𝜆− 𝑅𝑚𝑜𝑑,𝜆(𝑁, { 𝐶𝑖}𝑖=1:𝑝))2 𝑛𝜆 𝜆=1 + (𝑇𝑚𝑒𝑎𝑠,𝜆− 𝑇𝑚𝑜𝑑,𝜆(𝑁, { 𝐶𝑖}𝑖=1:𝑝)) 2 Eq. 6 353
with 𝑛𝜆 the number of available spectral bands, 𝑁 the leaf structure parameter, 𝐶𝑖 the content of
354
constituent 𝑖, and 𝑝 the number of leaf biochemical constituents. In this study, we simultaneously 355
estimated the six input parameters of PROSPECT: pigments (𝐶𝑎𝑏, 𝐶𝑥𝑐, 𝐶𝑎𝑛𝑡ℎ), equivalent water
356
thickness (𝐸𝑊𝑇), leaf mass per area (𝐿𝑀𝐴) and leaf structure parameter (𝑁). 357
In essence, candidate sets of these parameters are iteratively input in forward mode and the 358
resulting modeled reflectance and/or transmittance spectra compared against the measured ones; 359
the parameter are revised until the minimum value of the merit function is found. When the 360
assumptions of the model are not met, for example if a pigment is not taken into account, or if the 361
SACs are incorrect, the inversion will converge towards a suboptimal solution, inducing errors in the 362
estimation of the parameters. This situation occurs when we try to invert PROSPECT-3 on yellowing 363
leaves; 𝐶𝑎𝑏 is overestimated to compensate for the absorption of 𝐶𝑥𝑐.
364
The root mean square error (RMSE expressed in µg cm2) can be computed to appraise the 365
difference between the measured and estimated pigment content: 366 367 𝑅𝑀𝑆𝐸 = √∑ (𝑋𝑚𝑒𝑎𝑠,𝑗− 𝑋𝑚𝑜𝑑,𝑗) 2 𝑛 𝑗=1 𝑛 Eq. 7 368
where 𝑋𝑚𝑒𝑎𝑠,𝑗 are the measured values and 𝑋𝑚𝑜𝑑,𝑗 are the values estimated by model inversion for
369
leaf 𝑗. As for the quality of the fit, it is appraised by the spectral RMSE which calculates the difference 370
between the measured and simulated reflectance and transmittance spectra on a wavelength-by-371 wavelength basis. 372 373 4. Results 374
18
4.1. Selection of a calibration dataset
375
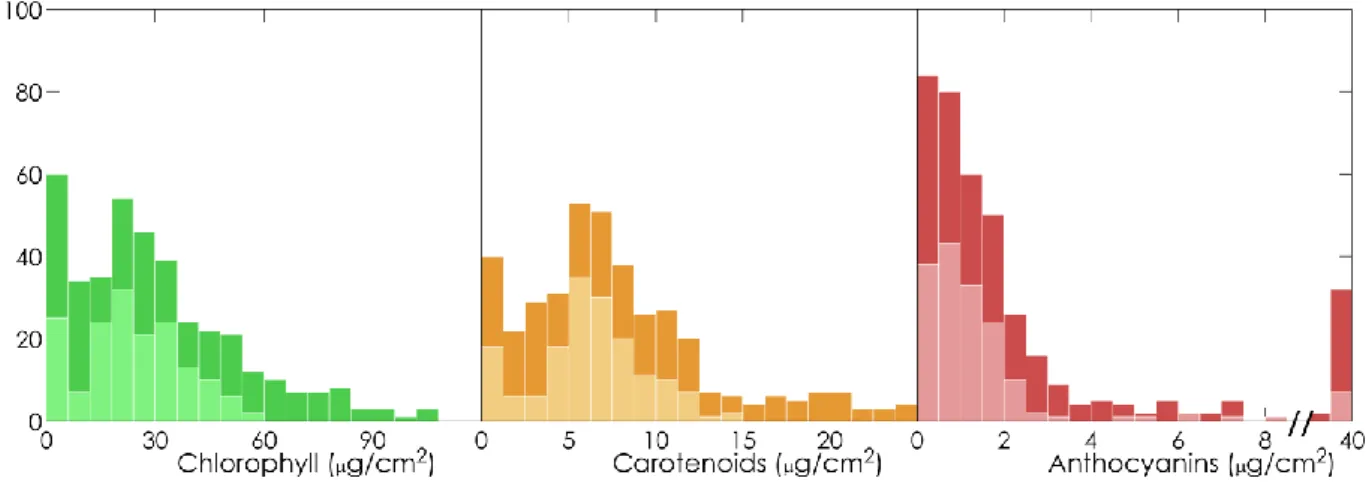
Figure 3 shows the pigment distribution corresponding to the calibration and validation 376
samples in ANGERS and VIRGINIA: note that the calibration samples display low to moderate 𝐶𝑎𝑏 and
377
𝐶𝑥𝑐 values, whereas the validation samples encompasses significantly broader pigment contents. The 378
calibration samples with high 𝐶𝑎𝑛𝑡ℎ come from VIRGINIA, for reasons explained earlier.
379 380
Figure 3. Stacked distribution of pigment content for the calibration and validation samples selected
from ANGERS and VIRGINIA. Light colors: calibration (144 samples from ANGERS, 20 Samples from VIRGINIA); dark colors: validation (164 samples from ANGERS, 61 samples from VIRGINIA). 381
4.2. Selection of the refractive index
382
The refractive index spectra displayed in Figure 2 provide advantages and disadvantages in 383
terms of model accuracy both for the estimation of leaf chemistry and the simulation of leaf optical 384
properties. We performed calibrations of PROSPECT-D as detailed in Section 3, using either the 385
refractive index of PROSPECT-3 and the one derived by Chen and Weng (2012). Then we inverted the 386
two versions of the model on ANGERS, the only dataset covering the SWIR as well as including 387
measurements of 𝐸𝑊𝑇 and 𝐿𝑀𝐴. Overall the performances obtained for pigment retrieval and 388
simulation of leaf optics were similar in the VIS. For water and dry matter, results were also very 389
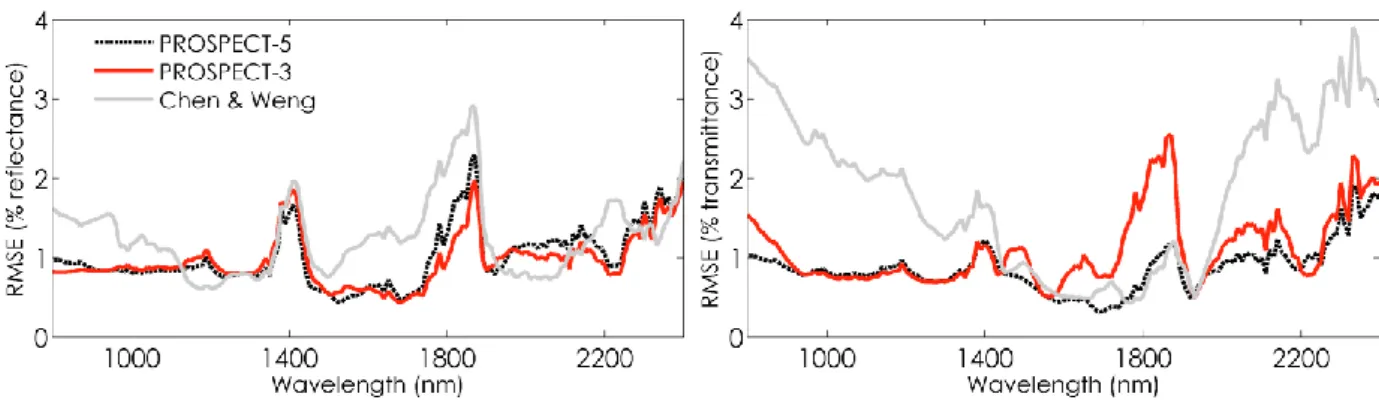
19 similar. Simulated leaf reflectance and transmittance spectra also exhibited very slight differences in 390
the VIS, while they were noticeable in the NIR and SWIR. This is illustrated by Figure 4 that displays 391
the spectral RMSE calculated between measured and simulated leaf spectra for ANGERS. The 392
reflectances are comparable, with slightly higher RMSE obtained with the refractive index derived 393
from Chen and Weng (2012) between 1500 nm and 1900 nm; there are higher discrepancies in the 394
transmittances. Based on these results, we assigned the refractive index used in PROSPECT-3 to 395
PROSPECT-D. 396
397
Figure 4. Spectral RMSE between measured leaf optics and simulated reflectance (left), and
transmittance (right) obtained after model inversion with the refractive index used in PROSPECT-5 (black dotted line), PROSPECT-3 (red), and derived from Chen and Weng (2012) (light grey). 398
4.3. Adjustment of the specific absorption coefficients
399
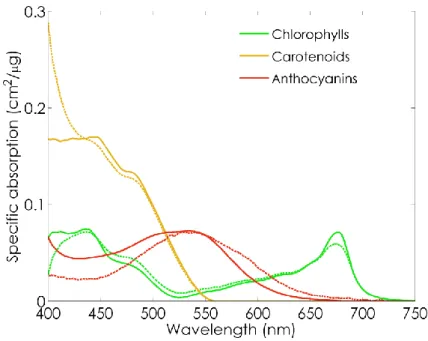
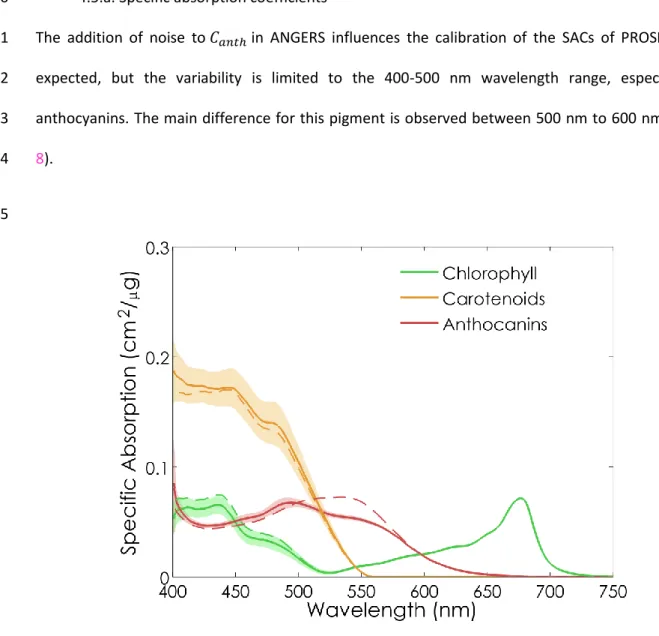
Figure 5 displays the SACs of pigment in PROSPECT-5 and PROSPECT-D. The differences 400
between the two models are minor for chlorophylls and carotenoids beyond 450 nm. However, 401
noticeable differences can be observed for carotenoids between 400 nm and 450 nm: compared to 402
PROSEPCT-D, the SAC of 𝐶𝑥𝑐 sharply increases towards the ultraviolet (UV) domain in PROSPECT-5,
403
possibly due to the presence of flavonoids in the calibration samples. This augmentation is 404
compensated by a slight decrease of the SACs of 𝐶𝑎𝑏 and 𝐶𝑎𝑛𝑡ℎ. The SAC of anthocyanins shows a
405
strong absorption between 450 nm and 650 nm, that peaks at about 550 nm. This result is in 406
20 agreement with the absorption spectra reported in the literature (Dougall and Baker, 2008; Peters 407
and Noble, 2014). The broadness of the absorption peak may be caused by calibration artifacts 408
related to residual correlations between the pigments. 409
410
Figure 5. Specific absorption coefficients of chlorophylls (green), carotenoids (orange), and
anthocyanins (red). The solids line correspond to the SAC of all the pigments in PROSPECT-D, the dashed lines to the SAC of chlorophylls and carotenoids in PROSPECT-5, and to the SAC of
anthocyanins measured by Peters and Noble (2014) using thin layer chromatography. 411
4.4. Validation of model performances
412
4.4.a. Estimation of leaf pigment by PROSPECT inversion 413
𝐶𝑎𝑏, 𝐶𝑥𝑐 and 𝐶𝑎𝑛𝑡ℎ have been estimated by inversion of PROSPECT-D on a dataset hereafter
414
called VALIDATION. It gathered all experimental datasets (Table 1) except DOGWOOD-2 which did 415
not contain transmittance spectra. ANGERS was also excluded for anthocyanins since 𝐶𝑎𝑛𝑡ℎ has been
416
indirectly estimated using a spectral index. 417
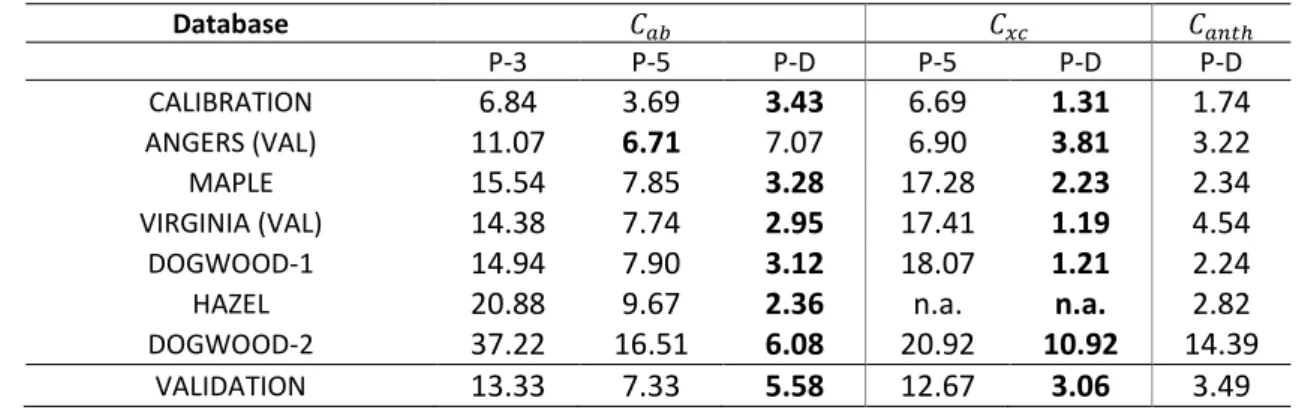
Table 2 compares the performances of PROSPECT-3, -5 and -D for pigment estimation in terms 418
of RMSE. One can note a markedly improvement of 𝐶𝑥𝑐 estimation by PROSPECT-D for all datasets. In
21 ANGERS, which mainly contain green leaves, PROSPECT-5 and PROSPECT-D perform similarly at 420
estimating 𝐶𝑎𝑏, with a slight increase of RMSE obtained with PROSPECT-D. It can be explained by the
421
fact that these samples correspond to calibration samples in PROSPECT-5. PROSPECT-D surpasses the 422
previous versions of the model for all datasets other than ANGERS. Importantly, the new model is 423
able to accurately estimate 𝐶𝑥𝑐 even in anthocyanic leaves, which has been problematic for other
424
techniques. 425
426
Table 2. RMSE (µg cm2) of the estimation of leaf pigment content using PROSPECT-3 (P-3), 427
PROSPECT-5 (P-5), and PROSPECT-D (P-D) inversion. The bold font for numbers indicates the lowest 428 values. 429 Database 𝐶𝑎𝑏 𝐶𝑥𝑐 𝐶𝑎𝑛𝑡ℎ P-3 P-5 P-D P-5 P-D P-D CALIBRATION 6.84 3.69 3.43 6.69 1.31 1.74 ANGERS (VAL) 11.07 6.71 7.07 6.90 3.81 3.22 MAPLE 15.54 7.85 3.28 17.28 2.23 2.34 VIRGINIA (VAL) 14.38 7.74 2.95 17.41 1.19 4.54 DOGWOOD-1 14.94 7.90 3.12 18.07 1.21 2.24 HAZEL 20.88 9.67 2.36 n.a. n.a. 2.82 DOGWOOD-2 37.22 16.51 6.08 20.92 10.92 14.39
VALIDATION 13.33 7.33 5.58 12.67 3.06 3.49 430
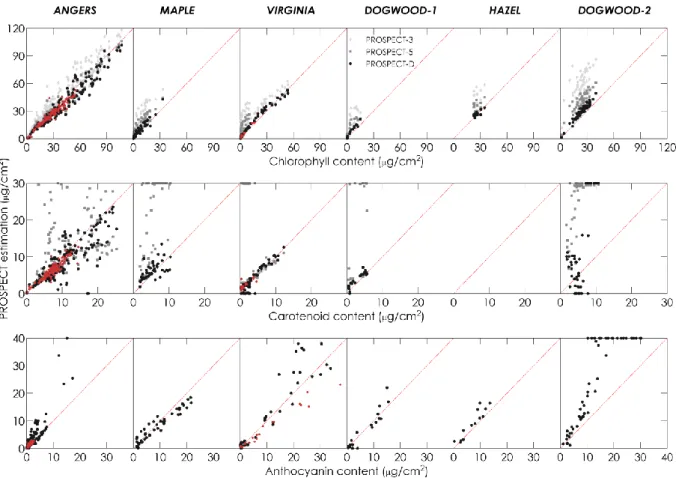
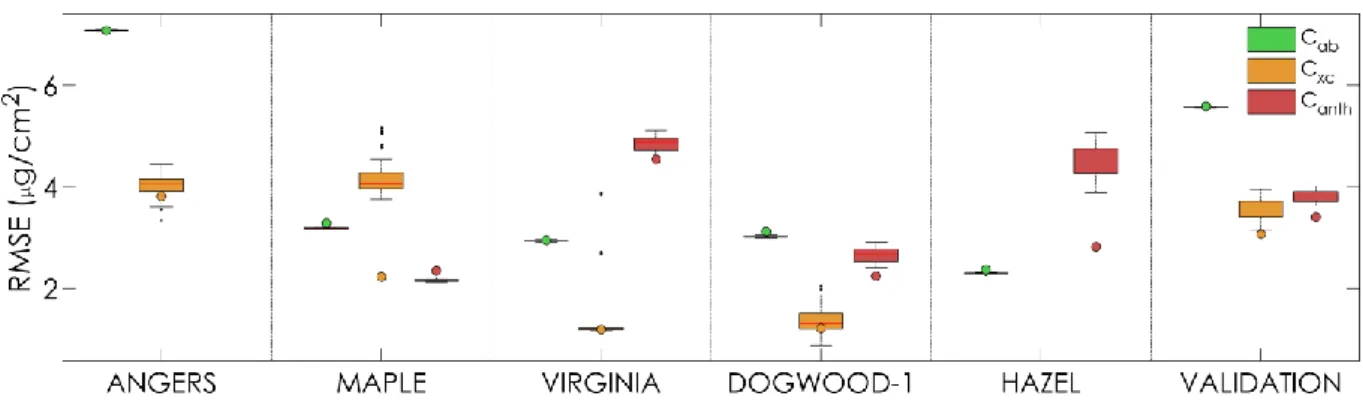
Figure 6 illustrates the differences observed in Tables 2. PROSPECT-3 overestimated 𝐶𝑎𝑏 for all
431
datasets, even with ANGERS which mainly contained green leaves; this overestimation was reduced 432
when using PROSPECT-5 or PROSPECT-D. The substantial improvement in 𝐶𝑥𝑐 estimation when using
433
PROSPECT-D is a significant result of this article: overall, the RMSE was divided by four compared to 434
the results obtained with PROSPECT-5. The inversion of PROSPECT-5 on anthocyanin-rich leaves 435
sometimes converged towards the upper bound on 𝐶𝑥𝑐 (30 µg cm2). It is likely that this
436
overestimation of carotenoid content results from the strong absorption of light by anthocyanins in 437
the same wavelength range as carotenoids, and this absorption is not properly modeled by 438
PROSPECT-5. In ANGERS, the systematic underestimation of 𝐶𝑥𝑐 by PROSPECT-5 in leaves containing
439
high amounts of photosynthetic pigments was greatly reduced by PROSPECT-D. The overestimation 440
22 of 𝐶𝑥𝑐 in anthocyanin-rich leaves was also corrected. The lower performances of PROSPECT-D on
441
DOGWOOD-2 are probably explained by the absence of transmittance spectra. As explained in 442
Section 4.1, the samples selected for the calibration dataset in ANGERS were marked out by low to 443
medium pigment content, therefore they were not representative of the full range of variation found 444
in this dataset: nevertheless, this did not prevent us from estimating high pigment content with 445
accuracy. This is explained by slight changes in the optical properties of leaves with high-pigment 446
content when carotenoids increase, due to saturation effects. It also suggests that the physical 447
description used in PROSPECT is correct, as its ability to estimate pigment content goes beyond the 448
range used for calibration. Samples showing underestimated 𝐶𝑥𝑐 in ANGERS were discarded from the
449
calibration dataset due to unusual optical properties (surface effects) or very high 𝑚𝐴𝑅𝐼. 450
451 452
23 (when relevant). Red dots correspond to calibration samples from ANGERS and VIRGINIA. 453
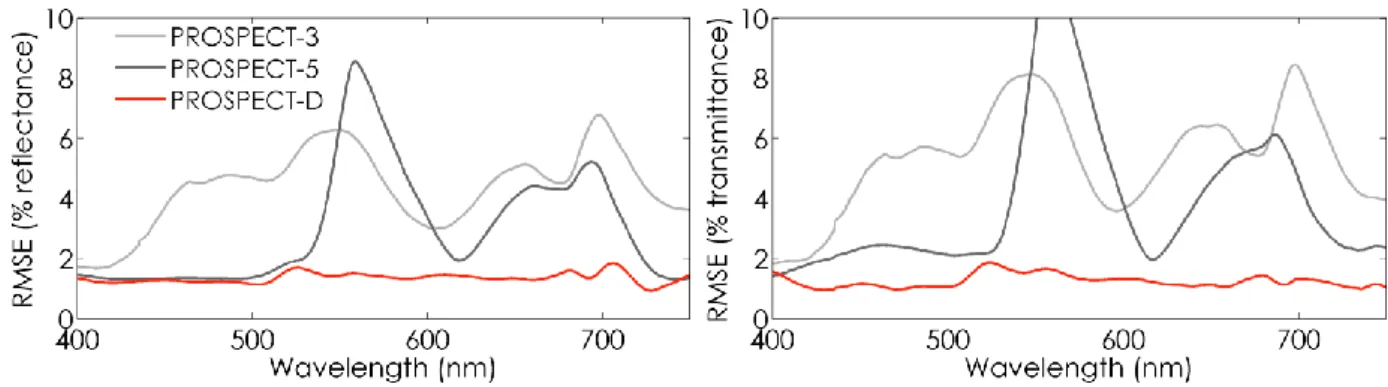
4.4.b. Spectrum reconstruction 454
We compared the spectral RMSE between measured spectra and spectra reconstructed by the 455
last three versions of PROSPECT after model inversion on the VALIDATION dataset (Figure 7). Values 456
obtained with PROSPECT-3 ranged between 2% and 6% over the VIS. This model uses a unique SAC to 457
account for total pigment absorption; therefore it solely applies to healthy green leaves. The 458
dissociation of chlorophylls from carotenoids in PROSPECT-5 explains the strong decrease in RMSE 459
between 400 nm and 500 nm where carotenoids absorb light. However, the discrepancies are still 460
strong between 500 nm and 600 nm where anthocyanins absorb light, and between 650 nm and 750 461
nm, a spectral domain that corresponds to the second absorption peak of chlorophylls. Finally, 462
PROSPECT-D surpassed the previous versions with RMSE ranging between 1% and 2% over the entire 463
VIS. 464
465
Figure 7. Spectral RMSE between measured and estimated leaf reflectance and transmittance
obtained for the VALIDATION dataset after model inversion using PROSPECT-3, PROSPECT-5, and PROSPECT-D.
466 467 468
24
4.5. Sensitivity to the uncertainty associated with 𝐂𝐚𝐧𝐭𝐡 in ANGERS
469
4.5.a. Specific absorption coefficients 470
The addition of noise to 𝐶𝑎𝑛𝑡ℎ in ANGERS influences the calibration of the SACs of PROSPECT, as
471
expected, but the variability is limited to the 400-500 nm wavelength range, especially for 472
anthocyanins. The main difference for this pigment is observed between 500 nm to 600 nm (Figure
473
8). 474 475
Figure 8. Comparison of the SACs obtained for the three pigments when using 𝐶𝑎𝑛𝑡ℎ values directly
derived from 𝑚𝐴𝑅𝐼 (dashed lines) and when using 𝐶𝑎𝑛𝑡ℎ values with noise added corresponding to
the error of prediction of 𝐶𝑎𝑛𝑡ℎ observed for experimental data (50 repetitions; plain lines and their
envelope correspond to mean value ± 1 standard deviation). 476
4.5.b. Estimation of pigment content 477
We estimated pigment content by inverting PROSPECT with the set of SACs derived from noisy 𝐶𝑎𝑛𝑡ℎ.
478
Erreur ! Source du renvoi introuvable. summarizes the distributions of RMSE from measured and 479
25 estimated pigment contents for the validation datasets taken separately and for the VALIDATION 480
dataset that group them together. The uncertainty on 𝐶𝑎𝑛𝑡ℎ has no influence on the estimation of
481
𝐶𝑎𝑏, as the RMSE is close to that obtained when no noise was added to 𝐶𝑎𝑛𝑡ℎ. The influence is higher
482
on the estimation of carotenoids. The version of the model with no noise added to 𝐶𝑎𝑛𝑡ℎ
483
outperformed the versions including noise, particularly for MAPLE. This version also outperformed all 484
noisy versions when focusing on VALIDATION. Finally, the estimation of 𝐶𝑎𝑛𝑡ℎ also performed better
485
when no noise was added to the ANGERS calibration samples, except for MAPLE, which performs a 486
little less now. However as for 𝐶𝑥𝑐, the results obtained with VALIDATION showed better estimation
487
of 𝐶𝑎𝑛𝑡ℎ when no noise was added. These results validate the calibration of PROSPECT-D with 𝐶𝑎𝑛𝑡ℎ
488
determined using a spectral index. Moreover, the slight decrease in performances for the estimation 489
of 𝐶𝑎𝑛𝑡ℎ and 𝐶𝑥𝑐 when adding noise to 𝐶𝑎𝑛𝑡ℎ suggests that the estimated values obtained for 𝐶𝑎𝑛𝑡ℎ
490
in ANGERS may show lower uncertainty than expected based on the experimental data available. 491
492
Figure 9. Distribution of the RMSE between measured and estimated pigment content after adding
noise to the values of 𝐶𝑎𝑛𝑡ℎ of ANGERS used for calibration of PROSPECT and inversion of the model
based on the SACs displayed in Figure 8. Colored dots correspond to the RMSE obtained when no noise is added to 𝐶𝑎𝑛𝑡ℎ in ANGERS.
493
4.5.c. Simulation of leaf optical properties 494
26 The accuracy of reflectance and transmittance reconstruction is displayed in Figure 10. The spectra 495
simulated by PROSPECT-D show very minor differences whatever noise was added to 𝐶𝑎𝑛𝑡ℎ or not.
496
These results confirm that despite missing values and indirect estimation of 𝐶𝑎𝑛𝑡ℎ for ANGERS,
497
PROSPECT-D provides stable results in terms of calibrated SACs as well as model performance both in 498
direct and inverse modes. 499
500
Figure 10. Spectral RMSE between measured and estimated leaf reflectance and transmittance
obtained for the VALIDATION dataset after model inversion using PROSPECT-D calibrated with (grey lines) and without (red lines) uncertainty added to 𝐶𝑎𝑛𝑡ℎ.
501
5. Discussion
502
5.1. Specific absorption coefficients
503
As stated earlier, the SAC of anthocyanins obtained after the calibration phase (Figure 5) 504
displayed a broad absorption peak centered on 550 nm. The overall profile agrees well with the 505
spectra obtained in previous studies (Gitelson et al., 2001; Peters and Noble, 2014). We compared 506
this SAC with absorption spectra of pure cyanidin-3-glucoside (C3G), measured in the lab for 507
different pH (Fossen et al., 1998). C3G is also the most common anthocyanin in leaves (Harborne and 508
Williams, 1998). The SACs derived from a model generally do not match data published in the 509
literature for in vitro dissolved pigments. Several causes may explain such a discrepancy. First, 510
radiative transfer model are imperfect: for instance, a two-layer model taking into account the 511
27 asymmetry of leaf anatomy and chemical content in Dicots may improve the determination of the 512
SACs. Moreover, the calibration of these models is based on experimental data which may be not 513
optimal in terms of sampling, despite our efforts to provide the best experimental datasets. Second, 514
molecules in vivo are linked to their environment, which may induce shifts in their SACs: this is the 515
case for chlorophylls with proteins, or anthocyanins with the pH or temperature (Figueiredo et al., 516
1999; Yabuya et al., 1999; Boulton, 2001). Thirdly, while the model assumes stable compositions and 517
absorption spectra for chlorophylls, carotenoids and anthocyanins, in reality these are families of 518
pigments containing between two and hundreds of molecules, with as many variations in their 519
particular absorption spectra. Subtle changes in anthocyanin composition, chlorophyll a:b ratio, or 520
induced by the xanthophyll cycle may result in variations in leaf reflectance and transmittance that 521
are detectable but not interpretable by PROSPECT. Finally, as explained earlier, internal multiple 522
scattering (detour effect) and distributional errors (sieve effect) may also explain part of the 523
discrepancies observed between in vivo and in vitro SACs. Figure 11shows the profile of the SAC of 524
anthocyanins: it is intermediate between the absorption coefficient measured for C3G at pH 1 and 525
pH 8.1 in the main absorption domain of this constituent. The increasing absorption closer to the UV-526
A may be explained by the presence of flavonols in some leaves: these molecules, which are 527
biosynthetically associated with anthocyanins in plant secondary metabolism, are also optically 528
active in this domain. Therefore, it is likely that flavonols contribute to the anthocyanin SAC spectrum 529
(Solovchenko et al., 2001). The improvement of 𝐶𝑥𝑐 estimation accuracy upon incorporation of
530
anthocyanins into PROSPECT-D may stem from the inherent correlation between anthocyanin and 531
flavonoid content. 532
28
Figure 11. Comparison of the SAC corresponding to anthocyanins derived from PROSPECT-D
calibration (cm2 µg1) and the absorption of pure Cyanidin 3-glucoside at pH 1 and 8.1 (unitless) (after
Fossen et al., 1998). 534
The SAC of carotenoids above 450 nm is very similar in PROSPECT-5 and PROSPECT-D. However 535
the estimation of 𝐶𝑥𝑐 is substantially improved in the latter, which highlights the high sensitivity of
536
PROSPECT to very small changes of the SAC, as well as the importance of incorporating anthocyanins 537
into the model even for leaves with low content. This improvement in the estimation of 𝐶𝑥𝑐 was not
538
explained by the differences observed between 400 nm and 450nm: when using all the ANGERS 539
dataset for calibration, the SAC calibrated for 𝐶𝑥𝑐 showed very similar profile as in PROSPECT-5, but
540
the improvement in the estimation of 𝐶𝑥𝑐 was still observed.
541 542
5.2. Illustration of the improved simulation of leaf optical properties
543
To illustrate the ability of PROSPECT-D to simulate leaf optical properties we selected some 544
samples including senescent and reddish leaves (Figure 12). In some cases, the fit is poor: the 545
reflectance spectrum of Eucalyptus gunnii is very high compared to that of other leaves, probably 546
due to the presence of wax at the leaf surface, a layer that is not accounted for in PROSPECT (Figure
29
12h). Barry and Newnham (2012) already pointed out an incorrect assessment of carotenoid content 548
in Eucapyptus globulus and Eucapyptus nitens leaves. The development of PROSPECT-D partly 549
answers these limitations, but further efforts will be needed to include specular reflection (Bousquet 550
et al., 2005; Comar et al., 2014; Jay et al., 2016). 551
552
Figure 12. Measured (black dotted line) versus simulated (blue line for PROSPECT-5 and red line for
PROSPECT-D) reflectance (lower spectra) and transmittance (upper spectra). (a-b) Acer pseudoplatanus L., (c) Acer platanoides L., (d) Corylus avellana L., (e-f) Parthenocissus quinquefolia
non-30 senescent anthocyanic leaves, while samples (a-c-d-g) show anthocyanic senescent leaves.
553
6. Conclusion
554
We introduced a new, physically-based model called PROSPECT-D which, for the first time, 555
includes the three main families of leaf pigments as independent constituents: chlorophylls, 556
carotenoids, and anthocyanins. PROSPECT-D outperformed the previous versions of the model, both 557
for the estimation of leaf chemical constituents and the simulation of leaf optical properties, on 558
datasets encompassing a broad range of growth conditions and stages. Inversion of PROSPECT-D 559
showed improved estimation of pigment content, especially carotenoid content. These results 560
demonstrate the ability of this new model to simulate optical properties during the lifespan of the 561
leaf and for a new range of conditions, including juvenile and senescent stages, as well as 562
environmental stresses. 563
We studied the influence of the uncertainty corresponding to the values of 𝐶𝑎𝑛𝑡ℎ from
564
ANGERS used for the calibration of PROSPECT-D. Our results showed that this uncertainty has little to 565
no impact on the calibration, and on the performances of the model in terms of pigment prediction 566
accuracy, as well as in modeling of leaf optics. 567
The availability of this model has strong implications for vegetation modeling both at leaf and 568
canopy scales. At the leaf scale, PROSPECT-D will allow to perform sensitivity analyses focused on 569
anthocyanins, and to design new vegetation indices dedicated to specific pigments and less sensitive 570
to other ones. The linkage of PROSPECT-D with canopy reflectance models such as SAIL (e.g., 571
Jacquemoud et al., 2009) or DART (Hernández-Clemente et al., 2012; Gastellu-Etchegorry et al., 572
2015) will allow simulations of vegetation types that could not be reproduced before. Applications 573
for stress and senescence detection will directly take advantage of such improvements. Finally 574
PROSPECT-D is a powerful tool for determining the potential of operational multispectral satellites 575
(Sentinel-2, LandSat-8, WorldView-3) and future hyperspectral missions (EnMAP, Hyspiri, HYPXIM) 576
for fine detection of leaf pigments. 577
31 578
Acknowledgments
579
The authors warmly thank Luc Bidel, Christophe François and Gabriel Pavan who collected the 580
ANGERS dataset. We also thank Zoran Cerovic (Laboratoire Ecologie-Systématique-Evolution) for the 581
fruitful discussions about leaf pigments. We thank Alexei Solovchenko for his careful review and 582
valuable comments during the preparation of this manuscript. We thank the two anonymous 583
reviewers for their constructive comments and suggestions. Jean-Baptiste Féret was funded by the 584
HyperTropik project (TOSCA program grant of the French Space Agency, CNES), and by Hypos project 585
(European Space Agency, ESA). Jean-Baptiste Féret and Stéphane Jacquemoud were funded by the 586
CHLORµS project (TOSCA program grant of the French Space Agency, CNES). Anatoly Gitelson was 587
supported by Marie Curie International Incoming Visiting Professor Fellowship. Scott Noble was 588
supported by the Natural Sciences and Engineering Research Council (NSERC) Discovery Grant 589
program and University of Saskatchewan sabbatical travel fund. 590
591
References
592
Allen, W.A., Gausman, H.W., Richardson, A.J., 1970. Mean effective optical constants of cotton 593
leaves. J. Opt. Soc. Am. 60, 542–547. doi:10.1364/JOSA.60.000542 594
Allen, W.A., Gausman, H.W., Richardson, A.J., Thomas, J.R., 1969. Interaction of isotropic light with a 595
compact plant leaf. J. Opt. Soc. Am. 59, 1376–1379. doi:10.1364/JOSA.59.001376 596
Asner, G.P., Anderson, C.B., Martin, R.E., Tupayachi, R., Knapp, D.E., Sinca, F., 2015a. Landscape 597
biogeochemistry reflected in shifting distributions of chemical traits in the Amazon forest 598
canopy. Nat. Geosci. 8, 567–573. doi:10.1038/ngeo2443 599
Asner, G.P., Martin, R.E., 2009. Airborne spectranomics: Mapping canopy chemical and taxonomic 600
diversity in tropical forests. Front. Ecol. Environ. 7, 269–276. doi:10.1890/070152 601
Asner, G.P., Martin, R.E., Anderson, C.B., Knapp, D.E., 2015b. Quantifying forest canopy traits: 602
Imaging spectroscopy versus field survey. Remote Sens. Environ. 158, 15–27. 603
doi:10.1016/j.rse.2014.11.011 604
Atzberger, C., Guérif, M., Baret, F., Werner, W., 2010. Comparative analysis of three chemometric 605
techniques for the spectroradiometric assessment of canopy chlorophyll content in winter 606
wheat. Comput. Electron. Agric. 73, 165–173. doi:10.1016/j.compag.2010.05.006 607
Barry, K., Newnham, G., 2012. Quantification of chlorophyll and carotenoid pigments in eucalyptus 608
foliage with the radiative transfer model PROSPECT 5 is affected by anthocyanin and 609
epicuticular waxes., in: Proc. Geospatial Science Research 2 Symposium, GSR 2012, 610
Melbourne, Australia, December 10-12, 2012. 611
Blackburn, G.A., 2007. Hyperspectral remote sensing of plant pigments. J. Exp. Bot. 58, 855–867. 612
doi:10.1093/jxb/erl123 613
32 Boulton, R., 2001. The copigmentation of anthocyanins and its role in the color of red wine: A critical 614
review. Am. J. Enol. Vitic. 52, 67–87. 615
Bousquet, L., Lachérade, S., Jacquemoud, S., Moya, I., 2005. Leaf BRDF measurements and model for 616
specular and diffuse components differentiation. Remote Sens. Environ. 98, 201–211. 617
doi:10.1016/j.rse.2005.07.005 618
Britton, G., Liaaen-Jensen, S., Pfander, H. (Eds.), 2004. Carotenoids. Birkhäuser Basel, Basel. 619
Brockington, S.F., Walker, R.H., Glover, B.J., Soltis, P.S., Soltis, D.E., 2011. Complex pigment evolution 620
in the Caryophyllales: Research review. New Phytol. 190, 854–864. doi:10.1111/j.1469-621
8137.2011.03687.x 622
Chappelle, E.W., Kim, M.S., McMurtrey, J.E., 1992. Ratio analysis of reflectance spectra (RARS): An 623
algorithm for the remote estimation of the concentrations of chlorophyll A, chlorophyll B, 624
and carotenoids in soybean leaves. Remote Sens. Environ. 39, 239–247. doi:10.1016/0034-625
4257(92)90089-3 626
Chen, M., Weng, F., 2012. Kramers-Kronig analysis of leaf refractive index with the PROSPECT leaf 627
optical property model: K-K analysis of leaf refractive index. J. Geophys. Res. Atmospheres 628
117, D18106n. doi:10.1029/2012JD017477 629
Comar, A., Baret, F., Obein, G., Simonot, L., Meneveaux, D., Viénot, F., de Solan, B., 2014. ACT: A leaf 630
BRDF model taking into account the azimuthal anisotropy of monocotyledonous leaf surface. 631
Remote Sens. Environ. 143, 112–121. doi:10.1016/j.rse.2013.12.006 632
Davies, K., 2004. Plant pigments and their manipulation. Blackwell ; CRC, Oxford; Boca Raton. 633
Di Vittorio, A.V., 2009. Enhancing a leaf radiative transfer model to estimate concentrations and in 634
vivo specific absorption coefficients of total carotenoids and chlorophylls a and b from single-635
needle reflectance and transmittance. Remote Sens. Environ. 113, 1948–1966. 636
doi:10.1016/j.rse.2009.05.002 637
Dougall, D.K., Baker, D.C., 2008. Effects of reaction mixture and other components on the 638
determination of the equilibrium and rate constants of the hydration reactions of 639
anthocyanins. Food Chem. 107, 473–482. doi:10.1016/j.foodchem.2007.07.035 640
Féret, J.-B., François, C., Asner, G.P., Gitelson, A.A., Martin, R.E., Bidel, L.P.R., Ustin, S.L., le Maire, G., 641
Jacquemoud, S., 2008. PROSPECT-4 and 5: Advances in the leaf optical properties model 642
separating photosynthetic pigments. Remote Sens. Environ. 112, 3030–3043. 643
doi:10.1016/j.rse.2008.02.012 644
Féret, J.-B., François, C., Gitelson, A., Asner, G.P., Barry, K.M., Panigada, C., Richardson, A.D., 645
Jacquemoud, S., 2011. Optimizing spectral indices and chemometric analysis of leaf chemical 646
properties using radiative transfer modeling. Remote Sens. Environ. 115, 2742–2750. 647
doi:10.1016/j.rse.2011.06.016 648
Figueiredo, P., George, F., Tatsuzawa, F., Toki, K., Saito, N., Brouillard, R., 1999. New features of 649
intramolecular copigmentation byacylated anthocyanins. Phytochemistry 51, 125–132. 650
doi:10.1016/S0031-9422(98)00685-2 651
Filella, I., Porcar-Castell, A., Munné-Bosch, S., Bäck, J., Garbulsky, M.F., Peñuelas, J., 2009. PRI 652
assessment of long-term changes in carotenoids/chlorophyll ratio and short-term changes in 653
de-epoxidation state of the xanthophyll cycle. Int. J. Remote Sens. 30, 4443–4455. 654
doi:10.1080/01431160802575661 655
Fossen, T., Cabrita, L., Andersen, O.M., 1998. Colour and stability of pure anthocyanins influenced by 656
pH including the alkaline region. Food Chem. 63, 435–440. doi:10.1016/S0308-657
8146(98)00065-X 658
Fukshansky, L., Remisowsky, A.M.V., McClendon, J., Ritterbusch, A., Richter, T., Mohr, H., 1993. 659
Absorption spectra of leaves corrected for scattering and distributional error: a radiative 660
transfer and absorption statistics treatment. Photochem. Photobiol. 57, 538–555. 661
doi:10.1111/j.1751-1097.1993.tb02332.x 662
Gamon, J.A., Field, C.B., Bilger, W., Björkman, O., Fredeen, A.L., Peñuelas, J., 1990. Remote sensing of 663
the xanthophyll cycle and chlorophyll fluorescence in sunflower leaves and canopies. 664
Oecologia 85, 1–7. doi:10.1007/BF00317336 665