1Agroécologie, AgroSup Dijon, INRA, Université Bourgogne Franche-Comté Bourgogne, Université Bourgogne Franche-Comté, Dijon, France. 2Génomique Métabolique, Genoscope, Institut François Jacob, CEA, CNRS, Université Evry, Université Paris-Saclay, Evry, France. 3Institute of Experimental Botany, Centre of the Region Haná for Biotechnological and Agricultural Research, Olomouc, Czech Republic. 4Biology Centre, Czech Academy of Sciences, České Budějovice, Czech Republic. 5Genoscope, Institut François Jacob, CEA, Université Paris-Saclay, Evry, France. 6School of Biological Sciences and Institute of Agriculture, University of Western Australia, Perth, Western Australia, Australia. 7Crop Development Centre/Department of Plant Sciences, University of Saskatchewan, Saskatoon, Saskatchewan, Canada. 8Centre for Crop and Disease Management, Curtin University, Bentley, Western Australia, Australia. 9Department of Horticulture, Washington State University, Pullman, WA, USA. 10Etude du Polymorphisme des Génomes Végétaux, INRA, Université Paris-Saclay, Evry, France. 11UMR 1095 Génétique, Diversité, Ecophysiologie des Céréales, INRA, Université Clermont Auvergne, Clermont-Ferrand, France. 12Centre for Crop and Disease Management, School of Molecular and Life Science, Curtin University, Bentley, Western Australia, Australia. 13URGI, INRA, Université Paris-Saclay, Versailles, France. 14GQE–Le Moulon, INRA, University of Paris-Sud, CNRS, AgroParisTech, Université Paris-Saclay, Gif-sur-Yvette, France. 15USDA Agricultural Research Service, Pullman, WA, USA. 16Institute of Plant Sciences Paris-Saclay, INRA, CNRS, University of Paris-Sud, University of Evry, University Paris-Diderot, Sorbonne Paris-Cite, University of Paris-Saclay, Orsay, France. 17School of Biological Sciences, University of Auckland, Auckland, New Zealand. 18School of Agriculture and Environment, University of Western Australia, Perth, Western Australia, Australia. 19Present address: Department of Plant Breeding, IFZ Research Centre for Biosystems, Land Use and Nutrition, Justus Liebig University, Giessen, Germany. 20These authors contributed equally: Jonathan Kreplak, Mohammed-Amin Madoui. *e-mail: [email protected]
P
ea (Pisum sativum L., 2n = 14) is the second most
impor-tant grain legume in the world after common bean and is an
important green vegetable with 14.3 t of dry pea and 19.9 t
of green pea produced in 2016 (
http://www.fao.org/faostat/
). Pea
belongs to the Leguminosae (or Fabaceae), which includes cool
sea-son grain legumes from the Galegoid clade, such as pea, lentil (Lens
culinaris Medik.), chickpea (Cicer arietinum L.), faba bean (Vicia
faba L.) and tropical grain legumes from the Milletoid clade, such
as common bean (Phaseolus vulgaris L.), cowpea (Vigna unguicu
-lata (L.) Walp.) and mungbean (Vigna radiata (L.) R. Wilczek). It
provides significant ecosystem services: it is a valuable source of
dietary proteins, mineral nutrients, complex starch and fibers with
demonstrated health benefits
1–4and its symbiosis with N-fixing soil
bacteria reduces the need for applied N fertilizers so mitigating
greenhouse gas emissions
5–7. Pea was domesticated ~10,000 years
ago by Neolithic farmers of the Fertile Crescent, along with cereals
and other grain legumes
8. The large reservoir of genetic diversity
in Pisum has facilitated its spread throughout Asia, Europe, Africa,
the Americas and Oceania where it has adapted to diverse
environ-ments and culinary practices (
https://iyp2016.org/
). Due to its large
genome size (1 C ~ 4.45 gigabases, Gb
9), pea genomics has lagged
behind that of legumes with smaller genomes, such as Medicago
truncatula Gaertn.
10, Lotus japonicus L.
11or soybean (Glycine max
(L.) Merr)
12. Yet, pea has been studied as a genetic model since the
eighteenth century; the analysis of the inheritance of different pea
morphotypes led Gregor Mendel to uncover the laws of genetics
13.
Several pea developmental mutations have since been characterized
14and chromosomal regions controlling agronomic traits identified
15,
but tools exploiting pea diversity for plant breeding, identifying
favorable alleles underlying phenotypic variations and accelerating
A reference genome for pea provides insight into
legume genome evolution
Jonathan Kreplak
1,20, Mohammed-Amin Madoui
2,20, Petr Cápal
3,
Petr Novák
4, Karine Labadie
5, Grégoire Aubert
1, Philipp E. Bayer
6, Krishna K. Gali
7,
Robert A. Syme
8, Dorrie Main
9, Anthony Klein
1, Aurélie Bérard
10, Iva Vrbová
4, Cyril Fournier
1,
Leo d’Agata
5, Caroline Belser
5, Wahiba Berrabah
5, Helena Toegelová
3, Zbyněk Milec
3,
Jan Vrána
3, HueyTyng Lee
6,19, Ayité Kougbeadjo
1, Morgane Térézol
1, Cécile Huneau
11,
Chala J. Turo
12, Nacer Mohellibi
13, Pavel Neumann
4, Matthieu Falque
14, Karine Gallardo
1,
Rebecca McGee
15, Bunyamin Tar’an
7, Abdelhafid Bendahmane
16, Jean-Marc Aury
5,
Jacqueline Batley
6, Marie-Christine Le Paslier
10, Noel Ellis
17, Thomas D. Warkentin
7,
Clarice J. Coyne
15, Jérome Salse
11, David Edwards
6, Judith Lichtenzveig
18, Jiří Macas
4,
Jaroslav Doležel
3, Patrick Wincker
2and Judith Burstin
1*
We report the first annotated chromosome-level reference genome assembly for pea, Gregor Mendel’s original genetic model.
Phylogenetics and paleogenomics show genomic rearrangements across legumes and suggest a major role for repetitive
ele-ments in pea genome evolution. Compared to other sequenced Leguminosae genomes, the pea genome shows intense gene
dynamics, most likely associated with genome size expansion when the Fabeae diverged from its sister tribes. During Pisum
evolution, translocation and transposition differentially occurred across lineages. This reference sequence will accelerate our
understanding of the molecular basis of agronomically important traits and support crop improvement.
trait improvement by marker-assisted selection have been limited.
The pea genome is large, probably resulting from a recent expansion
and diversification of retrotransposons
16. Early reassociation kinetic
studies of the pea genome indicated that 75–97% is made up of a
heterogeneous population of repetitive sequences
17,18. More recent
investigations confirmed the occurrence of highly diverse families
of high to moderately repeated sequences comprising about 76%
of pea nuclear DNA
19. When the repetitive DNA sequences of pea,
soybean and M. truncatula are compared, little sequence similarity
is found between pea and soybean
19. Repetitive sequences between
pea and M. truncatula were more similar but differed in abundance.
The pea karyotype includes two sub-metacentric (1 and 2) and five
acrocentric (3, 4, 5, 6 and 7) chromosomes
16. Several major
rear-rangements, including translocations between nonhomologous
chromosomes, have been reported
20–22.
Technological innovation now enables the sequencing and
assembly of large genomes, bridging the gap between models and
crops for quantitative trait analysis and genome-wide breeding
approaches. Accordingly, an international consortium was formed
to produce a reference genome sequence for pea. Here we report the
draft assembly of the seven chromosomes of the inbred pea cultivar
‘Caméor’, released by the French breeding company Seminor in 1973
and characterized by its protein-rich seeds. This fully annotated
assembly builds on genomic resources developed for Caméor over
the last decade (Supplementary Fig. 1) and will enable
genomic-assisted crop improvement. It provides insights into legume genome
evolution, with resequencing data for 42 wild, landrace and cultivar
Pisum genotypes, revealing genomic events that have shaped the
evolution of this large and diverse genus.
Results
Genome sequencing and assembly. Complementary approaches
were combined to obtain the pea reference genome assembly
(Supplementary Fig. 2). Whole-genome Illumina short-read
sequences (281× genome coverage; Supplementary Table 1) were
assembled into contigs using SoapdeNovo2, then combined into
scaffolds using long-range PacBio RSII sequences (13× genome
coverage; Supplementary Table 1) and whole-genome profiling
of a bacterial articial chromosome (BAC) library
23. Scaffolds were
manually curated for inter and intrachromosomal chimeras using
(1) sequences obtained from single chromosomes isolated by
flow-cytometry
24(Supplementary Fig. 3) and (2) an ultra-high-density
skim genotyping-by-sequencing genetic map (Supplementary
Dataset 1). Curated scaffolds were then integrated into 24,623
super-scaffolds (L50 of 415 kilobases (kb), Supplementary Table 2)
using BioNano maps (Supplementary Table 3 and Supplementary
Table 4). The seven pseudomolecules representing the pea
chro-mosomes were obtained by anchoring super-scaffolds onto
high-density genetic maps (Supplementary Dataset 2). Pseudomolecules
were named according to the reference pea genetic map
25and
chro-mosome numbering
24(Supplementary Table 5).
The pea genome v.1a assembly spans 3.92 Gb (Table
1
)
represent-ing ~88% of the estimated pea genome size (~4.45 Gb), with 82.5%
(3.23 Gb) of sequences assigned to the seven pseudomolecules and
14,266 unassigned scaffolds representing 685 Mb. The estimated
size gap between the genome and assembly was mostly due to
highly repeated sequences collapsed in the assembly, reflected by
repeat proportions in unassembled reads compared to the
assem-bly (Supplementary Fig. 4 and Supplementary Table 6). The most
under-represented repeats were tandemly arranged satellite repeats
and ribosomal RNA genes whose arrays were highly reduced or
absent from the assembly, accounting for about 15% of the
miss-ing sequence and probably more at the centromeres and telomeres.
No group of dispersed repeats was missing from the assembly,
but under-representation of high copy number mobile elements
accounted for most (~75%) of the difference between assembly
length and estimated genome size. Recent long read sequencing
technologies should in the future allow access to collapsed repeats
and missing sequences.
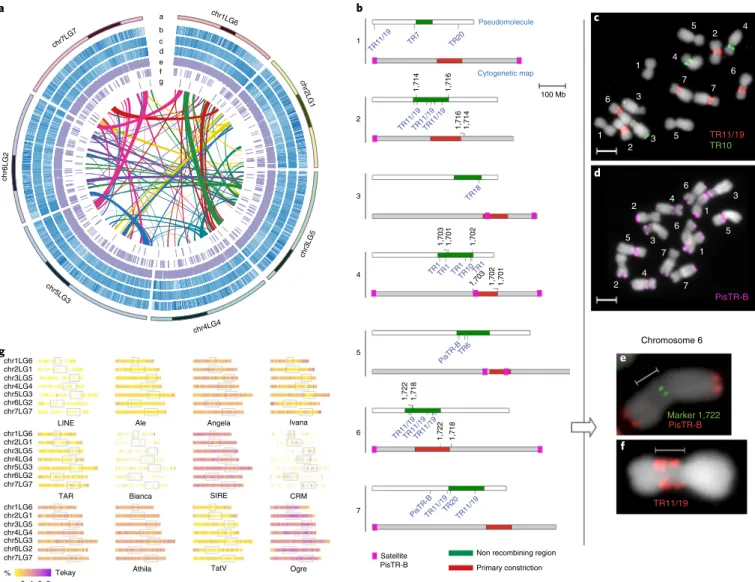
Centromere positions were indicated by regions of suppressed
meiotic recombination revealed by comparing marker positions
in the skim-GBS genetic map with the pseudomolecules (Fig.
1a
and Supplementary Fig. 5). These were confirmed using selected
sequences for FISH (Fig.
1b–f
). Pea chromosomes are
metapolycen-tric, characterized by extended primary constrictions containing
multiple domains of centromeric histone cenH3
26. The coordinates
of nonrecombining regions of the pseudomolecules agreed well
with centromere positions obtained from cytogenetic
measure-ments of the pea karyotype (Fig.
1b
and Supplementary Notes).
Outside centromeres, recombination rate appeared constant along
chromosomes and marker order on pseudomolecules was highly
(Spearman r > 0.95) collinear with high-density linkage maps of
five recombinant inbred line (RIL) populations from intra-specific
crosses
25(Supplementary Dataset 2).
Repeat annotation and gene prediction. Annotation
(Supplementary Fig. 6) identified 2,225,175 repetitive elements
clustered into 2,940 consensus sequences representing ~83% of
the genome (Table
1
and Fig.
1a
). Most of these corresponded
to transposable elements (TE) that were further
sub-classi-fied (Supplementary Table 7). Retrotransposons (Class I), with
1,945,520 copies, were the most abundant. Long-terminal repeat
(LTR) retrotransposons (1,707,747 copies) represented 72.7% of the
genome, with Ty3-gypsy Ogre elements being their major lineage
Table 1 | Characteristics of the pea genome assembly v.1a
ValuesLength of genome assembly (bp) 3,920,161,095 Total length of scaffoldsa (bp) 3,919,096,294
Number of scaffolds 24,623
N50 of scaffolds (bp) 415,940
Number of anchored scaffolds 10,357
Total length of contigs (bp) 3,159,358,344
Number of contigs 218,010
N50 of contigs (bp) 37,931
GC content (%) 37.6
Total length of pseudomolecules (bp) 3,234,741,624 Total length of unanchored scaffolds (bp) 685,419,471
Number of unanchored scaffolds 14,266
Total length of retrotransposons (Class I, bp) 2,457,319,695 Total length of transposons (Class II, bp) 171,953,356 Total length of genes (bp) 124,595,921
Number of genes 44,756
Average gene length (bp) 2784
Number of mRNA 57,835
Number of exons 193,976
Average exon length (bp) 308.5
Average exon number 4.33
Average 3′ UTR length (bp) 443.3
Average 5′ UTR length (bp) 261.9
Number of annotated genes 30,687
(Supplementary Table 7). The 246,432 transposons (Class II)
rep-resented 5.4% of the genome, 84% of which were terminal-inverted
repeat (TIR) transposons (Supplementary Table 7). TE family
dis-tribution varied across the genome (Fig.
1g
). For example, the
abun-dant Ogre family was distributed throughout all chromosomes with
a lower density near telomeres. In contrast, Ty1-copia Ivana and
gypsy TatV were preferentially found near telomeres and
Ty3-gypsy chromovirus CRM were mainly located around centromeres.
Ab initio and homology-based methods were combined to
anno-tate protein-coding sequences (Supplementary Notes). In total,
44,756 complete and 29 truncated genes were predicted (Table
1
and Supplementary Table 8), with an average gene length, coding
sequence length and exon number of 2,784 base pairs (bp), 1,016 bp
and 6.33 exons, respectively. The vast majority of gene models were
supported by complementary DNA/expressed sequence tag evidence.
The completeness of the gene repertoire was assessed using
BUSCO v.3.0.2 (see methods). From a core set of 1,440 single-copy
ortholog genes from the Embryophyta lineage, 92.3% were complete
in the assembly (67.4% as single-copy, 24.9% as duplicates), 2.7% were
fragmented and 5.0% were not found, suggesting that the assembly
includes most of the pea gene space. We identified 7,191 long
non-coding RNAs, 824 transfer RNAs (tRNAs) and 71 microRNAs
(miR-NAs) expressed in developing seeds (Fig.
1a
, Supplementary Notes).
Fourteen of these miRNA and their 67 putative targets were
identi-fied for the first time (Supplementary Dataset 3).
Legume genome size evolution. Genome size varies significantly
among land plants
27. The pea genome (~4.45 Gb (ref.
9)) is within the
upper range for the superrosid eudicots
27. Among 695 Leguminosae
species, only 104 have a larger genome size than P. sativum
28. All but
chr1LG6 chr2LG1 chr3LG5 chr4LG4 chr5LG3 chr6LG2 chr7LG7 chr1LG6 chr2LG1 chr3LG5 chr4LG4 chr5LG3 chr6LG2 chr7LG7 chr1LG6 chr2LG1 chr3LG5 chr4LG4 chr5LG3
Non recombining region TR11/1 9 TR11/1 9 TR11/1 9 TR11/1 9 TR11/19 TR11/1 9 TR7 TR20 TR11/1 9 TR11/1 9 TR11/1 9 PisTR-B PisTR-B TR20 TR6 TR1TR1 TR1 TR1 TR10 TR18 Primary constriction 1,722 5 6 7 4 3 2 1 1,722 1,718 1,718 1,701 1,702 1,702 1,714 100 Mb Cytogenetic map Pseudomolecule 1,714 1,716 1,716 1,701 1,703 1,703 chr6LG2 chr7LG7 chr1LG6 chr2LG1 chr3LG5 chr4LG4 chr5LG3 chr6LG2 chr7LG7 % 2 a g b c a b c d e f g 4
Tekay Athila TatV Ogre
TR11/19 PisTR-B PisTR-B TR11/19 TR10 Marker 1,722 Chromosome 6 SIRE Bianca Angela Ale LINE TAR Ivana CRM Satellite PisTR-B 8 d e f 6 4 1 3 5 5 4 2 2 2 3 5 3 6 1 7 7 6 4 5 2 4 1 3 6 1 7 7 6
Fig. 1 | Pea genome features. a, Circos view of the pea genome. Pseudomolecule color-code is shaded at estimated centromere positions. Lanes depict circular representation of pseudomolecules (a) and the density of retrotransposons, transposons, genes, ncRNA, tRNA and miRNA coding sequences (b–g). Lines in the inner circle represent links between synteny-selected paralogs. b, Estimated positions of centromeres in the assembly and their comparison to pea cytogenetic map is schematically represented, with pseudomolecules as white bars and cytogenetic maps of pea chromosomes as gray bars. Non-recombining regions representing the centromeres are marked in green. Positions of centromeric single-copy FISH markers are indicated above the pseudomolecules in black and positions of arrays of centromeric satellites present in the assembly are shown below them in blue. Positions of primary constrictions on the cytogenetic maps are labeled in red. PisTR-B satellite loci used to discriminate individual chromosomes are shown in purple boxes on the gray bars. c, FISH localization of the satellite repeats TR11/19 (red) and TR10 (green) on metaphase chromosomes (gray). d, Discrimination of chromosomes within the pea karyotype using FISH with PisTR-B probe (purple). e, Example of FISH detection of the single-copy marker (1722, green) in the centromere of chromosome 6. f, Chromosome 6 with labeled centromeric repeat TR11/19. g, The density of different TE lineages inferred from the detection of their protein-coding domains along pseudomolecules.
three of these belong to the Fabeae tribe, which includes the
gen-era Lathyrus, Vicia, Pisum and Lens. The Fabeae thus display
dis-tinctively large genomes compared to the closely related Trifolieae
(genome size ~1.05 Gb) and Cicereae (genome size ~1.27 Gb
(ref.
28)). The pea genome assembly was thus a good opportunity to
study the drivers of genome expansion in the Fabeae.
Genome expansion in plants is primarily driven by
poly-ploidization (whole-genome duplication events) and the
prolif-eration of TEs. A comparison with 21 eudicot species, especially
Leguminosae (Supplementary Dataset 4 and Fig.
2a,b
), showed that
pea has an intermediate number of gene-coding sequences (44,791;
Supplementary Dataset 4), ranking fifth after Cajanus cajan (L.)
Millsp., M. truncatula, Lupinus angustifolius L. and G. max (Fig.
2a
),
the latter two exhibiting recent paleo-polyplodization
12,29(Fig.
2b
).
Notably, the pea genome contains the largest percentage of singletons
(54%) as compared to other legumes (Supplementary Dataset 5),
which could explain why pea was such a successful plant model
in early genetics when large collections of mutants were described
for contrasting phenotypes
30. Paralogs and orthologs were
identi-fied using Orthofinder (Supplementary Notes). The distribution of
synonymous substitutions per synonymous site (Ks) for pea
para-log pairs shows no evidence of a recent whole-genome duplication
but reflects the ancestral Papilionoideae whole-genome duplication
event (PWGD), estimated to have occurred ~55 million years ago
(Ma)
10,31and the whole-genome triplication event common to the
core eudicots
32. The pea genome shows the highest whole-genome
mutation rate among the Leguminosae, as demonstrated by a shift
in the pea PWGD-peak (mode at Ks
= 1) compared to other species
(for example, M. truncatula at Ks
= 0.83 and G. max at Ks = 0.61;
Supplementary Fig. 7 and Supplementary Table 9), consistent with
pea having the highest percentage of genus specific genes (33%;
Supplementary Dataset 5). We classified paralog pairs according
to their presence or absence among taxonomic lineages (Fig.
2c
,
Supplementary Dataset 5 and Supplementary Fig. 8). About 75% of
pea paralogs, specific to Pisum or to the Trifolieae/Fabae clade, show
Ks
< 0.4, while most specific to inverted-repeat-lacking clade (IRLC)
have Ks just below ~0.4 and for the Leguminosae lineages Ks
> 0.4
(Supplementary Fig. 8). In sharp contrast, for M. truncatula paralogs,
the Ks distribution is higher than in pea, except for those specific
to the Leguminosae lineage where Ks is close to the PWGD-peak
(Supplementary Fig. 8). We used synteny as an additional criterion
to select a subset of paralog pairs in pea and M. truncatula (Fig.
2d
).
Many of these pea paralogs appeared to be in tandem and have
lower Ks (~0.2) than in M. truncatula (Ks ~ 0.5). Gene number, high
whole-genome mutation rate, high proportions of recent paralogs
and Pisum-specific genes are all indicative of more frequent gene
gain or loss in pea, most likely associated with genome size
expan-sion about 24.7 and 17.5 Ma, coincident with the divergence of the
Fabeae from its sister tribes
33. The appearance of these paralogs at
that time is intriguing and could be related to genome
reorganiza-tion associated with TE expansion and/or removal
34.
The massive increase of Ty3-gypsy, and to a lesser extent
Ty1-copia, LTR-retrotransposons accounts for most of the genome size
differences between pea and M. truncatula, Trifolium pratense L.,
L. japonicus, P. vulgaris or G. max
10,11,35(Supplementary Table 10).
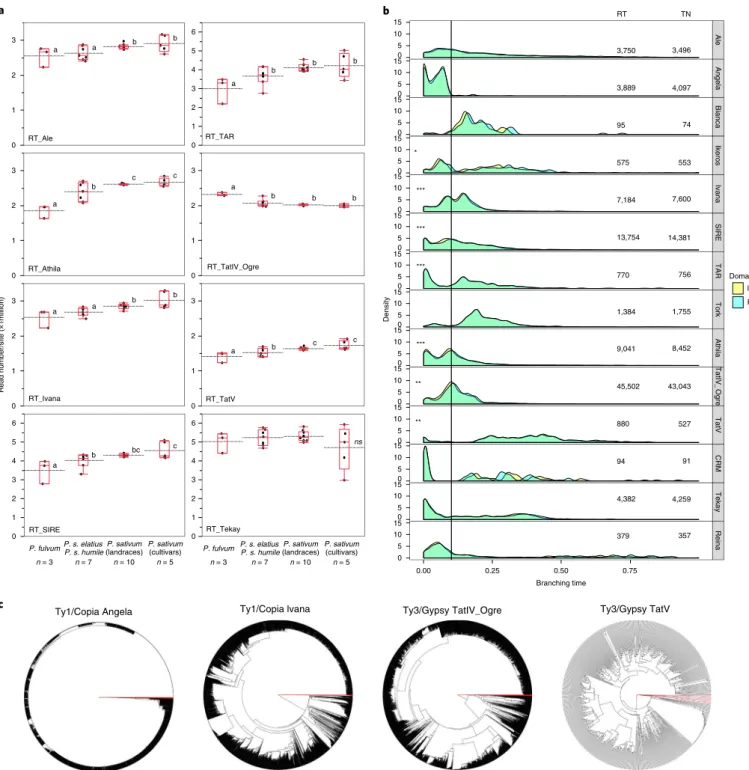
Investigation of TE representation in Pisum species and subspecies
confirmed that TE dynamics has shaped Pisum diversity through
successive expansions and deletions (Fig.
3a
and Supplementary
Dataset 6). P. fulvum has fewer of several retroelements compared to
cultivated pea and an increased content of Ogre retroelements. Wild
P. s. elatius TE representation is intermediate between P. fulvum and
cultivated pea. To determine the historical dynamics of the different
Ty3-gypsy and Ty1-copia retroelements in the pea genome, we
ana-lyzed the divergence of the reverse transcriptase (RT) and integrase
(INT) sequences of different TE lineages, revealing different
evo-lutionary patterns among lineages (Fig.
3b,c
). For example, Angela
elements are all relatively young, consistent with either an intense
and recent burst of insertion or a strong selection against Angela
elements. This is in marked contrast to TatV elements, which are
the most ancient (Fig.
3b
). Interestingly, all TE lineages that showed
significant representational differences among Pisum species
and subspecies were, on average, older or of the same age as Ogre
elements (Fig.
3c
).
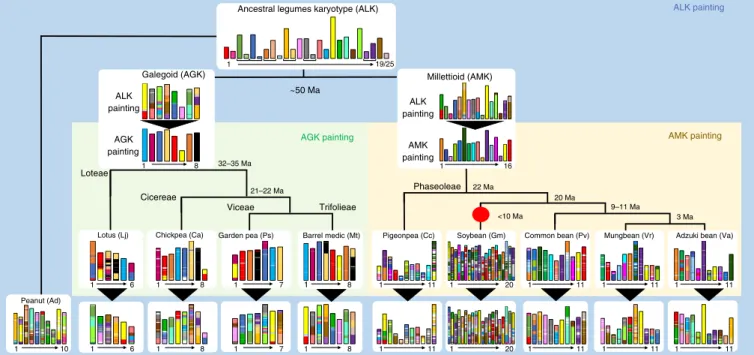
Paleohistory of modern legume genomes. To assess the
paleohis-tory of modern legume genomes
36, we performed homology and
synteny analyses (Supplementary Notes) with representatives of the
Galegoid (P. sativum, L. japonicus, M. truncatula and C. arietinum)
and Millettoid (C. cajan, G. max, P. vulgaris, V. radiata and Vigna
angularis (Willid.) Ohwi & H. Ohashi) clades, together with one
diploid peanut relative (Arachis duranensis Krapov. & W.C. Greg).
Within the Galegoid subfamily, we identified 12,025 ancestral genes
(that is, conserved between the four investigated species) defining
an ancestral Galegoid karyotype (AGK) of eight conserved
ances-tral regions (CARs). The pea genome differentiated from this AGK
through at least three chromosomal fissions, four fusions and a
translocation between chromosomes Ps1 and Ps5. The genome
of the closely related M. truncatula evolved through two fissions,
two fusions and one translocation (between Mt4-Mt8 (ref.
37),
Supplementary Fig. 9). The five Millettoid genomes had 12,387
ancestral genes, defining an ancestral Millettoid karyotype (AMK)
of 16 CARs. We then compared AGK, AMK and A. duranensis, an
outgroup of the Galegoid and Millettoid subfamilies and identified
25 CARs with 13,181 protogenes. Merging CARs sharing partial
synteny between a subset of these extant Millettoid and Galegoid
genomes elucidated the ancestral legume karyotype (ALK),
consist-ing of a minimum of 19 proto-chromosomes. We propose a legume
evolutionary scenario from the reconstructed ancestral karyotypes
showing that the legume genomes have been massively rearranged
during their evolution (Fig.
4
and Supplementary Table 11). This
approach delivered the first reconstruction of the Legume (ALK) as
well as Galegoid (AGK) and Millettoid (AMK) subfamily ancestors
and updated the publicly available catalog of paralogous and
orthol-ogous gene relationships between extant legume genomes (
https://
urgi.versailles.inra.fr/synteny/legumes
) for translational research
on conserved agronomical traits.
Pisum genome structure evolution. ‘Caméor’ shows a
transloca-tion compared to the ancestral Galegoid karyotype and while
trans-locations within Pisum have long been known
20–22, identifying the
chromosomes involved suffered from the lack of clear chromosome
identification. Cytological analyses
38identified pairwise crosses
between (1) P. sativum, including northern P. humile, (2) P. elatius,
including southern P. humile and (3) P. fulvum, which gave rise to
chromosomal rings during F
1meiosis and to low hybrid fertility,
suggesting that chromosome translocations accompanied Pisum
evolution. To reassess these events in the light of the pea genome
assembly, we sequenced single-chromosome samples isolated
from three accessions that were used by Ben-Ze’ev and Zohary
38(Supplementary Notes). These three lines were considered
arche-types of wild species and subspecies: ‘703’ for P. fulvum, ‘721’ for
P. elatius and ‘711’ for southern P. humile. DNA amplified from
~40 single chromosomes obtained for each (Supplementary Fig. 10
and Supplementary Table 12) was sequenced. Mapping reads
from each chromosome sample to the ‘Caméor’ pseudomolecules
identified the correspondence between the wild pea and Caméor
chromosomes (Fig.
5a,b
and Supplementary Fig. 11). All wild pea
chromosomes were assigned to ‘Caméor’ chromosomes, but for
accessions ‘711’, ‘721’ and ‘703’, reads from chromosome samples
corresponding to pseudomolecule 5 mapped only from 0 to 465 Mb
of this pseudomolecule and chromosome samples with reads
map-ping from ~465 Mb to the end of ‘Caméor’ pseudomolecule 5 also
98% Nelumbo nucifera Vitis vinifera Solanum lycopersicum Prunus persica Populus trichocarpa Arabidopsis thaliana Theobroma cacao Lupin angustifolius Arachis duranensis Arachis ipaensis Lotus japonicus Cajanus cajan Glycine max Pisum sativum Cicer arietinum Cicer reticulatum Phaseolus vulgaris Medicago truncatula Vigna radiata Vigna angularis Trifolium pratense Trifolium subterraneum Core eudicot Eudicot (basal) Rosoids (basal) Asterids E uros id s Fab ids M alvids Leguminosae/Papilionoideae 94% G alegoids Millettioids tt L-LS G-LS PWGD SWGD γ N-LS 55–13 Ma <19–353 Ma ~ 55 Ma ~11117 Ma 6600–65 Ma ~447 MaMa 8811–8888 Ma 5522–S-LS91 Ma 5544–– 6 Ma77 Trifolie ae F ab ea e Cicereae Lotea e Phaseoleae Dalberg . Genist. 0.2 Whole genome duplication Whole genome triplication
Pvul Tpra Atha 50 C DS count (1,000) 40 30 Genome size (Gb) 0.3 1.0 3.0 Pper Gmax Lang Mtru Ccaj Psat Aipa Ptri Ljap Tsub Nnuc Adur Slyc Cari Tcac Vang Vvin Vrad Cret 20 Trifolieae/Fabeaebbb T i FFF T T T T T Tfofo aeeeee/eeee/eee
IRLC Papilionoideae Genus-specific G G G Ge G G Ge G G G Ge G G Genenns ifififi Pisum sativum Medicago truncatula 0.1 0.4 1 2 4 6 10 Ks 40 0.02 20 Medicago truncatula Pisum sativum Inter chromosomes Intra chromosomes D ensity Ks 0 0.0 0.5 1.0 1 2 3 a b d c β α
Fig. 2 | Legume phylogenomics. a, Number of gene-coding sequences (CDS) against genome size (Mb) for selected Eudicot sequenced genomes (Supplementary Dataset 4). Data points are represented by centered labeled boxes; overlapping points are indicated. b, Maximum likelihood tree calculated using 28 orthologous sequences common to the eudicot species depicted. All clades have 100% support (1,000 bootstrap runs); support is noted otherwise. Branch length represents estimated nucleotide substitutions per site (bar = 0.2 substitutions per site). Whole-genome paleo-polyploidy events are labeled: γ common to all core eudicots, PWGD common to all Papilionoideae within the Leguminosae family; others are lineage-specific (LS): N-LS, S-LS, β and α, SWGD, L-LS, G-LS (Supplementary Notes). c, Ks distribution of paralog pairs classified by their lineage specificity: genus specific (white box plots), specific to genera in the Trifolieae-Fabeae clade (blue; paralog pairs common to Psat, Mt, Tpra and Tsub and absent from all other eudicots in the set), the IRLC (green) or the Papilionoideae (orange) clades. Density is denoted both by violin and quartile box-and-whisker plots. Data points are represented by gray jittered circles. Note x axis is presented on a log scale. d, Distribution of pairwise Ks for intra and interchromosomal synteny-selected paralog pairs within the pea and M. truncatula genome.
mapped to another ‘Caméor’ chromosome (Fig.
5b
). For accessions
‘711’ and ‘721’, these mapped predominantly to pseudomolecule 1 of
‘Caméor’, while for ‘703’ they mapped predominantly to
pseudomol-ecule 3 of ‘Caméor’ (Fig.
5b
). This indicated a translocation between
chromosomes 5 and 1 in ‘711’ and ‘721’ and between chromosomes
5 and 3 in ‘703’ as compared to ‘Caméor’. Investigating synteny
between pea and other Galegoid species suggested that the ancestral
Pisum karyotype resembled the present P.elatius/humile karyotype
Ale A ng ela Bi anca Ikero s Iv an a S IRE T A R To rk A thil a TT at IV T _ Og re T at V C RM Teka y R eina 0.00 0.25 0.50 0.75 357 4,259 91 527 43,043 8,452 1,755 756 14,381 7,600 553 74 4,097 3,496 TN RT 3,750 3,889 95 575 7,184 13,754 770 1,384 9,041 45,502 880 94 4,382 379 0 5 10 15 0 5 10 15 0 5 10 15 0 5 10 15 0 5 10 15 0 5 10 15 0 5 10 15 0 5 10 15 0 5 10 15 0 5 10 15 0 5 10 15 0 5 10 1500 0 5 10 15 0 5 10 15 INT RT * *** *** *** *** ** ** Branching time Ty3/Gypsy TatV Ty3/Gypsy TatIV_Ogre Ty1/Copia lvana Ty1/Copia Angela Domain Density 0 1 2 3 4 5 6 0 1 2 3 0 1 2 3 0 1 2 3 0 1 2 3 0 1 2 3 4 5 6 0 1 2 3 4 5 6 0 1 2 3 RT_Ale RT_Athila RT_Ivana RT_SIRE RT_TAR RT_TatIV_Ogre RT_TatV RT_Tekay a a b b a b b b a b c c a b b b a a b b a b c c a b bc c ns R
ead number/site (×1millio
n)
P. fulvum P. s. elatius P. s. humile(landraces)P. sativum P. sativum(cultivars) n = 3
n
P. fulvum P. s. elatius P. s. humile(landraces)P. sativum P. sativum(cultivars) n = 3
n
n = 7 n = 10 n = 5 n = 7n n = 10 n = 5
a b
c
Fig. 3 | TE evolution in the pea genome. a, TE representation in P. fulvum, P. s. elatius, P. s. sativum landraces and P. s. sativum cultivars (x axis). The y axis of the plot represents the abundance of selected retrotransposon families as measured by the number of reads mapping to a lineage-specific RT domain divided by the total number of reads that map to all RT domains and by the number of RT domains in the assembly, per million. Letters on each quartile box-and-whisker plot represent statistically different classes among the different groups of accessions (n = 3 P. fulvum, n = 7 P. elatius, n = 10 P. s. sativum landraces and n = 5 P. s. sativum cultivars, Supplementary Dataset 6). b, Neighbor-joining (NJ) trees were built from RT domain sequence similarities among different lineage-specific copies identified in the pea genome v.1a assembly. Deep branching revealed ancient expansion while flat branching is consistent with a recent burst of insertion activity. Red branches correspond to outgroup sequences c, The average age of TEs was revealed for the different lineages by the branching distribution in the NJ trees built from RT (light blue) and INT (yellow) protein domains. The vertical bar ca. branching time 0.10 indicates the peak of Ogre retroelement age distribution. Stars indicate families for which TE representation significantly varied among Pisum taxa (Supplementary Dataset 5). The RT and INT columns give the number of RT and INT domains present in the pea genome.
rather than the cultivated pea karyotype. Indeed, ‘Caméor’
chro-mosome 5 is syntenic with M. truncatula chrochro-mosome 3 from 0 to
467 Mb and with chromosome 2 of M. truncatula from 467 Mb to
its end (Fig.
4
). This breakpoint in synteny is close to the
transloca-tion point but lies 2 Mb closer to the centromere of chromosome 5.
Similarly, a breakpoint in synteny between ‘Caméor’ chromosome
5 and C. arietinum chromosome 5 occurred at this translocation
point, with the translocated fragment being syntenic with C. arieti
-num chromosome 1 (Fig.
4
). C. arietinum chromosome 1 and M.
truncatula chromosome 2 are syntenic with ‘Caméor’ chromosome
1 and the end of ‘Caméor’ chromosome 5. Considering the AGK
reconstruction (Supplementary Fig. 9), the ancestral Pisum
chro-mosome 1 probably contained the translocated fragment (Fig.
5c
),
as in the P. elatius/humile karyotype. This ancestral chromosome
would then have been involved in two independent rearrangements,
with the end of chromosome 1 translocated to chromosome 3 in
P. fulvum and to chromosome 5 in cultivated pea. What remains
unsolved is what role, if any, this breakage may have played in Pisum
evolution and adaptation. We note that the repetitive 5 S rRNA gene
sequences
39are present at these chromosomal regions (end of
chro-mosome 1, 3 and pericentromeric regions of chrochro-mosome 5)
sug-gestive of a role in these translocations.
Pisum genetic diversity. Pisum is extremely diverse in terms of
phe-notypes, and pea breeding could benefit from broad crosses,
includ-ing introgressions from wild relatives
40. Reproductive barriers are
not strict among Pisum species and subspecies
41. Davis
42proposed
that Pisum comprises two species, P. fulvum and P. sativum, with two
subspecies: P. s. sativum, which includes all formerly distinguished
cultivated types, and P. s. elatius, which includes all formerly
dis-tinguished wild types. Although useful, this classification does not
clarify the relationships between wild and domesticated forms, or
between former taxa. To help refine Pisum taxonomy and
evolu-tion, we resequenced the genomes of 36 Pisum accessions
represent-ing the range of diversity of the species and one Lathyrus sativus
accession as an outgroup. We also included public data from seven
Pisum accessions (Supplementary Dataset 7). Because the
bound-ary between wild and cultivated Pisum is blurred by possible
intro-gressions and/or migration, we reassessed the ‘wild’ and ‘cultivated’
status of accessions by scoring germination after imbibing freshly
harvested seeds in water for 7 d. Free germination is indeed
consid-ered the most important pea domestication trait
40. The accessions
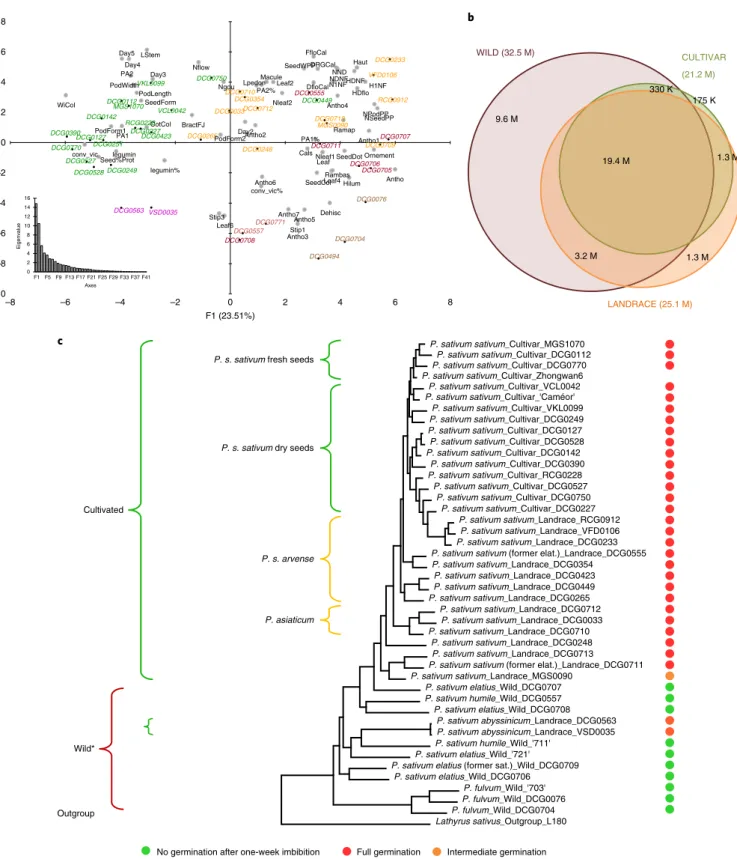
presented a wide range of phenotypic diversity (Fig.
6a
) as shown
by principal component analysis (PCA) of plant morphology,
phe-nology, seed productivity and quality traits, which separated wild,
landrace and cultivar accessions (Supplementary Dataset 7).
Whole-genome resequencing reads were mapped onto the
pea genome assembly and SNPs were called using BCFtools v.1.6.
After filtering, 17,212,424 high-quality SNPs were identified. On
37,591,394 alleles, 51.6% were shared among wild, landrace and
cultivar accessions, 25.6% were present only in wild accessions,
3.5% only in landraces and 0.5% only in cultivars (Fig.
6b
). Mean
nucleotide diversity (
π) decreased 1.7-fold between wild accessions
(
π = 8.2 × 10
−4) and landraces (
π = 4.9 × 10
−4), and 3.4-fold between
wild accessions and cultivars (
π = 2.4 × 10
−4), showing moderate
diversity reduction associated with pea domestication and
breed-ing (Fig.
6b
and Supplementary Fig. 12). This reduction was
accom-panied by a high mean pairwise population differentiation (F
ST)
between wild accessions and cultivars (F
ST= 0.213) and an increase
in linkage disequilibrium (LD) across the genome (Supplementary
Fig. 13). Mean D Tajima values were significantly positive in wild
accessions (D = 0.424) and slightly negative in cultivars,
consis-tent with recent selection (D = −0.038, Supplementary Fig. 12).
Phylogenetic analysis of a subset of two million SNPs clustered
accessions according to assigned taxon (Fig.
6c
): P. fulvum
clus-tered separately from P. sativum accessions. P. sativum accessions
clustered according to their cultivated status (wild or cultivated) as
well as their geographical origin and usage type (that is, as fodder,
dry or fresh seeds). Wild P. s. elatius included former P. elatius and
P. humile and cultivated P. s. sativum included P. transcaucasicum,
6 1 1 7 1 1 8 1 8 1 11 1 20 1 11 1 11 1 11 10 1 1 6 1 8 1 7 1 8 1 11 1 20 1 11 1 11 1 11Ancestral legumes karyotype (ALK)
Galegoid (AGK) ALK painting AGK painting ~50 Ma AMK painting ALK painting 1 16 Millettioid (AMK) ALK painting AMK painting 21–22 Ma 32–35 Ma AGK painting Loteae Cicereae Viceae Trifolieae 1 8
Lotus (Lj) Chickpea (Ca) Garden pea (Ps) Barrel medic (Mt)
Peanut (Ad)
Mungbean (Vr) Adzuki bean (Va) Common bean (Pv) Soybean (Gm) Pigeonpea (Cc) <10 Ma 3 Ma 9–11 Ma 20 Ma 22 Ma Phaseoleae 19/25
Fig. 4 | Legume evolutionary history. Evolutionary scenario of modern legumes (pea, diploid peanut, lotus, barrel medic, chickpea, pigeonpea, soybean, common bean, mungbean and adzuki bean) from the reconstructed ancestors of the Galegoid (AGK) and Millettoid (AMK) subfamilies as well as the ancestral legume karyotype (ALK with brackets under the 25 CARs defining 19 proto-chromosomes). Duplication event is shown with a red dot and estimated speciation dates are indicated on tree branches. The modern genomes are illustrated at the bottom with different colors reflecting the origin from ALK (referenced as the ALK painting) or from the inferred Galegoid and Millettoid ancestors (referenced as the AGK and AMK painting).
0.00 0.05 0.10 0.15 Coverage density AABG a b c ‘Caméor’ P. sativum sativum 703
P. fulvum P. sativum humile711 P. sativum elatius721
1 2 3 4 5 6 7 1 2 3 4 5 6 7 1 2 3 4 5 6 7 P. sativum sativum P. fulvum P. sativum elatius/humile Medicago truncatula Translocation 1 → 3 Translocation 1 → 5 0.0 1 2 3 4 5 6 7 0.1 0.2 0.3 0.4 Coverage density BH 0.00 0.05 0.10 0.15 0.20 Coverage density AABC 0.0 0.1 0.2 0.3 Coverage density AACQ 0.00 0.05 0.10 0.15 0.20 Coverage density AAEQ 0.0 0.1 0.2 0.3 Coverage density AADL 0.00 0.05 0.10 0.15 0.20 Coverage density AAEY chr1LG6 chr2LG1 chr3LG5 chr4LG4 chr5LG3 chr6LG2 chr7LG7
Fig. 5 | Pisum genome structure evolution. a, Flow-sorted single chromosomes of ‘Caméor’ were resequenced and reads mapped onto pseudomolecules. The example shows the reads mapping of a ‘Caméor’ chromosome sample corresponding to pseudomolecule 5. The color-codes for chromosomes are as in Fig. 1a. b, Mapping reads of flow-sorted single chromosomes of accessions ‘703’ (P. fulvum), ‘711’ (P. s. humile) and ‘721’ (P. s. elatius)38 identified the correspondence between wild pea chromosomes and the pea genome v.1a pseudomolecules. All chromosomes corresponded one to one to ‘Caméor’ chromosomes except for chromosome 5. Most of the short arm of chromosome 5 (depicted as gray boxes) was associated with other chromosomes in wild Pisum (chromosome 1 in P. s. elatius and P. s. humile, chromosome 3 in P. fulvum). c, Scenario of chromosome evolution. M. truncatula karyotype was used to infer the ancestral Pisum karyotype. In this scenario, two independent translocation events occurred, one leading to present P. fulvum and the other to P. s. sativum karyotypes.
P. asiaticum, P. arvense. P. hortense, but not Pisum abyssinicum. The
two P. abyssinicum accessions clustered among the wild P. sativum
elatius/humile accessions from Israel while presenting phenotypic
attributes of cultivated accessions, including free germination (Fig.
6c
).
This strengthens the hypothesis of an independent domestication
of this taxon from a distinct P. s. elatius
43followed by a migration
Wild*Outgroup Cultivated
P. s. arvense P. s. sativum dry seeds P. s. sativum fresh seeds
P. asiaticum
a b
c
No germination after one-week imbibition Full germination Intermediate germination
P. sativum sativum_Cultivar_MGS1070 P. sativum sativum_Cultivar_DCG0112 P. sativum sativum_Cultivar_DCG0770 P. sativum sativum_Cultivar_Zhongwan6 P. sativum sativum_Cultivar_VCL0042 P. sativum sativum_Cultivar_'Caméor' P. sativum sativum_Cultivar_VKL0099 P. sativum sativum_Cultivar_DCG0249 P. sativum sativum_Cultivar_DCG0127 P. sativum sativum_Cultivar_DCG0528 P. sativum sativum_Cultivar_DCG0142 P. sativum sativum_Cultivar_DCG0390 P. sativum sativum_Cultivar_RCG0228 P. sativum sativum_Cultivar_DCG0527 P. sativum sativum_Cultivar_DCG0750 P. sativum sativum_Cultivar_DCG0227 P. sativum sativum_Landrace_RCG0912 P. sativum sativum_Landrace_VFD0106 P. sativum sativum_Landrace_DCG0233 P. sativum sativum (former elat.)_Landrace_DCG0555 P. sativum sativum_Landrace_DCG0354 P. sativum sativum_Landrace_DCG0423 P. sativum sativum_Landrace_DCG0449 P. sativum sativum_Landrace_DCG0265 P. sativum sativum_Landrace_DCG0712 P. sativum sativum_Landrace_DCG0033 P. sativum sativum_Landrace_DCG0710 P. sativum sativum_Landrace_DCG0248 P. sativum sativum_Landrace_DCG0713 P. sativum sativum (former elat.)_Landrace_DCG0711 P. sativum sativum_Landrace_MGS0090 P. sativum elatius_Wild_DCG0707 P. sativum humile_Wild_DCG0557 P. sativum elatius_Wild_DCG0708 P. sativum abyssinicum_Landrace_DCG0563 P. sativum abyssinicum_Landrace_VSD0035 P. sativum humile_Wild_'711' P. sativum elatius_Wild_'721' P. sativum elatius (former sat.)_Wild_DCG0709
P. sativum elatius_Wild_DCG0706 P. fulvum_Wild_'703' P. fulvum_Wild_DCG0076 P. fulvum_Wild_DCG0704 Lathyrus sativus_Outgroup_L180 WILD (32.5 M) 9.6 M CULTIVAR (21.2 M) 175 K 1.3 M 3.2 M 19.4 M 1.3 M 330 K LANDRACE (25.1 M) MGS1070 DCG0494 DCG0771 DCG0705 DCG0750 DCG0423 DCG0563 DCG0710 DCG0712 DCG0127 DCG0390 DCG0251 RCG0228 DCG0354 DCG0713 DCG0233 VCL0042 DCG0033 DCG0112 DCG0449 RCG0912 DCG0711 DCG0527 MGS0090 DCG0555 DCG0557 DCG0248 DCG0528 DCG0227 DCG0770 VFD0106 DCG0076 DCG0709 DCG0707 VKL0099 DCG0249 DCG0142 DCG0265 VSD0035 DCG0708 DCG0706 DCG0704 Day2 Day3 Day4 Day5 BractFJ WiCol Antho Antho1 Antho2 Antho3 Antho4 Antho5 Antho6 Antho7 Nflow Leaf Leaf2 Leaf4 Leaf6 Nleaf1 Nleaf2 Stip1 Stip3 Macule DfloCal HDflo DRGCal FfloCal Dehisc Cals Rambas H1NF HDNF Haut Ramap N1NF NDNFNND Ngou Lpedon LStem NPodPPNSeedPP SeedWPP SeedCol Ornement SeedForm Hilum SeedDot CotCol PodForm1 PodForm2 PodLength PodWidth Seed%Prot legumin% conv_vic% PA1% PA2% legumin conv_vic PA1 PA2 –10 –8 –6 –4 –2 0 2 4 6 8 –8 –6 –4 –2 0 2 4 6 8 F2 (16.66%) F1 (23.51%) 0 2 4 6 8 10 12 14 16 F1 F5 F9 F13 F17 F21 F25 F29 F33 F37 F41 Eigenvalu e Axes
Fig. 6 | The genetic relationships among the Pisum genus. a, PCA of phenotypic traits (Supplementary Notes) discriminating the different Pisum gene pools. In green, modern cultivar accessions; in orange, landrace accessions; in burgundy, wild Pisum elatius and humile accessions; in brown, wild Pisum fulvum accessions, in purple, P. abyssinicum accessions. b, Alleles shared between wild, landrace and modern cultivar accessions. Resequencing data for 43 Pisum and a Lathyrus accessions detected 17.2 M high-quality SNPs, corresponding to 37.6 M alleles. c, Pisum phylogenetic tree was obtained using a subset of 2 M high-quality SNPs and taking Lathyrus sativus as an outgroup. All clades have >95% support (1,000 bootstrap runs). Former Pisum subspecies nomenclature described groups of accessions. Dots on the right-hand side indicate the germination ability of freshly harvested seeds on water, a key trait in pea domestication40. The two P. abyssinicum accessions (*) are cultivated peas but were clustered among wild Pisum accessions.
to Abyssinia possibly through ancient human trading routes
44.
The chloroplast phylogenetic tree supports this scenario
(Supplementary Fig. 14). Notably, the P. elatius accession closest to
the cultivated pea was PI639984, an accession collected in 1986 on
an abandoned agricultural terrace in Turkey, within the area where
pea cultivation emerged.
Seed storage protein gene families. Pea is an important source of
dietary proteins for humans and domestic animals. Fractionation
of pea seeds into protein, starch and fiber is expanding rapidly in
North America and Europe in response to the demand for
plant-based protein. Pea seed storage proteins (SSPs) include legumin,
vicilin and convicilin globulins and PA1 and PA2 albumins, whose
nutritional and technological properties vary according to their
amino-acid content and secondary structure
45,46. We searched
the pea genome assembly for SSP genes using all pea storage
protein genes available in UNIPROT (Supplementary Notes)
and found 12, 9, 2, 8 and 9 genes encoding legumin, vicilin,
convicilin, PA1 and PA2, respectively, as well as a few pseudogenes
(Supplementary Dataset 8).
The various SSPs that characterize the pea seed proteome vary in
quantity in response to the environment
47. Their diversity is
magni-fied by the range of (1) cleavage sites controlling pre-polypeptide
cleavage (Supplementary Fig. 15) and (2) transcriptional
regula-tory regions. Several regularegula-tory motifs, upstream of the SSP genes
are presumed to modulate their expression
48,49(Supplementary
Dataset 8) dependent on developmental and environmental cues.
The RY motif, reported to be required for SSP seed expression
50,
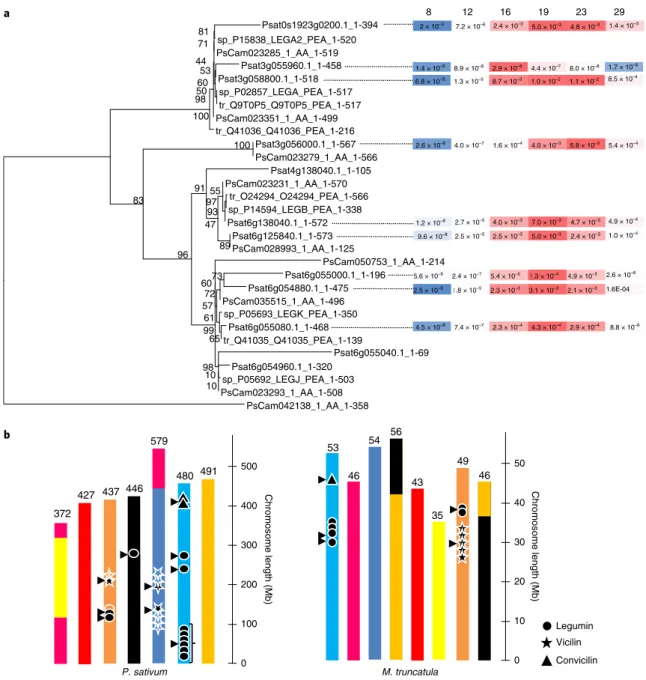
53 46 54 56 43 35 49 46 Chromosome length (Mb ) 2 × 10⁻³ 7.2 × 10⁻⁶ 2.4 × 10⁻³ 5.0 × 10⁻³ 4.8 × 10⁻³ 1.4 × 10⁻³ 1.4 × 10⁻⁸ 8.9 × 10⁻⁸ 2.9 × 10⁻⁶ 4.4 × 10⁻⁷ 8.0 × 10⁻⁸ 1.7 × 10⁻⁸ 6.8 × 10⁻⁹ 1.3 × 10⁻⁵ 8.7 × 10⁻³ 1.0 × 10⁻² 1.1 × 10⁻² 8.5 × 10⁻⁴ 8 12 16 19 23 29 Legumin Vicilin Convicilin P. sativum b 0 100 200 300 400 500 M. truncatula 0 10 20 30 40 50 Chromosome length (Mb ) a Psat0s1923g0200.1_1-394 sp_P15838_LEGA2_PEA_1-520 81 PsCam023285_1_AA_1-519 71 Psat3g055960.1_1-458 Psat3g058800.1_1-518 53 sp_P02857_LEGA_PEA_1-517 tr_Q9T0P5_Q9T0P5_PEA_1-517 98 60 44 PsCam023351_1_AA_1-499 50 tr_Q41036_Q41036_PEA_1-216 100 Psat3g056000.1_1-567 PsCam023279_1_AA_1-566 100 Psat4g138040.1_1-105 PsCam023231_1_AA_1-570 tr_O24294_O24294_PEA_1-566 sp_P14594_LEGB_PEA_1-338 97 Psat6g138040.1_1-572 93 55 Psat6g125840.1_1-573 PsCam028993_1_AA_1-125 89 47 91 PsCam050753_1_AA_1-214 Psat6g055000.1_1-196 Psat6g054880.1_1-475 73 PsCam035515_1_AA_1-496 72 sp_P05693_LEGK_PEA_1-350 Psat6g055080.1_1-468 tr_Q41035_Q41035_PEA_1-139 65 61 57 60 Psat6g055040.1_1-69 Psat6g054960.1_1-320 sp_P05692_LEGJ_PEA_1-503 10 PsCam023293_1_AA_1-508 10 98 99 96 83 PsCam042138_1_AA_1-358 2.6 × 10⁻⁸ 4.0 × 10⁻⁷ 1.6 × 10⁻⁴ 4.0 × 10⁻³ 5.8 × 10⁻³ 5.4 × 10⁻⁴ 9.6 × 10⁻⁸ 2.5 × 10⁻⁵ 2.5 × 10⁻³ 5.0 × 10⁻³ 2.4 × 10⁻³ 1.0 × 10⁻⁴ 1.2 × 10⁻⁸ 2.7 × 10⁻⁵ 4.0 × 10⁻³ 7.0 × 10⁻³ 4.7 × 10⁻³ 4.9 × 10⁻⁴ 2.5 × 10⁻⁹ 1.8 × 10⁻⁵ 2.3 × 10⁻³ 3.1 × 10⁻³ 2.1 × 10⁻³ 1.6E-04 5.6 × 10⁻⁹ 2.4 × 10⁻⁷ 5.4 × 10⁻⁵ 1.3 × 10⁻⁴ 4.9 × 10⁻⁵ 2.6 × 10⁻⁶ 4.5 × 10⁻⁸ 7.4 × 10⁻⁷ 2.3 × 10⁻⁴ 4.3 × 10⁻⁴ 2.9 × 10⁻⁴ 8.8 × 10⁻⁶ 372 427 437 446 579 480 491Fig. 7 | Pea seed storage protein gene families. a, Legumin gene tree including sequences from the pea genome reference, the UniProt database and the pea gene atlas reveals different clusters distributed on four loci; gene expression in developing seeds was investigated by microfluidic quantitative PCR using specific primers and is shown as color-coded bars (Supplementary Notes). Expression levels were averaged over three biological replicates. b, Organization of genes encoding globulins in the pea and the M. truncatula genomes reveal some conserved features. Chromosome color-codes are as in Fig. 4 showing the syntenic relationships between the pea and M. truncatula genomes. Figures above chromosome bars indicate the size of each chromosome.
was found upstream of all but three SSP genes, with some having
seven upstream RY motifs. Other motifs were found upstream
legu-min genes (for example ABRE motif) or vicilin genes (for example
ACGT motif). Expression analysis of some SSP genes (Fig.
7a
and
Supplementary Dataset 8), assessed by microfluidic quantitative
PCR, showed that RY motifs were not systematically associated
with seed specific expression. Examination of Legumin and Vicilin
genes in pea and M. truncatula showed an overall conservation of
tandem organization in these two species: clusters of SSP genes were
found on syntenic pea and M. truncatula chromosomes, but gene
copy number differed (Vicilin and Legumin genes on syntenic Ps3
and Mt7, Convicilin and Legumin genes on syntenic Ps6 and Mt1).
Additional gene clusters were found in pea (Vicilin genes on Ps5 and
Legumin genes on Ps6 and Ps4, Fig.
7b
). Interestingly, all Legumin
and Vicilin gene cluster positions in pea corresponded to reported
SSP quantity loci
51.
Discussion
Pea is an important plant-based protein source for human food
and animal feed. This reference genome provides a foundation to
elucidate Pisum evolution. The Pisum common ancestor was
prob-ably cytogenetically like P. s. elatius, this taxon evolved across the
Mediterranean and Middle East
40,52and gave rise in the northern
Middle East to P. s. sativum. P. fulvum diverged from the Pisum
ancestor in the southern Middle East. P. abyssinicum, an Ethiopian
cultivated form, is likely the result of a domestication event from
a southern P. s. elatius ancestor and is independent of the
domes-tication of P. s. sativum. Different lines of evidence suggested that
the pea genome is evolving at a faster pace than other investigated
Leguminosae genomes, potentially through transposon-mediated
unequal recombination giving rise to gain or loss of genes, or
ectopic double-strand break repair
34. Differential expansion and
removal of these elements probably shaped genomes throughout
the evolution of the Fabeae and notably within Pisum
19, suggesting
that repetitive elements were major drivers in the evolution of these
large genomes. A valuable tool for basic discovery, this high-quality,
annotated pea genome sequence will facilitate the characterization
of its many known mutants, enhance pea improvement and allow
more efficient use of the wide genetic diversity present in the genus.
Online content
Any methods, additional references, Nature Research reporting
summaries, source data, statements of code and data availability and
associated accession codes are available at
https://doi.org/10.1038/
s41588-019-0480-1
.
Received: 28 December 2018; Accepted: 10 July 2019;
Published online: 2 September 2019
References
1. Burstin, J., Gallardo, K., Mir, R. R., Varshney, R. K. & Duc, G. Improving protein content and nutrition quality, in Biology and Breeding of Food Legumes (eds Pratap, A. & Kumar, J.) 314–328 (CAB International, 2011). 2. Guillon, F. & Champ, M. M.-J. Carbohydrate fractions of legumes: uses in
human nutrition and potential for health. Br. J. Nutr. 88, S293–S306 (2002). 3. Dahl, W. J., Foster, L. M. & Tyler, R. T. Review of the health benefits of peas
(Pisum sativum L.). Br. J. Nutr. 108, S3–S10 (2012).
4. Foschia, M., Horstmann, S. W., Arendt, E. K. & Zannini, E. Legumes as functional ingredients in gluten-free bakery and pasta products. Ann. Rev. Food Sci. Technol. 8, 75–96 (2017).
5. Nemecek, T. et al. Environmental impacts of introducing grain legumes into European crop rotations. Eur. J. Agron. 28, 380–393 (2008).
6. Crews, T. E. & Peoples, M. B. Legume versus fertilizer sources of nitrogen: ecological tradeoffs and human needs. Agric. Ecosyst. Environ. 102, 279–297 (2004).
7. Poore, J. & Nemecek, T. Reducing food’s environmental impacts through producers and consumers. Science 360, 987–992 (2018).
8. Zohary, D. & Hopf, M. Domestication of Plants in the Old World (Oxford Univ. Press, Oxford, 2000).
9. Doležel, J. et al. Plant genome size estimation by flow cytometry: inter-laboratory comparison. Ann. Bot. 82, 17–26 (1998). 10. Young, N. D. et al. The Medicago genome provides insight into the
evolution of rhizobial symbioses. Nature 480, 520–524 (2011).
11. Sato, S. et al. Genome structure of the legume, Lotus japonicus. DNA Res. 15, 227–239 (2008).
12. Schmutz, J. Genome sequence of the palaeopolyploid soybean. Nature 463, 178–183 (2010).
13. Mendel, G. Versuche über Pflanzenhybriden. Verhandlungen des naturforschenden Vereines in Brünn, Bd. IV für das Jahr 1865. Abhandlungen, 3–47 (1866).
14. Ellis, T. H. N., Hofer, J. M. I., Timmerman-Vaughan, G. M., Coyne, C. J. & Hellens, R. P. Mendel, 150 years on. Trends Plant Sci. 16, 590–596 (2011). 15. Tayeh, N. et al. Genomic tools in pea breeding programs: status and
perspectives. Front. Plant Sci. 6, 1037 (2015).
16. Ellis, T. H. N. & Poyser, S. J. An integrated and comparative view of pea genetic and cytogenetic maps. New Phytol. 153, 17–25 (2002).
17. Flavell, R. B., Bennett, M. D., Smith, J. B. & Smith, D. B. Genome size and the proportion of repeated nucleotide sequence DNA in plants. Biochem. Genet. 12, 257–269 (1974).
18. Murray, M. G., Peters, D. L. & Thompson, W. F. Ancient repeated sequences in the pea and mung bean genomes and implications for genome evolution. J. Mol. Evol. 17, 31–42 (1981).
19. Macas, J. et al. In depth characterization of repetitive DNA in 23 plant genomes reveals sources of genome size variation in the legume tribe Fabeae. PLoS One 10, e0143424 (2015).
20. Hammarlund, C. & Håkansson, A. Parallelism of chromosome ring formation, sterility and linkage in Pisum. Hereditas 14, 97–98 (1930). 21. Sansome, E. Segmental interchange lines in Pisum sativum. Nature 139,
113 (1937).
22. Lamm, R. & Miravalle, R. J. A translocation tester set in Pisum. Hereditas 45, 417–440 (1959).
23. Gali, K. K. et al. Development of a sequence-based reference physical map of pea (Pisum sativum L.). Front. Plant Sci. 10, 323 (2019).
24. Neumann, P., Pozárková, D., Vrána, J., Doležel, J. & Macas, J. Chromosome sorting and PCR-based physical mapping in pea (Pisum sativum L.). Chromosome Res. 10, 63–71 (2002).
25. Tayeh, N. et al. Development of two major resources for pea genomics: the GenoPea 13.2K SNP Array and a high density, high resolution consensus genetic map. Plant J. 84, 1257–1273 (2015).
26. Neumann, P. et al. Stretching the rules: monocentric chromosomes with multiple centromere domains. PLoS Genet. 8, e1002777 (2012). 27. Pellicer, J., Hidalgo, O., Dodsworth, S. & Leitch, I. Genome size diversity
and its impact on the evolution of land plants. Genes 9, 88 (2018). 28. Bennett, M. C. & Leitch, I. J. Plant DNA C-values Database release 6.0
(FAIRsharing.org, 2012); https://doi.org/10.25504/FAIRsharing.7qexb2 29. Hane, J. K. et al. A comprehensive draft genome sequence for lupin
(Lupinus angustifolius), an emerging health food: insights into plant– microbe interactions and legume evolution. Plant Biotechnol. J. 15, 318–330 (2017).
30. Blixt, S. Mutation genetics in Pisum. Agric. Hort. Genet. 30, 1–293 (1972). 31. Cannon, S. et al. Multiple polyploidy events in the early radiation of
nodulating and nonnodulating legumes. Mol. Biol. Evol. 32, 193–210 (2015). 32. Bowers, J. E., Chapman, B. A., Rong, J. & Paterson, A. H. Unravelling
angiosperm genome evolution by phylogenetic analysis of chromosomal duplication events. Nature 422, 433–438 (2003).
33. Lavin, M., Herendeen, P. S. & Wojciechowski, M. F. Evolutionary rates analysis of Leguminosae implicates a rapid diversification of lineages during the tertiary. Syst. Biol. 54, 575–594 (2005).
34. Li, S. F. et al. Chromosome evolution in connection with repetitive sequences and epigenetics in plants. Genes 8, 290 (2017).
35. De Vega, J. J. et al. Red clover (Trifolium pratense L.) draft genome provides a platform for trait improvement. Sci. Rep. 5, 17394 (2015).
36. Lee, C., Yu, D., Choi, H. K. & Kim, R. W. Reconstruction of a composite comparative map composed of ten legume genomes. Genes Genom. 39, 111–119 (2017).
37. Kamphuis, L. G. et al. The Medicago truncatula reference accession A17 has an aberrant chromosomal configuration. New Phytol. 174, 299–303 (2007). 38. Ben-Ze'ev, N. & Zohary, D. Species relationships in the genus Pisum L. Isr.
J. Bot. 22, 73–91 (1973).
39. Neumann, P., Nouzová, M. & Macas, J. Molecular and cytogenetic analysis of repetitive DNA in pea (Pisum sativum L.). Genome 44, 716–728 (2001). 40. Ladizinsky, G. & Abbo, S. (eds.) The Pisum genus. in The Search for Wild
Relatives of Cool Season Legumes 55–68 (Springer, 2015).
41. Kosterin, O. E. & Bogdanova, V. S. Reciprocal compatibility within the genus Pisum L. as studied in F1 hybrids: 1. Crosses involving P. sativum L.
subsp. sativum. Genet. Resour. Crop Evol. 62, 691–709 (2015).
42. Davis, P. H. in Flora of Turkey and the East Aegean Islands Vol. 3 (ed P. H. Davis) 370–373 (Edinburgh Univ., 1970).
43. Weeden, N. F. Domestication of pea (Pisum sativum L.): the case of the Abyssinicum pea. Front. Plant Sci. 9, 515 (2018).
44. Pagani, L. et al. Ethiopian genetic diversity reveals linguistic stratification and complex influences on the Ethiopian gene pool. Am. J. Hum. Genet. 91, 83–96 (2012).
45. Gabriel, I. et al. Variation in seed protein digestion of different pea (Pisum sativum L.) genotypes by cecectomized broiler chickens: 1. Endogenous amino acid losses, true digestibility and in vitro hydrolysis of proteins. Livest. Sci. 113, 251–261 (2008).
46. Rubio, L. A. et al. Characterization of pea (Pisum sativum) seed protein fractions. J. Sci. Food Agric. 94, 280–287 (2014).
47. Bourgeois, M. et al. Dissecting the proteome of pea mature seeds reveals the phenotypic plasticity of seed protein composition. Proteomics 9, 254–271 (2009).
48. Casey, R. & Domoney, C. in Seed Proteins (eds Shewry, P. R. & Casey, R.) 171–208 (Kluwer Academic Publishers, 1999).
49. Yoshino, M., Nagamatsu, A., Tsutsumi, K. I. & Kanazawa, A. The regulatory function of the upstream sequence of the β-conglycinin α subunit gene in seed-specific transcription is associated with the presence of the RY sequence. Genes Genet. Syst. 81, 135–141 (2006).
50. Yamamoto, S., Nishihara, M., Morikawa, H., Yamauchi, D. & Minamikawa, T. Promoter analysis of seed storage protein genes from Canavalia gladiata DC. Plant Mol. Biol. 27, 729–741 (1995).
51. Bourgeois, M. et al. A PQL (protein quantity loci) analysis of mature pea seed proteins identifies loci determining seed protein composition. Proteomics 11, 1581–1594 (2011).
52. Smýkal, P. et al. Genomic diversity and macroecology of the crop wild relatives of domesticated pea. Sci. Rep. 7, 17384 (2017).
Acknowledgements
We thank F. Jacquin, M. Chabert-Martinello, C. Rond-Coissieux, M. Touratier, M. Naudet-Huart and F. Naudé for their expert assistance in preparing plant and DNA materials and in phenotyping accessions. We are thankful to V. Jamilloux (REPET) and J. Gouzy (Eugene) for their support, to Z. Dubská, M. Karafiátová and J. Weiserová for assistance in flow-cytometry chromosome sorting, to V. Vernoud for providing seed tissues for transcriptomics, to E. Bonin for the high-throughput q-PCR assays, to E. Marquand, A. Chauveau and D. Brunel for the generation and management of resequencing 32 accessions, to CEA-IG/CNG for providing access EPGV group to its DNA quality control service and their Illumina sequencers, to E. van der Vossen (Keygene) for the development of the physical map, to H. Bergès for providing the BAC library, to D. Pouchnik and M. Wildung for PacBio library preparation and sequencing, to C. Cruaud for miRNA sequencing, to M. Siol and P. Smykal for the choice of resequenced accessions, to M. Siol for initiating the PARI Pisdom project, to N. Hostáková for her assistance during initial phases of repeat analysis, to B. Noel for data submission, to Raphael Flores for making the legume synteny data publicly available, to R. Thompson, N. Tayeh and K. Avia for discussions and reviewing the manuscript, and to V. Malécot for helpful discussions on taxonomy. This project was supported by ANR France-Génomique (no. ANR-10-INBS-09; Illumina genome sequencing, chromosome resequencing, assembly), ANR Genopea (no. ANR-09-GENM-026; resequencing), Région Bourgogne Franche-Comté (Projet PARI Pisdom; resequencing), European FP7 project ‘Legumes for the Agriculture of Tomorrow’ (no. 613551; genetic mapping), Czech Science Foundation (no. 17-09750S, centromere and repeat analysis), Czech Ministry of Education, Youth and Sports ERDF project ‘Plants as a tool for sustainable global development’, no. CZ.02.1.01/0.0/0.0/16_019/0000827 (chromosome sorting and optical maps), AVRIL (France; annotation and mapping), Saskatchewan Pulse Growers (Canada, WGP), USA Dry Pea & Lentil Council, Northern Pulse Growers (USA, PacBio sequencing), the Australian Grains Research and Development Corporation (no. GRDC CUR00021, skim-GBS and chromosome sequencing), Australian Research Council
(nos. LP160100030 and LP140100537 to D.E. and J.Batley) and the AUS-Aid Australian Awards for Africa Scholarship (to C.J.T. supervised by J.L.). J.L., R.A.S., C.J.T., D.E., P.E.B. and H.T.L. were supported by resources provided by the Pawsey Supercomputing Centre with funding from the Australian Government and the Government of Western Australia. P.E.B. acknowledges the support of the Forrest Research Foundation.
Author contributions
J.K., G.A., M.A.M., J.D., J.M., D.E., T.D.W., C.J.C., J.L. and J.Burstin formed part of the International Pea Genome Sequencing Consortium steering committee and established the experimental outline. G.A. supervised DNA material production, A. Klein supervised plant material production and phenotyping, C.J.C. and J. Burstin supervised the germplasm choice. P.W. and K.L. generated Illumina genomic sequence data and single-chromosome sequencing data. D.M., R.M. and C.J.C. generated PacBio genomic sequence data. C.J.T. and J.L. conducted transcriptome assays and generated RNA-seq data. M.A.M., P.W., L.d’A. and J.M.A. conducted the genome assembly. J.K., A. Kougbeadjo, G.A. and J. Burstin curated and improved genome assembly. J.K. and C.F. produced the genome annotation. A.Bendahmane supervised the generation of the BAC library. P.C., J.V., J.D. performed flow cytometric sorting of single chromosomes and amplified their DNA for sequencing. H.T., Z.M., C.B. and J.D. made the associated optical maps. G.A., K.G. and J.Burstin performed the seed storage protein gene analyses. P.E.B., H.T.L., J.Batley and D.E. generated the skim-GBS map and ‘Caméor’ single-chromosome sequencing. A.Bérard, M.C.L.P., K.L., C.J.C., D.M., R.M. generated re-sequencing data. K.K.G., B.T. and T.D.W. procured the whole-genome profiling data. R.A.S., J.K., A. Kougbeadjo, J.L. and J.Burstin contributed to the whole-genome evolution studies. C.H. and J.S. reconstructed the legume paleo-genome. C.B. and W.B. developed the whole-genome optical maps. M.T., G.A. and K.G. performed the miRNA analyses. J.K., P.Novak, I.V., P.Neumann, J.Burstin and J.M. analyzed repetitive DNA. I.V., P.Neumann and J.M. performed FISH assays. N.E. contributed to data analysis. N.M., M.T. and J.K. set up the JBrowse platform. M.F. built the genetic maps. J.K., J.M., C.J.C., J.S., J.L. and J.Burstin wrote the paper. G.A., K.G, P.W., J.D., C.B., D.E., B.T., T.D.W., D.M., R.M. and N.E. edited the paper. All authors have read and approved the manuscript.
Competing interests
The authors declare no competing interests.
Additional information
Supplementary information is available for this paper at https://doi.org/10.1038/ s41588-019-0480-1.
Reprints and permissions information is available at www.nature.com/reprints.
Correspondence and requests for materials should be addressed to J.B.
Publisher’s note: Springer Nature remains neutral with regard to jurisdictional claims in
published maps and institutional affiliations. © The Author(s) 2019
Open Access This article is licensed under a Creative Commons
Attribution 4.0 International License, which permits use, sharing, adap-tation, distribution and reproduction in any medium or format, as long as you give appropriate credit to the original author(s) and the source, provide a link to the Creative Commons license, and indicate if changes were made. The images or other third party material in this article are included in the article’s Creative Commons license, unless indicated otherwise in a credit line to the material. If material is not included in the article’s Creative Commons license and your intended use is not permitted by statu-tory regulation or exceeds the permitted use, you will need to obtain permission directly from the copyright holder. To view a copy of this license, visit http://creativecommons. org/licenses/by/4.0/.