Publisher’s version / Version de l'éditeur:
Trends in Welding Research 2006: Proceedings of the 7th International
Conference, pp. 127-132, 2006-08
READ THESE TERMS AND CONDITIONS CAREFULLY BEFORE USING THIS WEBSITE. https://nrc-publications.canada.ca/eng/copyright
Vous avez des questions? Nous pouvons vous aider. Pour communiquer directement avec un auteur, consultez la première page de la revue dans laquelle son article a été publié afin de trouver ses coordonnées. Si vous n’arrivez pas à les repérer, communiquez avec nous à [email protected].
Questions? Contact the NRC Publications Archive team at
[email protected]. If you wish to email the authors directly, please see the first page of the publication for their contact information.
NRC Publications Archive
Archives des publications du CNRC
This publication could be one of several versions: author’s original, accepted manuscript or the publisher’s version. / La version de cette publication peut être l’une des suivantes : la version prépublication de l’auteur, la version acceptée du manuscrit ou la version de l’éditeur.
Access and use of this website and the material on it are subject to the Terms and Conditions set forth at
Experimental Differences between Aluminium Welding of Tee and Lap
Joints by a cw/Nd:YAG Laser
Dubourg, L.
https://publications-cnrc.canada.ca/fra/droits
L’accès à ce site Web et l’utilisation de son contenu sont assujettis aux conditions présentées dans le site LISEZ CES CONDITIONS ATTENTIVEMENT AVANT D’UTILISER CE SITE WEB.
NRC Publications Record / Notice d'Archives des publications de CNRC:
https://nrc-publications.canada.ca/eng/view/object/?id=e8fd5b51-2813-44f2-a9f6-f1b1c99f00a1 https://publications-cnrc.canada.ca/fra/voir/objet/?id=e8fd5b51-2813-44f2-a9f6-f1b1c99f00a1
IMI2005109448-G
CNRC 47914
Experimental differences between aluminium welding of Tee and lap
joints by a cw/Nd:Y AG laser
L. Dubourg
Aluminium Technology Centre, National Research Council Canada, (Quebec) Canada
Abstract
The effect of laser welding parameters such as laser power, out-of-focus length, welding speed and wire feeding speed on weld properties was studied in tee and lap joint configurations. Two and three-millimetre thick plates of AA6061 were welded in tee configuration using a cwfNd:YAG laser and AA5356 wire as the filler metal. The same set-up and wire feeding were used for the lap joining of 2.5 -millimetre thick square extruded tubes and 2 millimetre plates of AA6061. A combination of Taguchi and EM designs of experiment was carried out to explore efficiently the multidimensional variations of welding parameters, to optimise these parameters and to compare the experimental differences between the two joint configurations. This combination defines promptly the feasibility domain and builds dynamically of this feasibility domain throughout the data collection. Weld samples were characterized by optical microscopy and hardness measurements. The weld characteristics of interest were weld fillet size, penetration depth, concavity size and heat affected zone dimensions measured by the hardness mapping. The process parameters and their respective and interactive effects on the final responses have been investigated. The results indicate the interlateral relationship between laser process
parameters and responses and fundamental
differences between the tee and lap laser welding, highlighting the difference of cooling flows of the two set-up types.
1. Introduction
Many studies conducted on aluminium laser welding have shown that a number of process parameters could affect weld properties. Effects of composition as well as volumetric flow rate of the shielding gas [1, 2], laser power [1,2], welding speed [1-4] and out-of-focus length [4, 5] on one or more of the properties such as porosity, keyhole stability, weld geometry, hot cracking, penetration depth, loss of alloying elements due to vaporization and the HAZ size have been investigated. Most studies are based on butt joint or bead-on-plate welding without using any filler. In instances where a large number of parameters is considered, the use of design of experiment (DOE) is
recommended. In this study, DOE was conducted using both Taguchi and EM (define TaguchilEM) methods. The Taguchi method is based on an orthogonal array system and leads to a design where the effect of every parameters can be evaluated in far fewer runs [6-8]. The EM technique is based on building an Euclidian domain and modifying it in an interactive way, varying all the parameters at the same time [9-11]. The combination of Taguchi and
EM methods has already been used in aluminium
laser welding [12]. This allows the investigation of the process parameters and their respective and interactive effects on the final responses (weld fillet size, penetration depth, concavity size). The results indicate the interlateral relationship between laser process parameters and responses and fundamental differences between the tee and lap laser welding.
2. Experimental procedure
A Nd:YAG laser of L064-llm wavelength and an optical fibre of 600-llm diameter were used in continuous wave mode. A lens of 200-mm focal length focussed the beam to a diameter of 0.6 mm. In tee configuration, AA6061-T6 plates of 2-mm thick were welded on AA6061-T6 sheets of 3-mm thick (Fig. La). In lap configuration, AA6061-T6 plates of 2-mm thick were welded on AA6061-T6 square tubes of2.5-mm thick wall (Fig. Lb).
/-/ -~"'-' ,~. ,&;;0 ,
~
b)Figure 1: samples after welding: a) Teejoint welding, b) lapjoint welding.
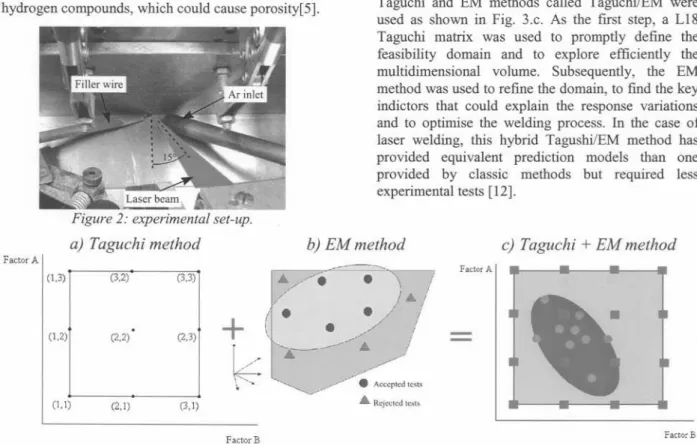
The work angle between the laser beam and the horizontal plate is set at 45°. Afterwards, the laser beam is tilted with an angle of 15°as shown in Fig. 2. The normal incidence was avoided to minimize beam reflections, which could damage the optical fibre. Argon was used as the shielding gas and was injected through a copper nozzle using a volumetric flow rate of 25 l.min-'. AA5356 filler wire of 1.2-mm diameter was fed at a 60° angle relative to laser axis. The plate surface was degreased with acetone to minimize hydrogen compounds, which could cause porosity[5].
The influence of the laser welding parameters (laser power, out-of-focus length, welding speed and wire feeding speed) on weld properties was studied. In this study, a combination of Tagushi and EM methods was used to optimise the welding parameters in the two joint configurations. The Taguchi method relies on a normalized orthogonal matrix. Each set of matrix assures that the space will be investigated in a way that the effect of every variable can be clearly detected. This could be done by varying many parameters at the same time along the orthogonal border of the orthogonal domain. For example, Fig. 3.a shows a L9 matrix for 2 factors with 3 levels. In this case, it is equivalent to a traditional factorial design with 32 trials. Alternatively, E.M. technique is based on building a Euclidian domain and modifying it in an interactive way, varying all the parameters at the same time. The process feasibility domain is then defined by a multidimensional volume that best discriminates the accepted tests inside this volume and the rejected tests outside it. Fig. 3.b illustrates this feasibility domain (blue zone). This method allows a more interactive approach through dynamic construction of the feasibility domain throughout the data collection. In the present study, a combination of Taguchi and EM methods called Taguchi/EM were used as shown in Fig. 3.c. As the first step, a LI8 Taguchi matrix was used to promptly define the feasibility domain and to explore efficiently the multidimensional volume. Subsequently, the EM method was used to refine the domain, to find the key indictors that could explain the response variations and to optimise the welding process. In the case of laser welding, this hybrid Tagushi/EM method has provided equivalent prediction models than one provided by classic methods but required less experimental tests [12].
b) EM method c) Taguchi + EM method Factor A
.
-~'.
Accepted.e5ts ...Rejected tests Factor BFigure 3: a) Example of Taguchi method: L9 design for 2 factors at 3 level each, b) Example of E.M method: feasibility domain of the process (blue zone), c) Example of Taguchi/EM method (.. point obtained with Taguchi,
-: point obtained with EM, blue zone:feasibility domain, orange zone: domain explored with the Taguchi method).
a) Taguchi method FactorA
I
""J
.
(3,2) (3.3) (1.2)1 (2.2).
(2.3)+
..
' I.
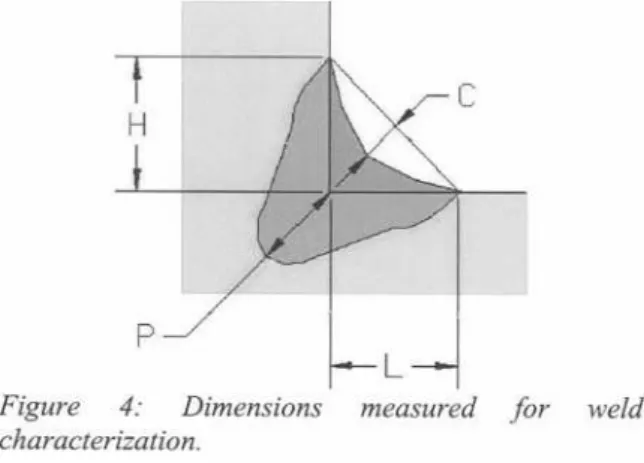
I (1,1) (2,1) (3.1) FactorBThe weld geometry was evaluated using an optical microscope. Four dimensions were measured for each sample as shown in Fig. 4. (H) and (L) are the vertical and horizontal leg sizes respectively of the fillet weld and the average size is defmed as (H+L)/2. The distance from the junction of the two joint members to the most distant weld point in the substrate is defined as the penetration depth (P). For this work the effective throat of the weld was not measured. Finally, a triangle of height (H) and width (L) was drawn. The hypotenuse of this triangle represents a flat weld of same dimension as the actual weld. The concavity of the weld is C, the maximum distance (C) the gap between the hypotenuse and the weld surface. Hardness measurements were used to determine the HAZ size in the two joint configurations. To this end, the hardness mapping was conducted through the thickness of both joint members for an 8 mm length about the root of the weld, with a sampling step of 250 !-lmin the two directions. These measurements were performed with a load of50g applied for 15s.
p
Figure 4: Dimensions
characterization. measured for weld
3. Results and discussion
With the Taguchi/EM method, two steps were considered. A Ll8 matrix was used in the first step, combining 4 input parameters with 4 levels each, for a total of 18 trials. These input parameters were the laser power (ranging from 2500 to 3500 W), the out-of-focus length (ranging from -1 to 1 mm, negative length meaning a focal point within the substrate), the wire filler speed (from 2 to 6 m.min-I) and the welding speed (between 2 and 4 m.min-I). This exercise promptly defined the feasibility domain and explored efficiently the multidimensional volume. In the second step, the interactive EM technique was used, i.e. varying all the parameters at the same time. The domain was refined test after test and each subsequent test was selected in such way to maximize the gain in new information. This method takes a more interactive approach leading to the dynamic
----construction of the feasibility domain throughout the data collection. After these two steps, the feasibility domain was well known and the prediction equations were stable [12]. All regression equations modelling the different responses as function of the input parameters showed R2 regression coefficients above 70%, indicating a good fit.
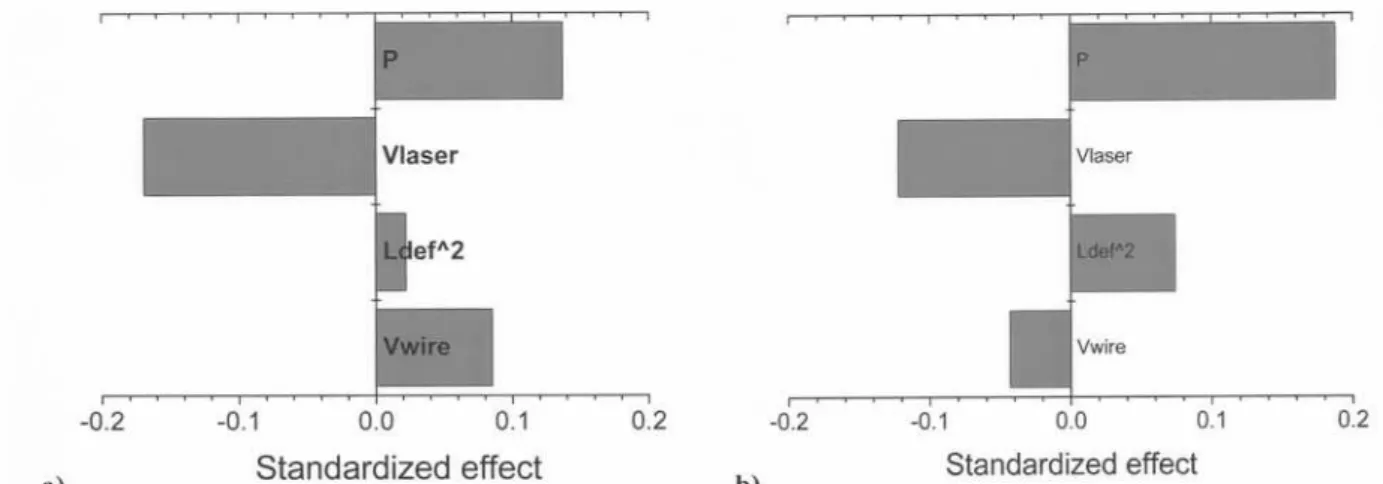
Fig. 5 and 6 show the Pareto charts for the weld average size and penetration depth as a function of the welding parameters. The Pareto chart is an illustration of the estimated effects of the input parameters. The length of each bar on the chart is proportional to the positive or negative standardized effect. According to Fig. 5, weld average size is correctly predicted by the laser power (P) and the welding speed (Vtaser)for the two joint configurations. This leads to the following conclusions. (i) The weld size is mainly proportional to the linear energy input, i.e. the laser power divided by the welding speed. (ii) Wire feeding speed (V"ir.J,i.e. the quantity of filler material, does not influence the weld size. This observation led to the conclusion that, for each couple
(P
-
Vlase,),it exists a single value (V"ir.J, which canlead to a correct weld. (iii) The square of the out-of-focus length, i.e. the area of the laser beam spot linked to power density, does not influence the weld size. (iv) The welding behaviour is not influenced by the different joint configurations and cooling flows,
(P) and (Vlaser) being the main predictors. Nevertheless, the weld size of tee joint welding is mainly predicted by the welding speed with a standardized effect of -0.17, while the weld size of lap joining is predominated by the laser power (standardized effect of 0.19).
-0.1 0.0 0.1
a) Standardized effect b)
Figure 5: Pareto charts of weldaverage size (H+L)/2: a) teejoint set-up, and (b) lapjoint set-up. Input parameters:
laser power (P), welding speed (Vtaser),square of the out-of-focus length (Lde/,2), Wirefeeding speed (V,,;r,,)'
p -0.2 0.2
I
II
I
I
I
I
The laser power and the wire feeding speed can predict the penetration depth of tee and lap joints as shown in Fig. 6. A higher laser power leads to a deeper penetration. On the other hand, a higher wire speed leads to a higher laser beam masking to the
samplesurface,causinga power inputreductionand
p Vlaser Ldefl\2 Vwire p -0.2 -0.1 0.0 0.1 Standardized effect 0.2
thereforeashallowerpenetrationdepth. We can see in the Fig. 6 that the main predictor of the penetration depth is the laser power (P) in the case tee joint with a standardized effect of 0.42. In contrast with this, the lap joint welding is dominated by the wire feeding speed with a standardized effect of -0.18.
p
-0.2 -0.1 0.0 0.1 0.2 0.3 0.4 -0.2 -0.1 0.0 0.1
a) Standardized effect b) Standardized effect
Figure 6: Pareto charts of penetration depth (P): a) tee joint set-up, and (b) lap joint set-up. Input parameters: laser power (P), welding speed (~aser)' square of the out-of-focus length (Lde/,2), wirefeeding speed (V,,;r,,)'
The previous process modelling was used to find the welding parameters most optimised and robust for the both joint configurations. The optimisation criteria were defined as follows: the welding speed was maximized in order to minimize the HAZ size, the weld average size was targeted of 1.9 rom, concavity size was targeted of 0 rom and penetration depth was minimized to 0.3 rom. Fig. 7 shows the optimised welding parameters obtained by the Taguchi/EM method for the tee and lap joint configurations. The weld cross-sections observed with these optimised parameters are also presented. As shown in Fig. 7, the
0.2
targeted weld specifications were met with these parameters. Moreover, the welding speed for lap joining (Vlaser= 3.9 m.min-l) is about 2 times higher than one observed for tee joining (Vlaser= 2.2 m.min,I). This difference can be explained by the difference of cooling flows between the two types of set-up. In the case of tee joint, the horizontal plate is clamped onto an aluminium table. This set-up increases the cooling flow through the horizontal plate. Consequently, in order to obtain the targeted weld, the heat input must be higher; the welding speed is then reduced. Paradoxically, this
phenomenon cannot be balanced by an increase of laser power: a laser power increase leads to a higher penetration depth as shown in the Pareto chart of the Fig. 6.a. In order to obtain the same material feeding and consequently the same weld size at higher welding speed, the wire speed of tee joint welding (Vwire= 3.1 m.min.l) is raised to 4.8 m.min.l for lap joint welding. For both sets-up, the same out-of-focus length (Ldef= -1.3 mm) is observed.With respect to
a) 0wire = 1.2 mm Plaser= 2500 W 'Vwire= 3.1m.min,l Vlaser= 2.2m.min.1 Ldef= -1.3 mm
lap weld quality, fusion (i.e. adequate depth of fusion) to the hollow extruded tube was achieved with minimal risk of a microfissuring occurring on the underside of the weld. For gauges of the order of 2.5 mm, this is difficult to achieve with the GMAW process. It does appear easier to control depth of fusion oflaser welds than GMA welds.
b) 0wire = 1.2 mm Plaser= 2900 W Vwire= 4.8m.min.1 Vlaser= 3.9m.min.l Ldef= -1.3 mm ~ ~ ~
Figure 7: Optimised welding parameters and weld cross-sections for: a) tee joint, b) lap joint.
I i I!!!!
Fig. 8 presents the hardness mapping in the two cross-sections of the optimised welds. The HAZ sizes are equivalent in both configurations. The HAZ size of tee joint is about 1.3 mm around the weld while the lap joint one is about 1.3 mm in the tube and 1.8 mm in the sheet. The isotherms of the tee weld are more uniform than in the case of the lap joint. The non-uniformity of the isotherms in the latter case is probably due to intermittent contact between the plate and the extrusion. The incomplete contact creates a
thermal barrier causing more heat to enter the plate. Normally, the HAZ size of tee joint must be higher than the one of the lap joint. The linear energy input of the tee weld (68.1 J.mm.l) is indeed 50% higher than the one of the lap welding (44.6 J.mm.I). This phenomenon can be explained by the higher cooling flow of the tee set-up. This balances the higher energy input involved and leads to the similar HAZ sizes of the two welds.
5000
0 I , , ,I .1000
0 2000 4000 6000 8000 0 2000 4000
XAxis(flm) XAxis(flm)
Figure 8: Hardness mapping for: a) Tee joint configuration, b) lap joint configuration. Welds were obtained with the optimised welding parameters.
E 4000 3-.~ 3000 « >- 2000 1000
4. Conclusions
(i) The present work studied the influence of various
laser welding parameters such as power, out-of-focus length, welding speed and wire feeding speed on weld properties.
HAZ
Hardness (HV,,,) 70.00 85.00 100.0 115.0 130.0 6000(ii) Plates of AA6061 were welded in tee configuration using a cw/Nd:YAG laser and AA5356 wire as the filler metal. The same set-up and wire feeding were used for the lap joining of extruded square hollow tubes and plates of AA6061.
HAZ
Hardness (HV0"") 6000 r-- 40.00 5000 55.00 4000 70.00 E 85.00 3-3000., 'x 100.0 « 2000 >-115.0 1000 130.0I I I I I
I
II
I
(iii) This study used a combination of Taguchi and EM designs-of-experiment in order to defme the feasibility domain, explore efficiently the multidimensional volume and to optimise the welding processes.
(iv) For the two joint configurations, weld size is
correctly predicted by the laser power and the welding speed, i.e. the linear energy input. Moreover, for each couple power - welding
speed, it exists a single value of the wire feeding speed, which can lead to a correct weld. Similarly, the laser power and the wire feeding speed can predict the penetration depth of tee and lap joints.
(v) The welding speed oflap joining is about 2 times
higher than one observed for tee joining. Nevertheless, the HAZ sizes are similar in both configurations.
(vi) Laser welding of intermediate gauges of aluminium can achieve good depth of fusion with minimal risk of melt-through, especially for a tubular section, in contrast to GMA welding.
I I
I
I I I I5. Acknowledgements
The author thanks D. Rasmussen, M. Larouche and F. O. Gagnon for laser welding, A. Boily and H. Gregoire for metallography and hardness measurements and B. Altshuller for his assistance.
6. References
[I] G. Casalino, L. A. C. De Filippis, A. D. Ludovico, On CO2 laser welding of A12024-T3 and Al8090-T3 aluminium alloys butt joints, in: 20th International Congress on Applications of Lasers and Electro-Optics, Jacksonville, FL (2001) Vol. LMP [2] C. Mayer, F. Fouquet, M. Robin, Materials Science Forum, (1996) pp. 217-222.
[3] M. Kutsuna, Q. Yan, Welding International, 13 (1999) pp. 597-611.
[4] M. Pastor, H. Zhao, T. Debroy, Welding International, 15 (2001) pp. 275-281.
[5] A. Haboudou, P. Peyre, A. B. Vannes, G. Peix, Materials Science and Engineering A, 363 (2003) pp. 40-52.
[6] Y. S. Tarng, W. H. Yang, International Journal of Advanced Manufacturing Technology, 14 (1998) pp. 549-554.
[7] K. A. Kloss, Use of design of experiments in welding applications, in: Advances in Welding Technology, 11th Annual North American Welding Research Conference, Columbus OH 7-9 Nov 1995 (1996) Vol. 389-409,
[8] S. Subramaniam, D. R. White, J. E. Jones, D. W. Lyons, Welding Journal, 78 (1999) pp. 166-172. [9] M. Galopin, T. M. Dao, J. P. Boillot, The EM-2000 welding modelling system, in: 4th International Conference of Computer Technology in Welding, Cambridge, UK 3-4 June (1992) Vol. 1 28, [10] M. Galopin, S. Hansquine, T. M. Dao, C. Q. Zheng, Optimisation and variation reduction in welding - the EM method, in: High-Productivity Joining Processes, International Conference
Advances in Welding Technology, Columbus 17-19 Sept. (1997) Vol. 1
[11] M. Galopin, J. P. Boillot, G. Begin, Arc welding procedure optimisation, in: Recent Trends in Welding Science and Technology, Gatlinburg, TN 14-18 May (1989) Vol.
[12] L. Dubourg, B. Des Roches, A. Couture, D. Bouchard, H. R. Shakeri, Optimization of aluminium laser welding using Tagushi and EM methods, in: 23rd International Congress on Applications of Lasers and Electro-Optics, San-Francisco, CA, USA Oct. 4-7 (2004) Vol. LMP