Publisher’s version / Version de l'éditeur:
Analytical Chemistry, 80, 14, pp. 5487-5493, 2008-07-15
READ THESE TERMS AND CONDITIONS CAREFULLY BEFORE USING THIS WEBSITE. https://nrc-publications.canada.ca/eng/copyright
Vous avez des questions? Nous pouvons vous aider. Pour communiquer directement avec un auteur, consultez la première page de la revue dans laquelle son article a été publié afin de trouver ses coordonnées. Si vous n’arrivez pas à les repérer, communiquez avec nous à PublicationsArchive-ArchivesPublications@nrc-cnrc.gc.ca.
Questions? Contact the NRC Publications Archive team at
PublicationsArchive-ArchivesPublications@nrc-cnrc.gc.ca. If you wish to email the authors directly, please see the first page of the publication for their contact information.
NRC Publications Archive
Archives des publications du CNRC
This publication could be one of several versions: author’s original, accepted manuscript or the publisher’s version. / La version de cette publication peut être l’une des suivantes : la version prépublication de l’auteur, la version acceptée du manuscrit ou la version de l’éditeur.
For the publisher’s version, please access the DOI link below./ Pour consulter la version de l’éditeur, utilisez le lien DOI ci-dessous.
https://doi.org/10.1021/ac8004555
Access and use of this website and the material on it are subject to the Terms and Conditions set forth at
Assessment of cytotoxicity of quantum dots and gold nanoparticles
using cell-based impedance spectroscopy
Male, Keith B.; Lachance, Bernard; Hrapovic, Sabahudin; Sunahara, Geoff;
Luong, John H. T.
https://publications-cnrc.canada.ca/fra/droits
L’accès à ce site Web et l’utilisation de son contenu sont assujettis aux conditions présentées dans le site LISEZ CES CONDITIONS ATTENTIVEMENT AVANT D’UTILISER CE SITE WEB.
NRC Publications Record / Notice d'Archives des publications de CNRC:
https://nrc-publications.canada.ca/eng/view/object/?id=303a61af-9cba-4081-89b6-45afcdf3ee52
https://publications-cnrc.canada.ca/fra/voir/objet/?id=303a61af-9cba-4081-89b6-45afcdf3ee52
Assessment of Cytotoxicity of Quantum Dots and
Gold Nanoparticles Using Cell-Based Impedance
Spectroscopy
Keith B. Male,†Bernard Lachance,†Sabahudin Hrapovic,†Geoff Sunahara,†and John H.T. Luong*,†,‡
Biotechnology Research Institute, National Research Council Canada, Montreal, Quebec, Canada H4P 2R2, and Department of Chemistry, University College Cork, Cork, Ireland
A continuous online technique based on electric cell-substrate impedance sensing (ECIS) was demonstrated for measuring the concentration and time response func-tion of fibroblastic V79 cells exposed to nanomaterials such as quantum dots (QDs) and fluorescent gold nano-particles. The half-inhibition concentration, (ECIS50), the
required concentration to attain 50% inhibition of the cytotoxic response, was estimated from the response function to ascertain cytotoxicity during the course of measurement. The ECIS50 values agreed well with the
results obtained using the standard neutral red assay. Cadmium selenide quantum dots showed direct cytoxicity with the ECIS assay. For the cadmium telluride quantum dots, significant toxicity could be assigned to free cad-mium, although additional toxicity could be attributed to the QDs per se. The QDs synthesized with indium gallium phosphide and the fluorescent gold nanoparticles were not cytotoxic.
Considerable research has focused on the development and application of fluorescent semiconductor nanoparticles or quantum dots (QDs) with diameters ranging from 2 to 200 nm.1QDs consist
of a metalloid nanocore and a cap/shell that shields the core and renders the QD bioavailable. The core consists of a variety of metal complexes such as semiconductors, noble metals, and magnetic transition metals. QDs have often been prepared from indium phosphide (InP), indium arsenide (InAs), gallium arsenide (GaAs), gallium nitride (GaN), zinc sulfide (ZnS), zinc selenide (ZnSe), cadmium selenide (CdSe), and cadmium telluride (CdTe) cores.2
The further addition of biocompatible coatings or surface functional groups can give the QD a desired bioactivity.
The energy of the excited state of such novel fluorophores depends upon the material and decreases as the particle size increases. One of the interesting optical properties of the QDs is their absorption at all wavelengths shorter than the absorption onset. Thus, only a single light source is needed to excite a wide range of particle
sizes, leading to the development of practical multiplex assays. The emission spectrum of uniform QDs is about 2-fold narrower than typical fluorophores, without the long-wavelength tail common to most conventional dyes. Fluorescent QDs can be conjugated with bioactive receptors to target specific biologic events and cellular structures, such as labeling neoplastic cells.3 Quantum dots are
anticipated to improve the speed, accuracy, and affordability of clinical diagnostic tests and deliver a specific amount of a drug to a certain type of cell.4QDs can also be used to label specific proteins, genes,
and biomolecules to visualize such individual molecules or, like the older labeling techniques, to visualize every molecule of a given type. This technology should allow a rapid analysis and examination of thousands of genes and proteins from clinical samples. In vivo biomedical imaging is another potential application of QDs.3a,5
Hydrophobic QDs must be functionalized to attain a desired bioactivity. However, QDs can be cytotoxic under some conditions, thus their potential application for cell labeling and drug targeting should be addressed. Plausible routes of QD exposure are environ-mental, workplace, and therapeutic or diagnostic administration. QDs < 2.5 nm can penetrate in the lung and interact with the alveolar epithelium, whereas larger aerosolized QDs often deposit in bronchial spaces.6 Cadmium and selenium, two of the most widely used
constituent metals in QD core metalloid complexes, cause acute and chronic toxicities in vertebrates and are of considerable human health and environmental concern.7Different methods are used to make
the QDs nontoxic by coating their surface with biocompatible molecules. For instance, QD cores can be coated with poly(ethylene
* To whom correspondence should be addressed.
†National Research Council Canada. ‡
University College Cork.
(1) Bruchez, M., Jr.; Moronne, M.; Gin, P.; Weiss, S.; Alivisatos, A. P. Science
1998, 281, 2013–2016.
(2) (a) Dabbousi, B. O.; Rodriguez-Viejo, J.; Mikulec, F. V.; Heine, J. R.; Mattoussi, H.; Ober, R. J. Phys. Chem. B 1997, 101, 9463–9475. (b) Hines, M. A.; Guyot- Sionnest, P. J. Phys. Chem. 1996, 100, 468–471.
(3) (a) Gao, X.; Cui, Y.; Levenson, R. M.; Chung, L. W.; Nie, S. Nat. Biotechnol.
2004, 22, 969–976. (b) Wu, X.; Liu, H.; Liu, J.; Haley, K. N.; Treadway,
J. A.; Larson, J. P. Nat. Biotechnol. 2003, 21, 41–46.
(4) (a) Rudge, S. R.; Kurtz, T. L.; Vessely, C. R.; Catterall, L. G.; Williamson, D. L. Biomaterials 2000, 21, 1411–1420. (b) Scherer, F.; Anton, M.; Schillinger, U.; Henke, J.; Bergemann, C.; Kru¨ger, A. Gene Ther. 2001, 9, 102–109. (c) Yu, S.; Chow, G. J. Mater. Chem. 2005, 14, 2781–2786.
(5) (a) Alivisatos, A. P. Nat. Biotechnol. 2004, 22, 47–52. (b) Michalet, X.; Pinaud, F. F.; Bentolila, L. A.; Tsay, J. M.; Doose, S.; Li, J. J. Science 2005, 307, 538–544. (c) Roco, M. C. Curr. Opin. Biotechnol.2003, 14, 337–346.
(6) Oberdo¨rster, G.; Oberdo¨rster, E.; Oberdo¨rster, J. Environ. Health Perspect.
2005, 113, 823–839.
(7) (a) Fan, T. W.; Teh, S. J.; Hinton, D. E.; Higashi, R. M. Aquat. Toxicol.
2002, 57, 65–84. (b) Hamilton, S. J. Sci. Total Environ. 2004, 326, 1–31.
(c) Henson, M. C.; Chedrese, P. J. Exp. Biol. Med. (Maywood, NJ U.S.)
2004, 229, 383–392. (d) Kondoh, M.; Araragi, S.; Sato, K.; Higashimoto,
M.; Takiguchi, M.; Sato, M. Toxicology 2002, 170, 111–117. (e) Poliandri, A. H.; Cabilla, J. P.; Velardez, M. O.; Bodo, C. C.; Duvilanski, B. H. Toxicol. Appl. Pharmacol.2003, 190, 17–24. (f) Satarug, S.; Moore, M. R. Environ.
Health Perspect.2004, 112, 1099–1103. (g) Spallholz, J. E.; Hoffman, D. J.
Aquat. Toxicol.2002, 57, 27–37.
Anal. Chem. 2008, 80, 5487–5493
10.1021/ac8004555 CCC: $40.752008 American Chemical Society Analytical Chemistry, Vol. 80, No. 14, July 15, 2008 5487
Downloaded by CANADA INSTITUTE FOR STI on September 29, 2009 | http://pubs.acs.org
glycol) (PEG) groups to render QDs biocompatible and can be conjugated with bioactive moieties to target specific biologic events or cellular structural features. However, the coating layer or functional groups per se can also be cytotoxic but their in vivo effect and metabolism are not well understood.
Each individual type of QD possesses its own unique physico-chemical properties, which in turn determines its potential toxicity/ nontoxicity. The QD toxicity can be attributed to QD physicochemical properties and environmental conditions. QD size, charge, concentra-tion, outer coating bioactivity (capping material or functional groups), oxidative, photolytic, and mechanical stability have each been shown to be determining factors in QD toxicity.8 Given the potential
applications offered by QD technology, toxicologic information of QDs should be established to ensure that this technology will be developed and commercialized with respect to the protection of human health and environmental integrity.
This paper describes an online technique based on electric cell-substrate impedance sensing (ECIS) for the continuous assessment of the behavior of fibroblastic V79 cells exposed to quantum dots and gold nanoparticles. ECIS uses a circular gold electrode (250 µm in diameter) that is microfabricated on the bottom of tissue culture wells and immersed in a culture medium. Inoculated cells drift downward and attach to the electrode surface, precoated with a suitable protein, to form a confluent layer. The attached and spread V79 cells act as insulating particles because of their plasma mem-brane to interfere with the free space immediately above the electrode for current flow. Thus, there will be a drastic change in the measured impedance due to cell attachment and spreading. Exposure of V79 cells to nanomaterials, if toxic, will lead to alterations in cell behavior, and the resulting chemical cytotoxicity can be screened by measuring the impedance change.
EXPERIMENTAL SECTION
Materials. Neutral red (NR), 2-[N-morpholino]ethanesulfonic
acid (MES), fibronectin (bovine plasma, purity >99%), gold(III) chloride trihydrate, sodium borohydride (SBH), sodium tellurite, and atomic absorption standards of selenium, gallium, and indium were purchased from Sigma-Aldrich (St. Louis, MO). Cadmium chloride hemipentahydrate (Fluka) was purchased via Sigma-Aldrich and used to prepare a cadmium stock (10 g/L) solution. High-purity nitric acid (environmental grade plus) was obtained from Anachemia (Montreal, PQ, Canada). Chinese hamster lung fibroblast V79 cells (93-CCL) were obtained from American type Tissue Collection (ATCC, Rock-ville, MD). Cadmium telluride quantum dots (3-4 nm) were provided by Northern Nanotechnologies, NNT, (Toronto, ON, Canada). Three different models were tested: green (5.5 mg/mL), yellow (16 mg/ mL), and orange (16 mg/mL) quantum dot with fluorescent emis-sions of 538, 560, and 627 nm, respectively. The quantum dots were protected by CdS shells of different thicknesses. Three different types of T2-MP EviTag quantum dots (Evident Technologies, Troy, NY) were chosen as testing models: maple red orange (25 nm hydrody-namic diameter, cadmium selenide core, 5.2 nm, 11 µM, MW ) 200 µg/nmol based on core material) with a fluorescent emission of 620 nm, adirondack green (25 nm hydrodynamic diameter, cadmium selenide core, 2.1 nm, 12 µM, MW ) 10 µg/nmol based on core material) with a fluorescent emission of 520 nm, and macoun red (25 nm hydrodynamic diameter, indium gallium phosphide core, 8
µM) with a fluorescent emission of 650 nm. T2-MP Evitags contain a zinc sulfide shell and a poly(ethylene glycol) lipid coating with a nonfunctionalized surface. Fluorescent gold nanoparticles (5-6 nm) with a fluorescent emission of 496 nm (excitation 470 nm) were synthesized by the reduction of 1.5 mM gold(III) chloride trihydrate by SBH (7.5 mM) in the presence of 3.0 mM mono-6-deoxy-6-pyridium-β-cyclodextrin chloride (p-β-CD) as described by Male et al.9The p-β-CD was prepared by refluxing mono-6-(p-toluene
sulfo-nyl)-β-cyclodextrin with pyridine in DMF at 90°C for 2 days followed by ion-exchange chromatography by the method of Muderawan et al.10Fluorescence spectra were measured with a Gilford Fluoro IV
spectrofluorometer (Gilford, Oberlin, OH) with a detector photo-multiplier tube (PMT) voltage set in the range of 500-600 V. Optimization was carried out by performing both excitation and emission scans, and samples were diluted 100-1000 times.
Cell Culture and Neutral Red Cytotoxicity Assay. A Petri
dish inoculated with ∼5×10⁵V79 cells was incubated in a humidified
incubator at 37°C containing 5% CO2for pH control. The Dulbecco’s
modified Eagle’s medium (DMEM; Gibco BRL, Grand Island, NY) for the cell culture was supplemented with 5% fetal bovine serum (FBS, Sigma-Aldrich). After 48 h, cell suspensions were prepared using 0.05% (v/v) trypsin, and cell viability was assessed using the trypan blue exclusion technique. The cell population in the suspen-sion was counted for estimating the cellular growth rate. The neutral red (NR) assay was carried out as described by Borenfreund and Puerner11with some modifications. The NR stock solution (20 mg/
mL) was prepared in dimethyl sulfoxide (Sigma-Aldrich). The NR working solution (50 µg/mL) was prepared by dilution of the stock solution in 10 mM HEPES-buffered DMEM, 3% FBS, pH 7.2. Benzalkonium chloride was used as a reference toxicant in the NR assay.
Electrode Coating and Cell Inoculation. Fibronectin (0.15
mL, 0.1 mg/mL, prepared in 0.85% NaCl) was added into each of the eight wells of a sensing chip (8W1E, Applied Biophysics, Troy, NY) to coat the detecting gold electrodes. After protein adsorption (∼60 min), the wells were washed three times with 0.85% NaCl and then 0.3 mL of culture medium was placed in each well, and the impedance baseline was monitored for 1-2 h at 37°C in a humidified chamber of 5% CO2and 95% air with the ECIS impedance system
(Applied Biophysics, Troy, NY). The wells were then emptied, and 0.3 mL of cell suspension (∼106cells/mL) was inoculated into each
well. A mixture of penicillin and streptomycin (1% v/v, Sigma-Aldrich) was added to the cell suspension just before addition to the ECIS system to prevent microbial contamination. QD or gold nanoparticle solutions (5-20 µL) were added to cell suspensions (1 mL at 106
cells/mL) at various concentrations before adding to the wells to test for possible cytoxicity effects.
Impedance Measurement with ECIS. The sensing chip
consists of eight detecting gold electrodes (∼250 µm diameter), microfabricated on the bottom of eight separate wells (volume of ∼9×9×10 mm3). A common counter gold electrode is shared by the detecting electrodes, and all electrodes are linked with a pad at the edge of the chip. The two electrodes of the well are connected to a lock-in amplifier of the ECIS system, and 1 V alternating current
(8) Hardman, R. Environ. Health Perspect. 2006, 114, 165–172.
(9) Male, K. B.; Li, J.; Ching, C.-B.; Ng, S-C.; Luong, J. H. T. J. Phys. Chem. C
2008, 112, 443–451.
(10) Muderawan, W.; Ong, T.-T.; Tang, W.-H.; Young, D. J.; Ching, C.-B.; Ng, S.-C. Tetrahedron Lett. 2005, 46, 1747–1749.
(11) Borenfreund, E.; Puerner, J. A. J. Tissue Cult. Methods 1984, 9, 7–9. 5488 Analytical Chemistry, Vol. 80, No. 14, July 15, 2008
Downloaded by CANADA INSTITUTE FOR STI on September 29, 2009 | http://pubs.acs.org
(ac) is applied through a 1 MΩ resistor. Cells would not be affected by the applied potential at this operating condition. The impedance of each well was measured every 2 min at 4 kHz, and data acquisition and processing were performed using the Applied Biophysics software. The system acquires resistance, impedance, and capaci-tance data; however, as larger changes occurred in the resiscapaci-tance, we have focused on these changes in this study. The cytotoxicity half-inhibition concentration or ECIS50 of the ECIS system was
calculated by the method of Xiao et al.12This value was derived from
the time response function, f(C, t), and by measuring the percentage inhibition as a function of the inhibitor concentration. Data points at 30 min intervals were selected from the raw resistance data collected to simplify calculations and plots. For the observation of the cell behavior on the surface of the gold electrodes, the sensing chip could be temporarily removed (pause function from the software) from the ECIS system incubator and placed on a Wilovert AFL 30 inverted fluorescence microscope (excitation range 355-470 nm, dichroic mirror 510 nm, suppression filter 520 nm, Hund, Germany) enhanced with a digital video camera (KP-D50U, Hitachi, Tokyo, Japan).
Cadmium Ion Detection by Fluorescence and Electro-chemistry. Cd2+was detected by a fluorescence assay (excitation
495 nm, emission 516 nm) using the Measure-iT Lead and Cadmium Assay Kit (Molecular Probes, Eugene, OR) with a linearity between 5-200 nM. Quantum dots were diluted up to 10 000-fold to avoid interference with the measurement. This assay kit is not specific for cadmium, and according to the specifications will experience interfer-ence from other metal ions such as calcium, zinc, nickel, chromium, copper, lead, mercury, and barium, depending on the concentration. The assay kit was also tested with respect to tellerite, selenium, indium, and gallium which are also present in the quantum dot structures. Alternatively, Cd2+was detected electrochemically (CHI
601A, CHI Instruments, Austin, TX) using square-wave anodic stripping voltammetry by the method of Babyak and Smart13with
slight modifications. The working electrode was a boron doped diamond (BDD) microdisc array (MDA) (BDD-SensSys, Adamant Technologies, La Chaux-de-Fonds, Switzerland). The BDD-SensSys consisting of 473 BDD microelectrodes (5 µm, diameter), an Ag/ AgCl reference electrode, and a stainless steel counter electrode was placed in an electrochemical cell (10 mL working volume, 50 mM MES buffer, pH 6.0). Cd2+solution was reduced (-1.2 V, 120 or
600 s deposition) to Cd0resulting in its preconcentration on the
working electrode followed by its reoxidation back to Cd2+ by
sweeping the applied potential toward more positive values (-1.2 V to 0.0 V, pulse height 25 mV, frequency 15 Hz, and scan increment 4 mV). Cd0reoxidation results in a peak shaped current response at
-0.85 V, proportional to Cd2+concentration. Between each run, the electrode was regenerated by maintaining the electrode at 1.2 V for 1 min to ensure complete oxidation of Cd0. Other metal ions were
also tested for possible interference.
ICPMS Determination. Analysis of 17 elements (Al, Sb, As,
Ba, Cd, Ca, Cr, Co, Cu, Pb, Mn, Mo, Ni, Se, Ag, Na, and Zn) was also performed using an X Series 2 ICPMS system (Thermo Electron Corp., Winsford, U.K.) using the procedure recommended by the manufacturer (Application Note 40741).14The samples were first
digested for 2-3 h using concentrated high purity nitric acid and
further diluted to 1 M nitric acid for analysis. These samples were also used for electrochemical analysis of total cadmium.
RESULTS AND DISCUSSION
Response of V79 Cells to Cadmium. The gold electrode can
be completely covered by fibronectin, a protein that strongly binds to cell surface protein integrins.15The fibroblast cells can firmly
attach to the fibronectin-coated gold electrode since integrin mol-ecules connect with the cytoskeleton. The resistance of the culture medium without cells was ∼1800-1900 Ω. Without toxicant, the cells descended to the bottom of the well within 30-60 min as observed by the video-enhanced microscope, and as they spread, the cells changed from round shapes to flattened forms with much larger dimensions. Cell-substratum interactions including spreading, mor-phology, and cell motility require a complex series of events to occur in a regulated and integrated fashion. As the cells spread, they alter the effective area available for current flow, causing a significant increase in the resistance of the well by ∼3900-5700 Ω as shown in Figure 1A (curve a). The minimum number of normal V79 cells to completely cover an 8W1E detecting electrode coated with fibronec-tin was reported to be 93, and the estimated resistance change contributed by each attached cell was 41.5 Ω.16Therefore, the value
of 3900 Ω was in agreement with previous reports. Addition of low concentrations (<3 µM) of cadmium (Figure 1A, curve b) to the cell suspension resulted in an increase (∼7500 Ω) in the initial resistance. However, after about 8 h, the resistance was similar to the wells with only the cells and the profiles remaining the same for the subsequent 12 h. The resistance overshoot (compared to the control) has been previously reported with 5×10⁴cells/mL, an interesting
phenom-enon of cadmium cytotoxicity using the ECIS assay. Such behavior was not observed with sodium arsenate, benzalkonium chloride, mercury chloride, or 1,3,5-trinitrobenzene.12,16Above 4.5 µM
cad-mium (Figure 1A, curves c-g), the initial resistance overshoot was also observed, but as time progressed the resistance decreased sharply and became lower than the wells with only cells. As observed by the video-enhanced microscope at this point in time, the wells contained only dead cells (small round spots) and upon washing the wells there were no adherent cells observed on the electrode surfaces.
Half-Inhibition Concentration (ECIS50) for Cadmium Ion.
For the effector cells, the resistance change (∆Rs) of the well is
dependent on the number (No) of initial cells attached on the
detecting electrode, the toxicant concentration (C), and the exposure time (t) as reported by Xiao et al.12The resistance change normalized
by Nois defined as the cell response to the toxicant measured by
ECIS, f (C, t) ) ∆Rs/No. As a control with no toxicant, C is equal to
zero and f(0,t) increases as the cells spread on the electrode and reach a plateau. In the presence of toxicant, f (C, t) after an initial increase, the value decreases and even approaches zero, indicating total cell death at high toxicant concentrations. The inhibitor concentration required to achieve 50% inhibition of the cytotoxicity response is defined as the half-inhibition concentration or f (ECIS50,
t)/f (0, t) ) 50%.
(12) Xiao, C.; Lachance, B.; Sunahara, G.; Luong, J. H. T. Anal. Chem. 2002, 74, 5748–5753.
(13) Babyak, C.; Smart, R. B. Electroanalysis 2004, 16, 175–182.
(14) Nash, M.; McSheehy, S. Speciation of Arsenic in Fish Tissues Using HPLC Coupled with XSeriesII ICP-MS. Thermo Electron Corporation, Application Note 40741, Winsford, U.K.
(15) Xiao, C.; Lachance, B.; Sunahara, G.; Luong, J. H. T. Anal. Chem. 2002, 74, 1333–1339.
(16) Xiao, C.; Luong, J. H. T. Biotechnol. Prog. 2003, 19, 1000–1005.
Analytical Chemistry, Vol. 80, No. 14, July 15, 2008
Downloaded by CANADA INSTITUTE FOR STI on September 29, 2009 | http://pubs.acs.org
The ECIS50 for cadmium ion was calculated from the data
obtained in Figure 1A. Data points were not considered (i.e., 3 µM cadmium) whenever the resistance value was greater than those observed for the control without cadmium. The time response function f(C, t) was used to construct a series of inhibition curves at any given time t0(>5 h) for the series of cadmium concentrations
(>4.5 µM) used in Figure 1A. The cell concentration in these experiments was much higher than in the previous study (106vs 5
×104).12Thus, confluence on the electrode surface occurred very
rapidly, such that Nofor each well was assumed to be equivalent;
therefore, ∆Rsdid not have to be adjusted due to different Novalues.
The time response function, f(C, t), was then normalized to 1 by simply taking the ∆Rs, i.e., Rt - R0 at different cadmium ion
concentrations and dividing the values by the ∆Rsat f(0, t). The
normalized time response function decreased as expected as the concentration of cadmium ion (>4.5 µM) increased for all exposure times considered (Figure 1B). The ECIS50 for cadmium ion was
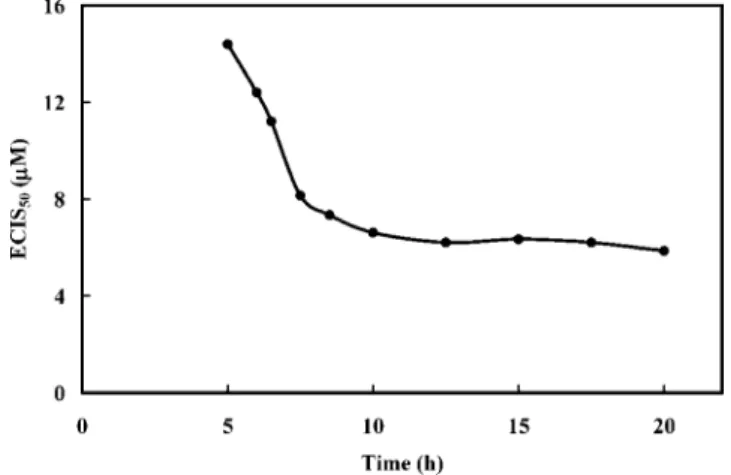
determined for each exposure time by extrapolating the value on the cadmium concentration axis when the normalized time response function was 0.5. Figure 2 shows the relationship between the half-inhibition concentration and exposure time, indicating that the ECIS50
for cadmium ion plateaued at ∼6.3 µM after an exposure time of
10 h. These results were consistent with the value of 3.9 µM reported for CdCl2at a cell concentration of 5×10⁴cells/mL by Xiao et al.12
The ECIS50value was likely dependent upon the cell concentration
resulting in a lower value at lower cell levels. In addition, in the previous study the ECIS50value is more a reflection of the inhibition
of cell growth in the presence of cadmium since the cell concentration was much lower and the cells did not completely cover the electrode surface before the inhibitor came into effect. In our study, because of the rapid formation of cell confluence on the surface at high cell concentration, the ECIS50 value was more a reflection of the
delaminating process as the cells were killed due to the inhibitor. At a cell concentration of 5×10⁴cells/mL, the EC
50for cadmium using
the neutral red assay11was 1.84±
0.33 µM (n ) 7), comparable with the previous report of 3.0±0.4 µM.12
Response of V79 Cells to Other Metals. Similar experiments
were conducted using selenium, tellerium, indium, gallium, and zinc in place of cadmium, since these metals were also part of the QD structures. Selenium, indium, and gallium were found to be noncy-totoxic with respect to V79 cells (106cells/mL) up to concentrations
of 190, 130, and 213 µM, respectively. The ECIS50for Na2O3Te and
ZnSO4were determined to be 98 and 140 µM, respectively (data not
shown), considerably higher than that of cadmium (6.3 µM). The resistance overshoot observed with cadmium was also observed for tellerium but not zinc.
Response of V79 Cells to CdTe Quantum Dots. The CdTe
Quantum dots contained a significant amount of cadmium ion as determined by the fluorescence Measure-iT Lead and Cadmium Assay Kit or by electrochemistry. The green, yellow, and orange QDs contained 3.3, 10.7, and 0.88 mM cadmium, respectively, using the fluorescence assay. In comparison to an equal concentration of cadmium, the fluorescent signal observed for selenium, indium, gallium, calcium, or telluride was <2%, while that of zinc was 20%. Therefore, the signal was due mainly to cadmium as the levels of these other metals would not be significant enough to interfere. The free cadmium contamination of the orange QDs was likely lower since these QDs were protected by the thickest CdS coating over the CdTe core. The cadmium leakage from the green and yellow QDs was expected to be higher. This fact was confirmed by ICPMS analysis which indicated levels of 4.48, 21.5, and 25.8 mM of total
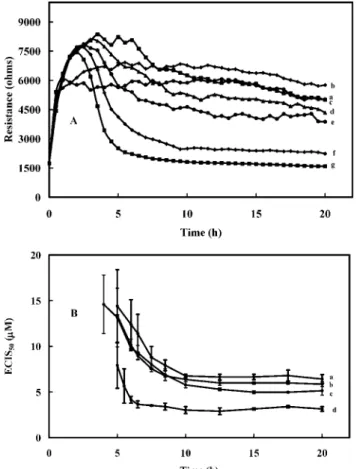
Figure 1.(A) Resistance response (Ω) of fibroblastic V79 cells to various concentrations (µM) of cadmium ion: (a) 0, (b) 3.0, (c) 4.5, (d) 6, (e) 7.5 (f) 9.0, and (g) 15. (B) Cadmium ion inhibition curves were obtained for each cadmium ion concentration (Figure 1A, curves a-g) at various exposure times: (a) 5, (b) 6.5, (c) 7.5, (d) 8.5, (e) 10, (f) 15, and (g) 20. The normalized time response function (y axis),
f(C, t), was determined by taking the ∆Rs(Figure 1A, curves b-g),
i.e., Rt- R0at different cadmium ion concentrations and dividing the
values by the ∆Rs(∼3900 Ω, Figure 1A, curve a) at f(0, t).
Figure 2. Relationship between the half-inhibition concentration (ECIS50) and exposure time during cell culture for cadmium ion. The
cadmium ECIS50 value was determined for each exposure time
(Figure 1B, curves a-g) by extrapolating the value for the x axis from the y axis (0.5).
5490 Analytical Chemistry, Vol. 80, No. 14, July 15, 2008
Downloaded by CANADA INSTITUTE FOR STI on September 29, 2009 | http://pubs.acs.org
cadmium for the green, yellow, and orange QDs, respectively. Thus, the free cadmium content represented 74, 50, and 3% for the green, yellow, and orange QDs, respectively. The total cadmium concentra-tion for the green QDs was lower since the stock soluconcentra-tion had a much lower concentration of QDs (5.5 mg/mL) compared to the yellow or orange (16 mg/mL). With the exception of sodium (38, 143, and 147 mM) and calcium (0.48, 0, 1.12 mM), no other elements were detected in significant quantities by ICPMS analysis for the green, yellow, and orange QDs. Cadmium ion was also detected at -0.85 V by stripping voltammetry (Figure 3), and the reproducibility of the signal for 22 µM was±6% (95% confidence interval, n ) 4). With the use of peak height analysis, the electrochemical technique resulted in values of 3.5 and 10.6 mM for the green and yellow QDs, respectively, with a reproducibility of 9% (95% confidence interval, n ) 6). The orange QDs could not be resolved by the electrochemistry technique as the BBD electrode was severely fouled by this sample. The ICPMS digested samples resulted in total cadmium concentra-tions of 21.8±2.2 and 23.0±4.6 for the yellow and orange QDs using the electrochemical technique, very similar to the ICPMS results. Under the same operating conditions and concentrations, the electrochemical signals at -0.85 V for selenium, indium, gallium, tellerium, and zinc were <1% of that observed for cadmium, indicating the specificity of the cadmium peak at -0.85 V. However, a very broad signal was observed for tellerium at +0.53V.
Diluted QD samples were added to the dispersed cells (106cells/
mL), resulting in free cadmium concentrations similar to those used for the cadmium ion standard as described in Figure 1. With the use of the orange QDs, the overshoot due to the free cadmium ion was evident (Figure 4A). The inhibition was equivalent to 4.5 µM for the cadmium standard, but the free cadmium level was only ∼2.5 µM. Such a result indicated that the quantum dots per se exhibited cytotoxicity, and inverted fluorescence microscopy confirmed cell apoptosis. A plot for the ECIS50resulted in 3.2 µM free cadmium
equivalent instead of 6.3 µM (Figure 2) as would have been expected if the result was due to free cadmium only. Similar results were observed for the green and yellow QDs, although the toxic effect of the QDs per se was less evident compared to that observed with the orange QDs. The ECIS50values (n ) 3) were 5.1 and 6.0 µM for
the yellow and green QDs, respectively, compared to 6.7 µM for the
standard cadmium (Figure 4B). The higher free cadmium concentra-tions present in the green and yellow QDs likely mask the effect of the QDs per se. Attempts to remove the free cadmium ion from the QD samples were not successful.
A similar cytotoxicity pattern for CdTe QDs was observed using the neutral red assay.11 The EC
50 values (expressed from free
cadmium concentration) for the green, yellow, and orange QDs were 2.31, 1.70, and 1.0 µM, respectively, compared to 1.84±0.33 µM for Cd. Similar to the result obtained by the ECIS technique, cytoxicity of the orange QDs could not be explained based on the free cadmium concentration alone, as the EC50value was much lower than expected.
Cytoxicity of the green and yellow QDs was primarily a reflection of the free cadmium contamination of the samples. These results indicated that the orange sample was probably less cytotoxic due to the protection imparted by the CdZn shell, which would likely lower cadmium leakage from the CdTe core.
Response of V79 Cells to CdSe/ZnS and InGaP/ZnS Quantum Dots. Red CdSe/ZnS quantum dot samples were added
to the dispersed cells (106cells/mL), resulting in QD concentrations
in the range of 50-200 nM. The resistance overshoot previously observed for free cadmium was not apparent using these QDs (Figure 5A), indicating an absence of free cadmium in the sample. Cytotoxicity was observed at concentrations above 50 nM as the resistance began to drop immediately after about 3 h with the ECIS50 Figure 3.Cadmium ion detection by anodic stripping voltammetry:
(a) cadmium (22 µM), (b) yellow CdTe QDs (500× dilution), and (c) green CdTe QDs (167× dilution). Cadmium ion was deposited for 120 s at -1.2 V, followed by Cd0
stripping between -1.2 V and 0.0 V (pulse height 25 mV, frequency 15 Hz, and scan increment 4 mV).
Figure 4.(A) Resistance response (Ω) of fibroblastic V79 cells to various concentrations of orange CdTe QDs expressed as free cadmium ion concentration (µM): (a) 0, (b) 1.25, (c) 1.88, (d) 2.5, (e) 3.13, (f) 3.75, and (g) 7.5. (B) Relationship between the half-inhibition concentration and time, during cell culture for different toxicants: (a) cadmium ion, (b) CdTe green QDs, (c) CdTe yellow QDs, and (d) CdTe orange QDs. (Data expressed as 95% confidence interval, n ) 3)
Analytical Chemistry, Vol. 80, No. 14, July 15, 2008
Downloaded by CANADA INSTITUTE FOR STI on September 29, 2009 | http://pubs.acs.org
value of 154 nM or 30 µg/mL (n ) 2). The obtained result implied that the inhibition occurred after the quantum dots interacted with the cells rather than from free cadmium. Inverted fluorescence microscopy (Figure 5B3,B4) confirmed that the cells were dead at the end of the experiment. The QD effected cells were spherical in contrast to the well spread control cells (absence of QDs) observed in Figure 5B1,B2. Washing the ECIS wells with water removed the effected cells indicating that they were no longer attached to the fibronectin on the gold surface, whereas washing the wells of the control cells did not result in their removal. It should be noted that a similar pattern was observed microscopically when comparing cells with and without cadmium.
Green quantum dots up to 240 nM had very little effect on the V79 cells as observed by the ECIS experiment (figure not shown) as well as observation with the inverted fluorescence microscope. Structurally these quantum dots are similar to the red ones except that the CdSe core is smaller. Assuming that the toxic effect results eventually from the cadmium present in the dots, this result was not surprising since ICPMS results indicated that the total concentra-tion of cadmium in the sample of green dots was only 0.82 mM compared to 20.7 mM for the red dots. These values seem logical considering that the molecular weights of the two quantum dots differ also by 20-fold (10 µg/nmol compared to 200 µg/nmol). Therefore the smaller dots appear less toxic likely due to their lower cadmium
content. In addition, ICPMS data indicated lower levels of both Se (0.16 mM) and Zn (3.7 mM) for the green quantum dots compared to Se (8.1 mM) and Zn (16.7 mM) for the red quantum dots.
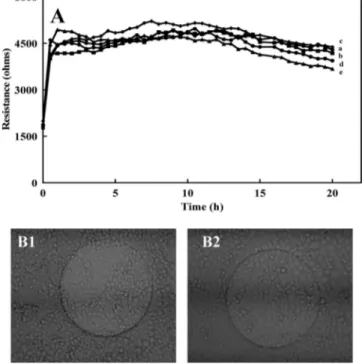
Indium gallium phosphide core QDs at concentrations as high as 200 nM had no significant cytotoxic effect (Figure 6A). These results support the claim by the manufacturer that the indium gallium phosphide QDs are much less toxic than the cadmium selenide core QDs. Inverted fluorescence microscopy (Figure 6B1,B2) indicated that the cells were still intact and adhered to the gold electrode surface after the experiment. Highly fluorescent and concentrated gold nanoparticles (5-6 nm) exhibited no cytotoxicity when they were added to the dispersed cells (106 cells/mL) up to 45 µM
equivalent to the gold salt concentration used in the synthesis (data not shown). Such a result was anticipated since both cyclodextrin and gold nanoparticles are not toxic to cells.9Inverted fluorescence
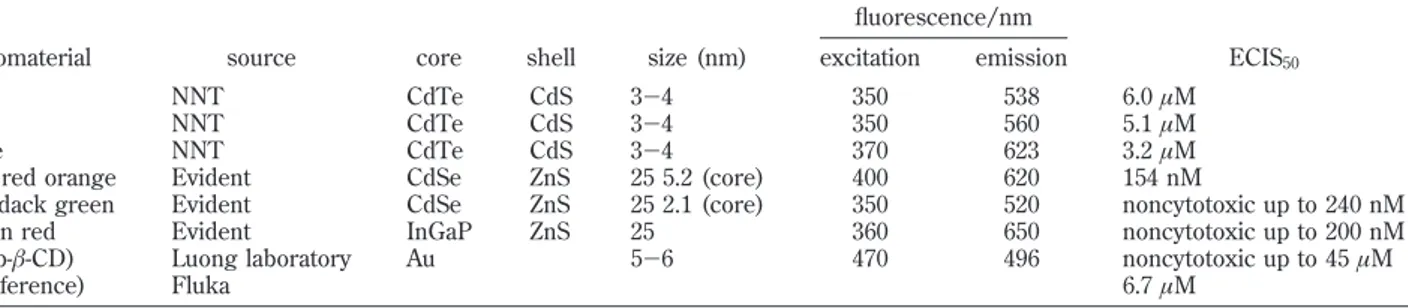
microscopy (figure not shown) confirmed that the cells were still intact and adhered to the gold electrode surface after the experiment. The cytotoxicity results and characteristics of the nanomaterials tested in this study are summarized in Table 1.
A direct comparison of our results with the literature data is very difficult even though in vitro studies suggest certain QD types might be cytotoxic. Uncoated CdTe QDs are cytotoxic at 10 µg/mL, and cell death can be characterized as chromatin condensation and membrane blebbing, symptomatic of apoptosis.17In such a report,
cytotoxicity of CdTe QDs was more pronounced with smaller positively charged QDs (2.2 ± 0.1 nm) than with larger equally charged QDs (5.2±0.1 nm) at equal concentrations (100 µg/mL). The difference in QD size also affected subcellular distribution, with smaller cationic QDs localizing to the nuclear compartment and
(17) Lovric, J.; Bazzi, H. S.; Cuie, Y.; Fortin, G. R. A.; Winnik, F. M.; Maysinger, D. J. Mol. Med. 2005, 83, 377–385.
Figure 5.(A) Resistance response (Ω) of fibroblastic V79 cells to various concentration of maple red orange CdSe core QDs (nM): (a) 0, (b) 83, (c) 138, (d) 165, (e) 193, and (f) 220. (B) Microscopic photos (taken at the end of the experiment, i.e., about 20 h into the experiment) of the electrode surface: (1) whole electrode at 0 nM QD, (2) electrode section at 0 nM QD, (3) whole electrode at 220 nM QD, (4) electrode section at 220 nM QD.
Figure 6.(A) Resistance response (Ω) of fibroblastic V79 cells to various concentrations of macoun red InGaP core QDs (nM): (a) 0, (b) 60, (c) 100, (d) 160, and (e) 200. (B) Microscopic photos of the electrode surface (taken at the end of the experiment, i.e., about 20 h into the experiment): (1) whole electrode at 0 nM QD, (2) whole electrode at 200 nM QD.
5492 Analytical Chemistry, Vol. 80, No. 14, July 15, 2008
Downloaded by CANADA INSTITUTE FOR STI on September 29, 2009 | http://pubs.acs.org
larger cationic QDs localizing to the cytosol. However, because of relatively unrestrained passage of nanoparticles up to 9 nm in diameter occurring through nuclear pores, the size of the QDs (2.2 and 5.2 nm) cannot be the only explanation for the entry of smaller QDs (2.2 nm) into the nucleus. Thus, cell apoptosis could be due to the presence of free Cd released from QD core degradation, free radical formation, or interaction of QDs with intracellular components, leading to loss of cellular function. CdSe/ZnS-MUA (mercapto undecanoic acid) QDs are cytotoxic at 100 µg/mL with respect to HeLa cells.18 CdSe/ZnS-SSA (sheep serum albumin) QDs were
reported to be cytotoxic, since the cell viability (EL-4 cells plated at 106cells/mL) decreased with increasing time (3-24 h) as the QD
concentration increased (100-400 µg/mL).19Almost all the cells
were dead at 400 µg/mL after 6 h of incubation. These values are similar to the ECIS50value (154 nM or 30 µg/mL) reported in this
study for CdSe/ZnS-PEG/lipid coated QDs.
Under oxidative and photolytic conditions, QD core-shell coat-ings can be labile, degrading and thus exposing potentially toxic “capping” material or intact core metalloid complexes or resulting in dissolution of the core complex to QD core metal components (e.g., Cd, Se). Thus, the question arises as to their in vivo/intracellular oxidative stability, and a few studies suggest the possibility of intracellular degradation upon administration of QDs to animals.3a,19,20
QD surface ligands and coatings are slowly degraded in vivo, leading to surface defects and fluorescence quenching.3aIn contrast, QDs
coated with a high-molecular-weight (100 kDa) copolymer and a grafted eight-carbon alkyl side chain show greater in vivo stability than those with simple polymer and amphiphilic lipid coatings. Similarly, the lack of genotoxicity of silica coated QDs could be
attributed to the prevention of the interaction of Cd, Se, Zn, and sulfur with proteins and DNA in the nucleus.21
The duration of exposure also plays an important role in the assessment of cytotoxicity. No cytotoxicity is noted for short-term acute exposures where cells are in contact with QDs for less than 6 h. There was no effect on cell growth when HeLa cells were exposed to 600 nM CdSe/ZnS-DHLA (dihydrolipoic acid) QDs for 60 min.22Similarly, CdSeZnS-MUA or CdSe/ZnS-SSA QDs at 400
µg/mL were reported to have no affect on the viability of Vero cells after 2 h.23In contrast, QD-induced cytotoxicity tends to be longer
in nature, with exposure times up to 24 h required as previously mentioned.17–19
In brief, we have described an online and continuous technique based on electric cell-substrate impedance sensing for measuring the concentration and time response function of fibroblastic V79 cells exposed to various nanoparticles including quantum dots and fluorescent gold nanoparticles. The half-inhibition concentration, the required concentration to achieve 50% inhibition, can be estimated from the response function to ascertain cytotoxicity during the course of the assay. Under certain conditions, QDs may pose environmental and human health risks as determined by in vitro cell cultures. However, the interpretation of QD toxicity or the mechanism of cell death is very difficult since QD cytotoxicity depends on QD size, charge, concentration, outer coating bioactivity, and oxidative, pho-tolytic, and mechanical stability. Nevertheless, functional coating and QD core stability will likely be the deciding factors in assessing the risk of QD toxicity. Because of the diversity of their synthesis, not all QDs are alike and QDs conjugated with biomolecules cannot be considered a uniform group of nanomaterials.
ACKNOWLEDGMENT
The authors thank Dr. Darren Anderson of Northern Nano-technologies, (Toronto, ON, Canada) for helpful discussions and CdTe quantum dot samples.
Received for review March 4, 2008. Accepted May 17, 2008.
AC8004555 (18) Shiohara, A.; Hoshino, A.; Hanaki, K.; Suzuki, K.; Yamamoto, K. Microbiol.
Immunol.2004, 48, 669–675.
(19) Hoshino, A.; Hanaki, K.; Suzuki, K.; Yamamoto, K. Biochem. Biophys. Res. Commun.2004, 314, 46–53.
(20) Akerman, M. E.; Chan, W. C. W.; Laakkonen, P.; Bhatia, S. N.; Ruoslahti, E. Proc. Natl. Acad. Sci. U.S.A. 2002, 99, 12617–12621.
(21) Chen, F. Q.; Gerion, D. Nano Lett. 2004, 4, 1827–1832.
(22) Jaiswal, J. K.; Mattoussi, H.; Mauro, J. M.; Simon, S. M. Nat. Biotechnol.
2003, 21, 47–51.
(23) Hanaki, K.-I.; Momo, A.; Oku, T.; Komoto, A.; Maenosono, S.; Yamaguchi, Y.; Yamamoto, K. Biochem. Biophys. Res. Commun. 2003, 302, 496–501.
Table 1. Cytotoxicity and Characteristics of Nanomaterials Studied
fluorescence/nm
nanomaterial source core shell size (nm) excitation emission ECIS50
green NNT CdTe CdS 3-4 350 538 6.0 µM
yellow NNT CdTe CdS 3-4 350 560 5.1 µM
orange NNT CdTe CdS 3-4 370 623 3.2 µM
maple red orange Evident CdSe ZnS 25 5.2 (core) 400 620 154 nM
adirondack green Evident CdSe ZnS 25 2.1 (core) 350 520 noncytotoxic up to 240 nM
macoun red Evident InGaP ZnS 25 360 650 noncytotoxic up to 200 nM
gold (p-β-CD) Luong laboratory Au 5-6 470 496 noncytotoxic up to 45 µM
Cd (reference) Fluka 6.7 µM
Analytical Chemistry, Vol. 80, No. 14, July 15, 2008
Downloaded by CANADA INSTITUTE FOR STI on September 29, 2009 | http://pubs.acs.org