Publisher’s version / Version de l'éditeur:
Vous avez des questions? Nous pouvons vous aider. Pour communiquer directement avec un auteur, consultez la première page de la revue dans laquelle son article a été publié afin de trouver ses coordonnées. Si vous n’arrivez pas à les repérer, communiquez avec nous à PublicationsArchive-ArchivesPublications@nrc-cnrc.gc.ca.
Questions? Contact the NRC Publications Archive team at
PublicationsArchive-ArchivesPublications@nrc-cnrc.gc.ca. If you wish to email the authors directly, please see the first page of the publication for their contact information.
https://publications-cnrc.canada.ca/fra/droits
L’accès à ce site Web et l’utilisation de son contenu sont assujettis aux conditions présentées dans le site LISEZ CES CONDITIONS ATTENTIVEMENT AVANT D’UTILISER CE SITE WEB.
10th International Conference for Enhanced Building Operation [Proceedings], pp.
1-12, 2010-10-26
READ THESE TERMS AND CONDITIONS CAREFULLY BEFORE USING THIS WEBSITE. https://nrc-publications.canada.ca/eng/copyright
NRC Publications Archive Record / Notice des Archives des publications du CNRC : https://nrc-publications.canada.ca/eng/view/object/?id=0c7b710b-0bb7-4f6b-9c75-d9b738e6aedc https://publications-cnrc.canada.ca/fra/voir/objet/?id=0c7b710b-0bb7-4f6b-9c75-d9b738e6aedc
NRC Publications Archive
Archives des publications du CNRC
This publication could be one of several versions: author’s original, accepted manuscript or the publisher’s version. / La version de cette publication peut être l’une des suivantes : la version prépublication de l’auteur, la version acceptée du manuscrit ou la version de l’éditeur.
Access and use of this website and the material on it are subject to the Terms and Conditions set forth at
Assessment of the energy rating of insulated wall assemblies - a step
towards building energy labeling
http://www.nrc-cnrc.gc.ca/irc
Asse ssm e nt of t he e ne rgy ra t ing of insula t e d w a ll a sse m blie s - a
st e p t ow a rds building e ne rgy la be ling
N R C C - 5 3 6 1 5
E l m a h d y , A . H . ; M a r e f , W . ; S a b e r , H . H . ;
S w i n t o n , M . C . ; G l a z e r , R .
O c t o b e r 2 0 1 0
A version of this document is published in / Une version de ce document se trouve dans:
10th International Conference for Enhanced Building Operation, Kuwait,
October 26-28, 2010, pp. 1-12
The material in this document is covered by the provisions of the Copyright Act, by Canadian laws, policies, regulations and international agreements. Such provisions serve to identify the information source and, in specific instances, to prohibit reproduction of materials without written permission. For more information visit http://laws.justice.gc.ca/en/showtdm/cs/C-42
Les renseignements dans ce document sont protégés par la Loi sur le droit d'auteur, par les lois, les politiques et les règlements du Canada et des accords internationaux. Ces dispositions permettent d'identifier la source de l'information et, dans certains cas, d'interdire la copie de documents sans permission écrite. Pour obtenir de plus amples renseignements : http://lois.justice.gc.ca/fr/showtdm/cs/C-42
ASSESSMENT OF THE ENERGY RATING OF INSULATED WALL ASSEMBLIES-A STEP TOWASSEMBLIES-ARDS BUILDING ENERGY LASSEMBLIES-ABELING
Hakim Elmahdy, Wahid Maref, Hamed H. Saber, Mike C. Swinton and Rock Glazer Institute for Research in Construction (IRC) - National Research Conncil of Canada (NRC)
Ottawa, Ontario, Canada
ABSTRACT
Considerable efforts are recently focusing on energy labeling of components and systems in buildings. In Canada, the energy rating of windows
was established, which provides a protocol to rate
different types of windows with respect to their energy performance. It takes into account the
interaction between: solar heat gain, heat loss due to
air leakage and due to the thermal properties of the entire window assembly.
A major research project, jointly sponsored by NRC-IRC and the polyurethane spray foam industry, was established to assess the thermal and au>leakage performance of insulated walls with the focus on developing an energy rating procedure for insulated wall assemblies. This paper is one in a series of publications to present partial results of this project. Experimental data and computer simulation comparison of a set of wall specimens are presented together with a summary of the proposed procedure for the determination of the energy rating of insulated walls (WER).
INTRODUCTION
There are a number of challenges facing the Spray Polyurethane Foam (SPF) industry including the use of environmentally friendly blowing agents to
minimize the negative impact on environment. A
research project was conducted at the National Research Council Institute for Research in Construction (NRC-IRC) to develop the second generation of blowing agents (namely HCFC). The results of this effort were published in 1990 (Bomberg et. aI., 1989 and Kumaran, et,.
,W.,,·,J990).
At present, the focus is on the assessment of the performance of the entire wall assembly to meet the requirements of building codes and regulatory bodies. This implies that a decision on the SPF cost is made in relation to its overall performance and in particularits contribution to heat, air and moisture transfer, and
not on the steady state thermal performance alone (e.g., R-value).
In an effort to meet the demand of the regulatory bodies, the polyurethane foam industry joined NRC-IRC to develop an energy rating procedure to rank
wall assemblies regarding their total energy performance. This means including the effect of wall tightness and its air leakage characteristics on the overall wall energy performance. Several wall samples were constructed and insulated with poly-wrapped and unsealed (glass fiber batts) insulation as reference walls, and light (open cell) and medium (closed cell) density foam insulation. Some walls were opaque and others were built with penetrations to simulate ducts, pipes, electric boxes, etc. through the wall.
A number of papers (Elmahdy, et. aI., 2009A, Maref, et. aI., 2009, Elmahdy et. aI., 2009 B, Saber et. a1. 2010A, Saber et. a1. 2010B, and Tariku et. aI., 20 I0) resulting from this joint research project have been published. Each paper documented the results of testing and simulation results at a certain stage of the project. In this paper, an overview of the project is presented in addition to a selected set of results reflecting the state of the project. The ultimate objective of this project is to develop a national and international standards to determine the wall energy rating (WER) of insulated wall assemblies.
OBJECTIVES AND SCOPE
The main objective of the project is to develop an experimental and analytical procedure to determine the energy rating of insulated wall assemblies. The procedure takes into account the heat loss due to air leakage and the thermal characteristics of the wall sample.
The scope of the project includes: constructing wall samples insulated with poly-wrapped and unsealed (glass fiber batts), as reference walls, and different types of foam insulation (open cell and closed cell foam), perform thermal and air leakage tests on wall samples and developing experimental and analytical procedures to determine WER. Finally, to present a final draft of a protocol to determine WER based on minimum laboratory tests. The latter would pave the way to the development of a national standard to determine WER.
EXPERIMENTAL TASK
In this task, laboratory testing is performed on each wall sample to determine: air leakage and overall thermal resistance (R-value). In addition, separate insulation material sample are prepared to
conduct material characterization according to the established standards. In some cases, the air leakage rate and R-value tests are performed befo,l'o,a\ld after sample conditioning, as will be explainedャ。エセイN
NUMERICAL SIMULATION TASK
In this task, an advanced 3D computer model (hygIRC-C) was developed to simulate the wall assembly and to determine (numerically) the R-value of each wall with and without air leakage (Saber et. a!., 2010A and Saber et. a!., 201OB). This model has been used in several related studies (Elmahdy et a!., 2009B, Saber···etaL; 2010Aand-201IYB; and Saber and Swinton, 2010). The 3D version of this model
was used to conduct numerical simulations for
different full-scale wall assemblies with and without
penetration to predict the "apparent" thermal
resistance (R-value) with and without air leakage. The predicted R-values for these walls were in good agreement (within
±
5%) with the measured R-values in NRC-IRC's Guarded Hot Box (GHB) (Elmahdyet a!., 2009B, and Saber et a!., 2010A).Recently, the 2D version of the present model was
used to conduct numerical simulations in order to
investigate the effect of the emissivity of foil on the effective thermal resistance of a ヲッオョ、セヲェb|ャ wall system with foil bonded to expanded pp!¥styrene foam in a furred assembly with airspace next to the foil (Saber and Swinton, 2010).
Furthermore, the 3D version of this model was used to investigate the thermal response of Insulated Concrete Form (ICF) wall assemblies (Saber et a!., 2010D). Subsequently, the hygIRC-C model was benchmarked against the measured data. Results showed that the predictions of the present model were in good agreement with experimental data. In this work (Elmahdy et a!., 2009B, Saber et a!., 2010A, 2010B, 2010D, and Saber and Swinton, 2010), no moisture transport was accounted for in predicting the thermal performance of different types of walls.
In the case of accounting for moisture transport, the present model was used to predict the drying rate of a number of wall assemblies subjected to different exterior and interior boundary conditions (Saber et a!., 2010C and Maref et a!., 2002). The model predictions were in good agreement with the experimental data (within ±5%)
WALL DESCRIPTION
iiit'
In this paper, six walls are selected to demonstrate the process to develop WER procedure. More walls are being tested and modeled using hygIRC-C, and the results will be reported in the future.
All wall samples described in this paper are constructed using conventional 2" by 6" wood stud
frame, and insulated with: poly-wrapped and unsealed insulation (glass fiber batts) and open cell spray polyurethane foam (SPF). The overall dimension of the wall is 2.4 m by 2.4 m (a standard size to fit the NRC-IRC' guarded hot box apparatus).
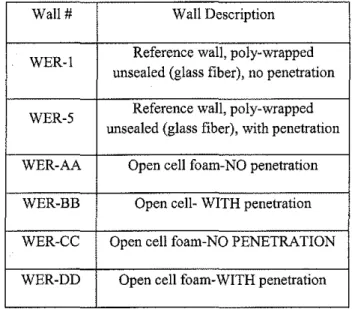
Table I provides full description of the six wall samples reported in this paper. This set of walls include: poly-wrapped and unsealed (glass fiber batts) insulated walls, insulated walls with open cell foam. In addition, some walls are with penetrations and others are without penetrations. The idea is to present a variety of walls and demonstrate the -applieability-of-thepreposedproeedure for different
types of wall samples.
It is worth noting that the SPF is provided by different manufacturers, and all foams meet the Underwriter Laboratory Canada (ULC 2005) standards and CCMC guides (CCMC 1996).
Table 1 Summary of wall description Wall# Wall Description
WER-l Reference wall, poly-wrapped unsealed (glass fiber), no penetration WER-5 Reference wall, poly-wrapped
unsealed (glass fiber), with penetration WER-AA Open cell foam-NO penetration WER-BB Open cell- WITH penetration WER-CC Open cell foam-NO PENETRATION WER-DD Open cell foam-WITH penetration
With regard to WER-l and WER-5 walls, it is important to note that those walls were built to common field installation practices and are intentionally not to the requirements of Part 9 of the National Building Code (NBC) to introduce a wide range of air leakage rates. Part 9 NBC gives two
options for air barrier continuity:
I. Sealing the joint, or
2. Lapping the joint by not less than 100 mm and clamping between framing members and rigid panels
The second option was selected for this project, with the understanding that it is likely less effective in controlling air leakage.
NBC 2005 also requires sealing of windows, piping, ducting and electrical boxes to maintain the
integrity of the air barrier. For the purpose of having a wide range of air leakage rate, all penetrations were not sealed to meet the NBC requirements. Therefore, WER-I and WER-5 do not meet all of the air barrier requirements of NBC 2005.
Figure I A vertical cross section ofWER-l.
Top plates Gypsum 12mm SPF 6mil polyetl OSB -.. WER-I
Figure I shows a schematic of poly-wrapped and
sealed glass fiber batts insulated walls and Figure 2 is a cross section of a wall insulated with open cell SPF filled the entire stud cavity.
Figure 3 is a schematic vertical crossウ・」エセッョ of a
poly-wrapped unsealed (glass fiber) insulated wall,
and Figure 4 shows a vertical cross section of an
open cell spray foam insulated wall.
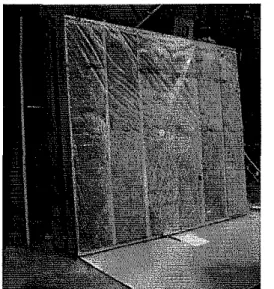
Figure 3A poly-wrapped and unsealed (glass fiber)
insulated wall.
Figure 4 Open cell foamed wall prior to testing.
aSH
Sheathing Ilmm Weather re,istive barrier membrane"
Spmcebottomplate and ,tud, ",,"
Insulation, polyurethane Jipray foam, ,tud thiekne.. 140mm Gyp,um,12 mm
WALL SAMPLE PREPARATION
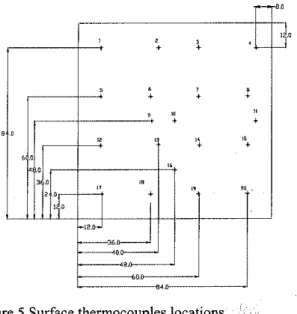
Each wall is furnished with an array of
thermocouples and in case of the poly-wrapped and unsealed (glass fiber) walls, heat flux transducers are also installed to measure the local heat flow. These transducers are used for more in depth analysis of thermal bridging and will be the subject of future publication. Some interstitial thermocouples are also installed to measure the surface temperature at
different layers of the wall. Figure 5 shows the
thermocouples mounted on the wall surface, and
Figure 6 shows the interstitial thermocouple
locations.
Figure 2 A vertical cross section of open cell insulated wall
TEST SEQUENCE
Each wall sample is subjected to a series of tests. This included:
• Air leakage test before conditioning
• Sample conditioning
• Air leakage test after conditioning
• Thermal resistance test before and after
conditioning (in the early stage of the project)_ セGLZZZZZZLGG[ャB • sQBBNセN⦅BiRN .""" ,",II•. ,ュセャュオセ ..LセBLセセBイBNB ... BGLBMBBBBGLBセ BBNLLLNBLLLLセNLBB
...
(o"..,.Iorlrio.,m." GIBセGGGBoュLョB •• sP' '«><',''''''"'''''' T",., ..,11,.1/1" iGLBᄋBᄋGセi 0.""". - ..do< ,,"""c\
II
1'--,,,",,, HANャュセQ セ[ZセZGゥ セLZ[MセGEGZZIM セ ""'" i-, o.,<:JI'Hmm)"" H...", ..iLBBBGセBoセB
セ
f-->" セZセNG[エZZZセNZセ
::::;:.w,..•", MNBLMBGセセ..
1000'''''''''"1 .,,"/
1-
II
'1
/Figure 7 A schematic illustrating wall penetrations (dimensions are in inch)..
,-
-M , ,,
'\---j
+ + ,.
,
.
+ + + , " " + + 0' , ""
" + + . .0 . 0 " ' 0 " " " "':jo
+ II
"oJLッセ
f---36.Q セッセ•
0,0,
Figure 5 Surface thermocouples locations (dimensions are in inch),
Some walls are opaque (no penetrations), while others included penetration according to the CCMC Air Barrier Gide (CCMC 1996), These penetrations
simulate air ducts, a window, electric boxes and
water pipes. Figure 7 shows a schematic illustrating all the penetrations considered in the test specimens.
SAMPLE CONDITIONING
Each wall is conditioned (after initial air leakage) according to the CCMC guide, The wall sample is subjects to cycles of positive and negative pressure as follows:
A positive pressure rise from 0 to +800 Pa in 1
second, remains constant for 3 seconds, down to
o
Pa in one second and remains at 0 Pa for 3seconds. This cycle is repeated 800 times A negative pressure is applied from 0 to - 800 Pa
in one second, remains at - 800 Pa for 3 seconds,
increases to 0 Pain 1 second, and remains at 0
Pa for 3 seconds. This cycle is repeated 800
times.
Gust wind: two cycles from 0 to +1200 Pa (and
another to - 1200 Pal in a similar cycle, Figure 8 illustrates the conditioning pressure cycles.
Figure 6 Interstitial thermocouple locations (dimensions are in inch).
Time,s
Table 2 Summary of material characterization tests on all foamed walls.
R-VALUE TEST RESULTS
The R-values of all walls are detennined in the NRC-IRC guarded hot box facility (ASTM 1998A, ASTM 1998B and ISO 12567). Figure 9 shows a picture of a wall mounted in the mask wall of the guarded hot box.
As indicated earlier, the R-value of some walls (see Table 3) was determined after sample conditioning. In the early stage of the project, the wall R-value was detennined before and after
conditioning. Since there was not a significant
change in the R-value after conditioning compared to the values before conditioning, it was decided not to repeat the R-value test after condition to conserve time, money and energy (Elmahdy et aI., 2009). Also, the R-values were detennined at a warm side temperature of 20±l oC while the cold side was maintained at -20±1 °C and -35±10c,
AIR LEAKAGE TEST RESULTS
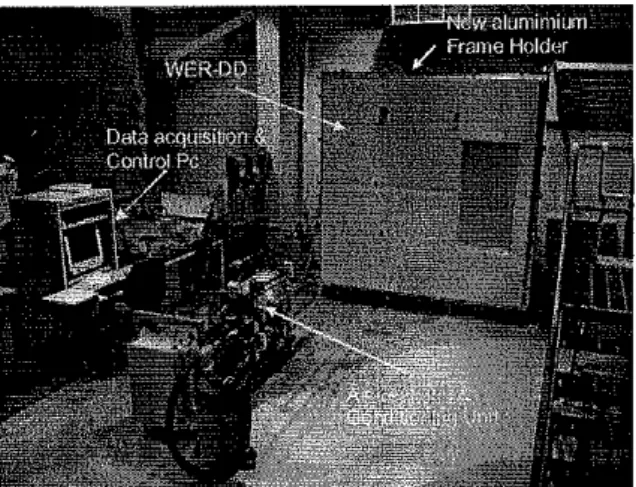
All wall samples are tested to detennine their air leakage perfonnance at different pressure differential (ASTM 1997). Figure 10 shows a wall mounted in the air leakage tester. Also, the same test facility is used for the sample conditioning.
Following the mounting of the wall sample, the extraneous air leakage (system air leakage) is detennined. Ideally, the extraneous air leakage should be less than 10% of the expected air leakage rate (as per the ASTM standard). After many Figure 8 NRC-IRC guarded hot box
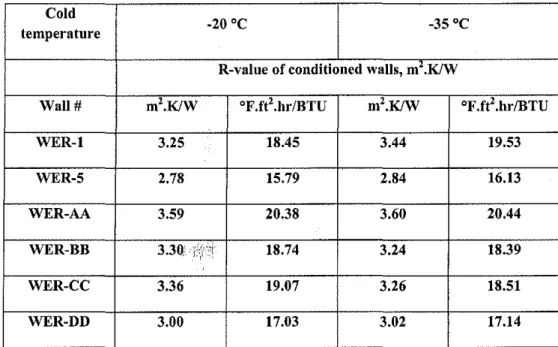
Table 3 provides a summary ofR-values of the six walls at the two temperature differences as mentioned above, and Figure 9 is a bar chart showing the R-values of the six walls at two different set of temperature difference. As shown in this figure, the difference between the R-values of each wall at the two different temperature differences is within the uncertainty (±6%) of the GHB (Elmahdy 1992 and ISO 12567). P, Repeated negative pressurenUrnes, RepealedpOsltiv&_t--':::-'--'-"'--l...-'-_ _--t-f pressure n timeS:- P'2
Pressure cycle for sample conditioning
·800 1600
Figure 8 A schematic of the pressure cycle during sample conditioning.
p',
·1600
MMMMMMMカMMMMMMセ
Cyclh; loads Gust loads
MATERIAL CHARACTERIZAnON
The material characterization was perfonned using heat flow meter according to ASTM C-518-98 standard (ASTM 2004) on all foams used in this project. The test specimens were placed horizontally in a 60 em x 60 em Heat Flow Meter apparatus. Heat flowed vertically upwards through the specimens during the tests. The thermal conductivity was detennined at five different mean temperatures. However, only the foam thennal properties,reported. ·u·-:-::, in this paper is at mean temperature of a["ijnd 0.2±
I'c, Table 2 provides a summary of the results of material characterization of the foams used in WER-AA, WER-BB, WER-CC and WER-DD.
The thermal properties of glass fiber used in constructing WER-I and WER-5 were obtained from published thermal properties of insulation materials databases (Kumaran et. a1. 2004).
Wall
Symbol WER-AA WER-CC
Parameter &BB &DD
TestMean Tm(°C) 0.2 0.3 temperature Material p (Kg/m') 12.0 7.8 density Thermal 1.
f····
conductivity, (W/(m.K» 0.0352 0.0388 SIunitsmodifications, the system now has almost zero
extraneous air leakage rate.
4 3.5 3 2.5 セ 2 1.5 0.5 o
Figure 9 R-value of six walls at two sets of temperature difference.
lumber used in building the walls and some deficiencies in sealing the poly may have contributed to this difference in air leakage performance of the walls.
'"
50 75 100 126 Differential Preasuril, P."
r sa ege,...
.
eCCMC Limit -• W.i "ncorldliioned AW.lleondltlone<l {lInel)-...d
.Adセ セV-A
...
/".:
....
セ
,.,
FigureII Air leakage results ofWER-1
Also, the wall with penetrations (WER-5) is less tight than WER-I (without penetrations). This is expected as a result of not sealing around the interface of the penetration and more construction tolerance at all solid-solid interfaces of the wood frame of the penetration, see Table 4 (also, see Saber et. al., 20lOA and Saber et. al., 20lOB for more details).
Itis important to repeat here that both WER-I and WER-5 were not sealed according the Building Code
requirements.
'.1
,.,
Figure 10 A wall sample mounted in the air leakage tester N O.1 セ 0.6
so
t
0.5•
セ 0.4 '.3,
..
,
..
WER1 Al L k GI Fib r(RafaranoeWall)Natlnflltratlon N"p..nolretlon
'"
The next step is to subject the wall samples to pressure difference that varied between 0 and -ISO Pa, and determine the wall air leakage rate before and after conditioning. The CCMC Air Barrier Guide sets the maximum allowable air leakage rate for the product to be labeled as "air barrier". This limit is set at 0.05 L/(m2s) at L'lP= 75 Pa.
AIR LEAKAGE RESULTS OF SELECTE6'C; SAMPLES
The results of air leakage of two walls (WER-I and WER-DD) are shown in Figures 11 and 12, respectively. These figures are meant to illustrate the air leakage performance of those two walls as well as the effect of wall conditioning on their tightness performance. Both figures show the CCMC air leakage limit at L'lP= 75 Pa, as designated by a red circle. In general, the figures show that the air leakage rate increases with the increase in the pressure difference across the wall. Also, for WER-I the graph shows that the air leakage rate is slightly higher after the wall conditioning over L'lP= 0 to 100 Pa. This is the result of applying the pressure cycles and gust pressure across the wall. On the other hand, for WER-DD, its air leakage performance does not show a noticeable change before and after conditioning.
In general, the SPF walls show a lower air leakage rates compared to the poly-wrapped insulated walls as a result of the adhesion of the spray foam to the wall elements, which improves the wall tightness and sealing of the cracks. In addition, the natWeof the
WER·DO, Air Leakage, BASF • OCF, Net Inflltrll1lon, With ptInetratlon
It is important to realize that in our previous publications on results of this project (Elmahdy, et aI, 2009A, Maref, et aI, 2009, Elmahdy et aI" 2009B, Saber et aI, 201 OA, and Saber et al 20 lOB), the correlation between the air leakage rate and the pressure differentials were performed by using a "straight line" fit. However, for more realistic representation of the air leakage data, an "exponential fit" is used, Therefore, the air leakage plots in Figures II through 12 are done using the exponential fit Incidentally, the air leakage rate at LlP=75 Pa does not change from the linear fit to exponential fit because it was a measured value (or close to it)
175
"
.
50 75 100 125 Differential Pre""ure, Pa eCCMCUmil r-• WallBBBッョ、ャセ」ョF、 f--I>Wall\」ョ、セャッョッ、 セ...
..,;....
APiI"" ..d'r
,r
"H/ '
0.00•
0.02 0.10 0.08 0.09 0.01 N'0.07 セ 0.08S-i
o.05 セ 0.04 0.03Figure 12 Air leakage results ofWER-DD
Table 3 Summary of R-values determined in the guarded hot box Cold
temperature -20°C -35°C
R-value of couditioued walls, m'.KIW
Wall# m'.KlW °F.n'.hr/BTU m'.KlW °F.ft'.hr/BTU
WER-l 3.25 18.45 3.44 19.53 WER-5 2.78 15.79 2.84 16.13 WER-AA 3.59 20.38 3.60 20.44 WER-BB 3.30,' i,;{i?! 18.74 3.24 18.39 WER-CC 3.36 19.07 3.26 18.51 WER-DD 3.00 17.03 3.02 17.14
Table 4 Summary of measured R-value, air leakage rate at 75 Pa, p-value and WER number for the six walls
0.62 359 0.013 3.3 0.022 3,36 0.014 2.99 0.036 NP-No penetrations 0,533 0.368 0,968 0,950 0.966 0,924 P-With penetrations 26.82 10.90 38.49 37.24 37.68 35.52
COMPUTER SIMULATION
As indicated earlier, a 3D computer model (hygIRC-C) is used to predict the wall R-value in the absence of air leakage. The results are compared to those determined by testing the walls in the guarded hot box. Figure 13 shows the comparison of the R-value of all walls as determined numerically (hygIRC-C model) and experimentally (guarded hot box). As it is shown on Figure 13, the agreement is very good and the variations are within the allowable tolerance of the guarded hot box at about ±6% (Elmahdy 1992).
The next step is to determine the "apparent R-value" of walls with the presence of air leakage. Since this could not be done in the guarded hot box, the hyglRC-C model is used to numerically. predict the apparent R-values at different pressure differentials.
and b change very slightly. Il is expected that by the time this project is completed, more than 16 different walls will be included, which will provide a more accurate coefficients. Others papers, to be published at a later date, are being prepared to report this
notion.
DETERMINATION OF THE WALL ENERGY RATING, WER
The procedure to determine WER is in line with that followed by Canadian Standards Association window energy rating (CSA 2004). WER is determined by calculating tbe net energy loss from the wall due to thermal conduction and due to air leakage.
From Equation (I), the apparent R-value of a wall with air leakage is rewritten as:
R-VALUERATIO
P
The R-value ratio
p
is defined as follows:As a result, WER could be expressed as:
(3)
The predicted "apparent" R-value, and The measured R-value in guarded hot box Theoretically, the ratio
p
varies between 0 and I. The next step is to correlate the factorp
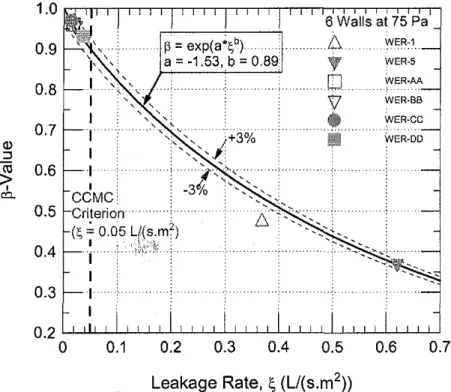
with the wall air leakage rate, 1';,(L/(m'. s)). Figure 14 shPWS the correlation of the R-value ratiop,
with the air leakage rate determined at L'>P=
75 Pa for all walls.The relationship between
p
andI'; is expressed as:jJ=exp(a
;b)
(2)Where:
a
=
-1.53 (L/(m' .s)rO.89, and b=
0.89The above expression predicts the
p
-values for the six wall specimens at air leakage rates determined at L'>P =75 Pa to within ±3%. Note that the calculatedp
-value using the expression above goes to 1.0 as the air leakage rate,I'; , approaches to 0.0.Il is important to indicate that Equation (2) is an
interim expression of the ratio
p.
As more walls aretested and included in the correlation, the values of a
Where:
WER is the Wall Energy Rating number(W/m'), !'>.T is the proposed standard temperalure
difference for evaluating WER, set at 40K.
Since Equation (4) will always result in a negative number, and to follow the procedure of CSA standard (CSA 2004), a positive value of 50 was added to ensure that all WER values will be positive. Furthermore, and to make WER dimensionless, a constant C = I (m'/W) is used to normalize WER. The fmal expression of dimensionless WER is
written as: (4) (5)
wer]Mセ
RSI£
wer]UPMcHセI
RSI£
Where C is a constant and equals to I m'/W
(1)
jJ=
RSI
LRSI,
Where: RSh RSlo4.0
3.5
セ3.0
セ2.5
E
--- 2.0 Q) :::; セ1.5
I0::: 1.0
0.5
0.0WER-1 WER-5 WER-AA WER-BB WER-CC WER-DD
Figure 13 Comparison of measured and predicted R-values often walls.
6 Walls at 75 Pa
0.7
WER·AA WER·BB WER·5 WER-DD WER-CC0.6
0.5
0.4
0.3
セ
=exp(a;i;b) •. L \
a= -1.53.b = 0.89T
... 0
'V
•
iii
0.2
0.1
1.0
0.9
0.8
0.7
Q) ::Jセ
0.6
c<J..0.5
0.4
0.3
0.2
0
Leakage Rate, セ (L/(5.m2))Figure 14 Correlation ofR-value ratio
p
and air leakage rateS
for six walls.Equation (5) represents the wall energy rating of insulated wall taking into account the heat loss due to the thermal transmission and due to air leakage characteristics of the wall. Table 4 above shows the
WER values for all six walls included in this paper in addition to RSlo,air leakage rate
S
atエ^NpセWU Pa, and the R-value ratiop
atエ^NpセWU Pa.COMMENTS ON WER
The numerical values of WER show the degree of interaction between the waH R-value, its air leakage rate and the total heat loss through the waH assembly. As the air leakage increases, the apparent R-value decreases; hence increase of heat loss.
To illustrate this interaction, two different waHs are considered: a leaky waH with air leakage rate of 0.62 L/(m'.s) and a very tight waH with air leakage
rate of 0.022 L/(m'.s). AH air leakage rate are
measured atlGNpセWU Pa.
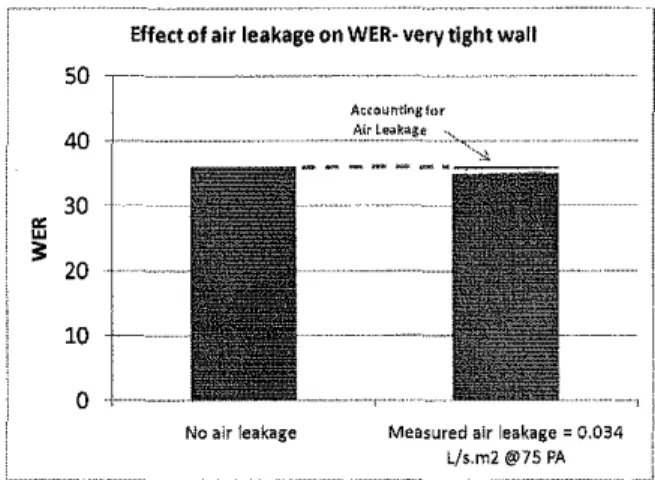
The impact of these different air leakage rates (leaky waH and tight waH) on WER is shown in Figures 15 and 16, respectively. Those figures show that as air leakage rate increases, the value of WER
decreases relative to a similar wall with no air
leakage. Therefore, the overaH thermal performance of the waH is affected by the amount ofaitleaking through the assembly.
Effectof air leakage on WER-Leaky wall
50
assemblies with respect to their energy performance. In addition, there is an ongoing discussion to draft an international standard (within ISO TCl63 committee) for the same purpose.
Recently, two waHs were constructed to replace
WER-I and WER-5. The replacement waHs were
built according to the Canadian Building Code requirements and showed substantial improvement in their air leakage performance. Infact, some of these
waHs performed as good as the SPF waHs. The
results will be published in the near future.
Effectof air leakage on WER· very tight wall 50 , - - - . --30 ffi ;: 20 10
o
40No air leakage Measured air leakage=0.034
Lfs,m2@75PA MMMMMMMセ NセM ..セM - " " " " , , _..
_-ACC(luntlng fOf. Air Leakage •...__ __ ,-",. """"""""""_..•
Measured air leakage= 0,62 l/s.m2 @75 PA
Figure 15 Effect of a leaky waH on WER WHAT IS NEXT?
The expected outcome of this project is a procedure to determine the energy rating of. insulated
. .' -.,..11 '..:.
waH assembhes. There are many products' m the
market place which could be assessed in a similar
manner. Efforts are underway to include other
products in the correlation of the R-value and air leakage (theセ curve) with the intention to cover most of the products in the marketplace. Also, under investigation, is the effect of the air cavity between the closed ceH foam and the dry waH on the overaH thermal performance of SPF insulated waHs.
In the near future, the reported procedure will be included in a national standard to rate waH
Figure 16 Effect ofa tight waH on WER
Finally, the principals developed in this project will be applied on other building elements such as: wall/ceiling joints, waH-basement footing joint and wall/roof joints. A new project is planned to address aH these issue in the near future. When completed, it would be possible to integrate the rating of aH building components in an effort to rate the entire building with regard to its energy performance. CLOSING REMARKS
This major project is a good example of the
cooperation between industry and government
research laboratory to investigate and resolve issues of mutual interest. The procedure developed in this project is sanctioned by industry and building code officials, which makes it easy to be incorporated in the national building and energy codes.
The main outcome of this project shows that the overaH thermal performance of insulated walls could not be measured by its R-value alone, due to the fact that walls are not completely air tight. This means that there is always air leaking through the wall
system. The overall energy performance of the wall has to include the effect of air tightness on its energy performance. Therefore, efforts should be made to design and build walls as tight as possible in order to improve their overall energy performance.
Since the work in this project resulted in a large amount of information, test results anc}:%different
products, it was essential to report the results in a
number of publications. However, at the end of the project, a summary report will be prepared to capture the most important results and conclusions. This would form the basis of a draft standard to be used in the building energy codes.
REFERENCES
• ASTM 1997. E 283 Test Method for Rate of Air Leakage through Exterior Windows, Curtain Walls and Doors, Philadelphia: American Society for Testing and Materials, 1997.
• ASTM 1998A. ASTM C 1199 Test Method for Measuring the Steady State Thermal Transmittance of Fenestration Systems Using Hot Box Methods, Philadelphia: American Society for Testing and Materials, 1998.
• ASTM 1998B. ASTM E 1423 Practice for Determining the Steady Statel'iiThermal
Transmittance of Fenestration Systems,
Philadelphia: American Society for Testing and Materials, 1998.
• ASTM 2004. ASTM C 518 Steady-State Thermal Transmission Properties by Means of the Heat Flow Meter Apparatus, Section 4, Volume 04.06, Philadelphia: American Society for Testing and Materials, 2004. • Bomberg, M.T.; Kumaran, M.K., 1989,
"Report on sprayed polynre-thane foam with alternative blowing agents," CFCs and the Polynrethane Industry: Vol 2: (A Compilation of Teclmical Publications) pp. 112-128, 1989, (NRCC-311 13) (IRC-P-1638).
• CCMC 1996, Canadian Construction Materials Center: Technical Guide for Air
Barrier Systems for Exterior Walls of Low-Rise Buildings, Masterformat Section 07272, National Research Council of Canada, 1996.
• CSA 2004. Canadian Standards Association: Energy performance ofキゥョ、ッキウ[GゥNセョゥャ other fenestration systems (CSA A440.2), 2004,
5060 Spectrum Way, Suite 100, Mississauga, Ontario, Canada, L4W 5N6. • Elmahdy, A H., 1992 "Heat transmission
and R-value of fenestration systems using IRC hot box : procedure and uncertainty analysis," ASHRAE Transactions, 98, (2), ASHRAE Annual Meeting, pp.630-637. • Elmahdy, A H., Maref, W. Swinton, M.C.,
Tariku, F., 2009A "Energy rating of polynrethane spray foamed walls: procedures and preliminary results". 4th International Building Physics Conference, Istanbul, Turkey, 15-18 June, 2009.
• Elmahdy, AH., Maref, W., Swinton, M.C., Saber, H.H., and Glazer, R., 2009B "Development of Energy Ratings for Insulated Wall Assemblies" 2009 Building Envelope Symposium (San Diego, CA 2009-10-26) pp. 21-30, 2009.
• ISO 12567 1998, Thermal performance of
doors and windows-Determination of
thermal transmittance by hot box method, ISO Headquarter, Geneva, Switzerland.
• Kumaran, M.K., Lackey,1.,Normandin, N.,
van Reenen, D., and Tariku, F., 2004. A Thermal Moisture and Transport Property Database for Common Building and Insulating Materials, Final Report, ASHRAE Research Project 1018-RP, Institute for Research in Construction, National Re-search Council, Ottawa,
Ontario, Canada.
• Kumaran, M.K.; Bomberg, M.T., 1990, "Thermal performance of sprayed polynrethane foam insulation with alternative blowing agents," Journal of
Thermal Insulation, 14, pp. 43-57, 1990,
(NRCC-32365) (IRC-P-1695).
• Maref, W., Elmahdy, AH., Swinton, M.C., and Tariku, F., 2009, "Assessment of Energy Rating of Polynrethane Spray Walls: Procedure and Interim Results", ASTM 2nd Symposium on Heat-Air-Moisture Transport: Measurements and Implications in Buildings, Sponsored by ASTM CI6 on Thermal Insulation, April 19-20, 2009, Vancouver, British Colombia, Canada. • Maref, W., Kumaran,M.K., Lacasse,M,A"
Swinton, M.C., and van Reenen, D. 2002A,
lILaboratory measurements and
benchmarking of an advanced hygrothermal model," Proceedings of the 12th International Heat Transfer Conference (Grenoble, France, August 18, 2002), pp. 117-122, October 01, 2002 (NRCC-43054).
• Maref, W" Lacasse, M.A., Kumaran, M.K"
and Swinton, M.C., 2002 B, "Benchmarking of the advanced hygrothermal model-hygIRC with mid-scale experiments," eSim 2002 Proceedings (University of Concordia, Montreal, September 12, 2002), pp. 171-176, October 01, 2002 (NRCC-43970).
o NBC 2005, National Building Code of
Canada, 2005, Volume I, Issued by the Canadian Commission on Building and Fire Codes, National Research. Gl'.lll\yil of Canada.
• Saber, H,H., Maref, M., Lacasse, M.A.,
Swinton, M.C., and Kumaran, M.K., 2010C, "Benchmarking of Hygrothermal Model against Measurements of Drying of Full-Scale Wall Assemblies", 2010 International Conference on Building Envelope Systems and Technologies, ICBEST 2010, Vancouver, British Colombia Canada, June 27-30,2010, pp. 369-377.
o Saber, H.H., Maref, W., Armstrong, M.,
Swinton, M.e., Rousseau, M,Z" and
Gnanamurugan, G. 201OD, "Benchmarking 3D Thermal Model against Field Measurement on the Thermal Response of an Insulating Concrete Form (ICF) ,Wall in Cold Climate" Building XI Conference (in print), December 5-9, 2010, Clearwater Beach, Florida, USA.
o Saber, H.H., Maref, W., Elmahdy, A.H., Swinton, M.C., and Glazer, R, 2010A, "3D Thermal Model for Predicting the Thermal Resistances of Spray Polyuretha\l!l',j Foam Wall Assemblies", Building XI Conference (in print), December 5-9, 2010, Clearwater Beach, Florida, USA.
o Saber, H.H., Maref, W., Elmahdy, A.H.,
Swinton, M.C., and Glazer, R., 2010B, "3D Heat and Air Transport Model for Predicting the Thermal Resistances of Spray Polyurethane Foam Wall Assemblies" submitted to International Journal of Building Performance Simulation, March 2010.
o Saber, H.H., Swinton, M.C.
"Determining through Numerical Modeling the Effective Thermal Resistance of a Foundation Wan System with Low Emissivity Material aud Furred - Airspace" 2010 International Conference on Building Envelope Systems and Technologies, ICBEST
2010, Vancouver, British Colombia, Canada, June 27-30, 2010, pp, 247-257. o Tariku, F., Maref, W, Swinton M,C" and
Elmahdy, A.H., 2010., "Numerical Simulations for Detennining the Thermal Response of, Wall Systems with Medium Density Polyurethane Spray Foams," eSim20 I0 - Winnipeg, Manitoba, Canada, May 18th and 21st, 2010,
o Underwriters' Laboratories of Canada (OLC): ULC S705.1-01, (Including amendments 1&2) 2005. "Standard for Thermal Insulation - Spray Applied Rigid Polyurethane Foam, Medium Density Material - Specification". 7 Underwriters Road, Toronto ON, Canada MIR 3B4.