EUROPEAN ORGANIZATION FOR NUCLEAR RESEARCH (CERN)
LHCb-DP-2016-003 January 12, 2018
The HeRSCheL detector:
high-rapidity shower counters for
LHCb
K. Carvalho Akiba1, F. Alessio2, N. Bondar2,3, W. Byczynski2, V. Coco2, P. Collins2, R. Dumps2, R. Dzhelyadin4, P. Gandini5, B.R. Gruberg Cazon5, R. Jacobsson2,
D. Johnson2, J. Manthey2, J. Mauricio6, R. McNulty7, S. Monteil8, B. Rachwal9,
M. Ravonel Salzgeber2, L. Roy2, H. Schindler2, S. Stevenson5, G. Wilkinson5
1 Universidade Federal do Rio de Janiero (UFRJ), Rio de Janeiro, Brazil
2 European Organization for Nuclear Research (CERN), Geneva, Switzerland
3 Petersburg Nuclear Physics Institute (PNPI), Gatchina, Russia
4 Institute for High Energy Physics (IHEP), Protvino, Russia
5 Department of Physics, University of Oxford, Oxford, United Kingdom
6 FQA, ICC, Universitat de Barcelona, Avinguda Diagonal 647, Barcelona, Spain
7 School of Physics, University College Dublin, Dublin, Ireland
8 Clermont Universit´e, Universit´e Blaise Pascal, CNRS/IN2P3, LPC, Clermont-Ferrand, France
9 AGH - University of Science and Technology, Faculty of Physics and Applied Computer Science,
Krak´ow, Poland
Abstract
The HeRSCheL detector consists of a set of scintillating counters, designed to increase the coverage of the LHCb experiment in the high-rapidity regions on either side of the main spectrometer. The new detector improves the capabilities of LHCb for studies of diffractive interactions, most notably Central Exclusive Production. In this paper the construction, installation, commissioning, and performance of HeRSCheL are presented.
Submitted to JINST c
CERN on behalf of the LHCb collaboration, licence CC-BY-4.0.
1
Introduction
HeRSCheL (High Rapidity Shower Counters for LHCb) is a system of Forward Shower Counters (FSCs) located in the LHC tunnel on both sides of the LHCb interaction point. It was installed for Run 2 of the LHC, which began in 2015, with the aim of enhanc-ing LHCb’s capabilities in diffractive physics, in particular Central Exclusive Production (CEP) analyses [1].
Each FSC comprises a quadrant of scintillator planes equipped with PMTs, which are read out synchronously with the sub-detectors of the LHCb spectrometer. The planes are situated close to the beampipe and detect showers induced by very forward particles interacting in the beampipe or other machine elements [2,3]. In this manner HeRSCheL provides sensitivity to activity at higher rapidities than is available from the other sub-detectors of the experiment. This increased acceptance will be valuable in the classification of different production processes in LHC collisions, for example the isolation of CEP candidates.
This paper is organised as follows. The physics motivation for HeRSCheL is elabo-rated in Sect. 2. The apparatus is described in Sect. 3, and the calibration procedure and detector sensitivity are discussed in Sect. 4. The improved performance that HeRSCheL brings to CEP analyses is assessed in Sect. 5. The role of HeRSCheL in the LHCb trigger is explained in Sect. 6. Conclusions are drawn in Sect. 7.
2
Physics motivation: CEP studies at LHCb
LHCb is a forward spectrometer with tracking, particle identification and calorimetry extending to a pseudorapidity of η ∼ 5 [4]. The upstream stations of the silicon-strip vertex detector (VELO) provide sensitivity to charged particles down to η ∼ −3.5 in the backward hemisphere. Although the design of LHCb was optimised for studies of heavy-flavour hadron decays, its operating conditions and sensitivity to low transverse-momentum (pT) particles make it ideally suited to measurements of CEP processes.
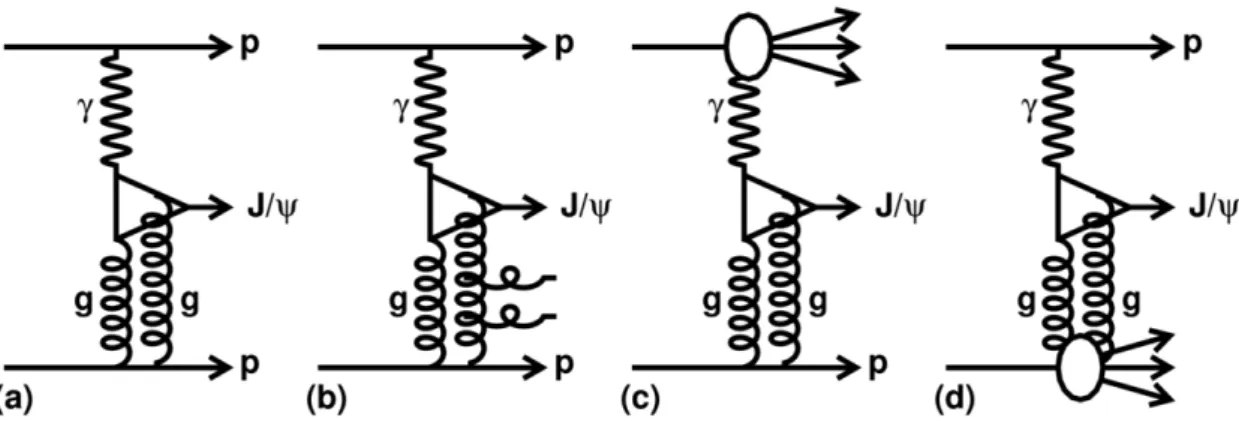
In CEP interactions at the LHC a central system of one or more particles is formed as the result of pomeron or photon exchange. The beam protons survive the collision intact, remaining undetected inside the beampipe. As an example, the Feynman diagram for the CEP formation of a J/ψ meson is shown in Fig. 1. The low multiplicity of the final state and the absence of activity, or large ‘rapidity gap’, either side of the central system provides a distinctive signature of the CEP process. In practice, this signature can only be exploited by the current LHCb trigger in beam crossings where there are no additional interactions. The fraction of single interaction events within the acceptance of the LHCb spectrometer is relatively large during normal operation, being approximately 37% in 2015. Contamination to the signal selection arises, however, from inelastic interactions in which one or both protons disassociate, or gluon radiation accompanies the pomeron or photon exchange, processes that are also displayed in Fig. 1. In these cases additional hadrons are produced at high rapidities, which generally means that they fall outside the acceptance of the sub-detectors of the spectrometer.
Figure 1: Feynman diagrams of diffractive-production mechanisms of J/ψ mesons at the LHC, where the double gluon system being emitted from the beam proton constitutes the pomeron. (a) is the pure CEP process, (b) has additional gluon radiation, and (c) and (d) involve proton dissociation. (Taken from Ref. [5]).
LHCb has published studies of exclusive J/ψ, ψ(2S) [5–7] and Υ [8] production based on the Run-1 data set. The background from inelastic events in which high rapidity particles were undetected in the spectrometer was estimated by fits to the p2T spectra of the candidates. The expected distribution of CEP signal peaks at p2T ∼ 0, although the exact distributions of signal and non-exclusive background depend on model-based assumptions. Using this approach, the typical purity of the selection was determined to be 50 − 60%.
The sensitivity that HeRSCheL provides for high-rapidity particles will enable the contamination from inelastic events in the CEP selection to be suppressed. Information from HeRSCheL will typically be deployed in a veto mode. The absence of any signifi-cant activity in the FSCs will be used to confirm the existence of a rapidity gap extending beyond the spectrometer acceptance, and to add confidence to the central-exclusive hy-pothesis of CEP candidates. In this manner the purity of the CEP selection will be improved, and the systematic uncertainties associated with the modelling of the residual background can be reduced.
The information provided by HeRSCheL will be beneficial for other analyses in which rapidity gaps are an important signature, for example the study of single-diffractive events. It can also be used as a counter of general inelastic activity, which has applications in the luminosity determination.
Figure 2: Layout of the active areas of the HeRSCheL stations around the LHCb interaction point (IP8), where for illustration the HeRSCheL stations have been magnified by a factor of 20 with respect to the rest of the LHCb detector. z-axis not to scale.
3
Description of the detector
3.1
Layout
In the LHCb coordinate system the z-axis points from the LHCb interaction point (IP8) towards the muon chambers and is collinear with the nominal beam line. As shown schematically in Fig. 2, the HeRSCheL system comprises three stations at negative z, known as ‘backward’ or ‘B’ stations, and two stations at positive z, known as ‘forward’ or ‘F’ stations.
The station closest to the interaction point, named ‘B0’, is located at z ∼ −7.5 m, next to the MBXWH compensator dipole. The next closest stations are ‘B1’ and ‘F1’, located at z ∼ −19.5 m and z ∼ 20 m, respectively, in the proximity of the MBXWS corrector dipoles. The most distant stations, ‘B2’ and ‘F2’, are located at z ∼ ±114 m, close to the point at which the vacuum chamber splits into two separate chambers, one for each beam.
The active element of each station is a plastic scintillator plane with outer dimensions of 600 mm × 600 mm, centred around the beam line. The shape and dimensions of the inner opening depend on the local vacuum chamber layout. Stations B0, B1, and F1 have circular holes with radii of 47 mm (B0, B1) and 61 mm (F1), respectively. For stations B2 and F2, the inner opening has a half-width of 115 mm in the horizontal direction (to encompass the two vacuum chambers), and a half-width of 54 mm in the vertical direction.
Pseudorapidity of the parent particle
10− −5 0 5 10
Deposited energy [a. u.]
0 5 10 15 20 25 30 35 40 45 B0 B1 B2 F1 F2 LHCb simulation
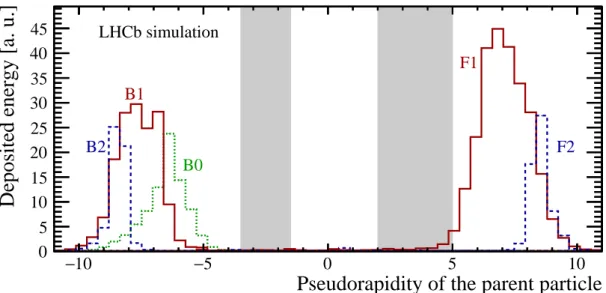
Figure 3: Energy deposit in the scintillators as a function of the pseudorapidity of the parent particle that caused the shower. The grey areas indicate the nominal pseudorapidity coverage of LHCb.
3.2
Acceptance
Stations B0, B1, and F1 are intended to register the showers produced by high-rapidity collision products crossing the beam pipe inside or close to the MBXWH and MBXWS magnets (which constitute local aperture restrictions). Stations B2 and F2 are intended to detect showers from high-rapidity neutral particles interacting with the copper absorber block of the LHC collision rate monitors (BRAN [9]), which are located close to and in front of these HeRSCheL stations.
In order to validate the detector concept and to determine the acceptance, the expected activity in the HeRSCheL stations was simulated using the Gauss simulation framework [10], generating minimum bias events using Pythia 8 [11] and transporting the emerging final-state particles through the detector and tunnel geometry using Geant4 [12, 13].
The simulations confirm that the signal in the HeRSCheL stations is dominated by energy deposits from low-energy electrons and positrons produced in the showers induced by high-rapidity particles interacting with machine elements close to the scintillators. Fig. 3 illustrates the angular coverage, showing the pseudorapidity of the particles pro-duced in pp collisions where the contribution from each particle is weighted by the cor-responding energy deposit in the scintillators. The asymmetry between the distributions for B1 and F1 is a consequence of the asymmetric beampipe layout on the two sides of the LHCb interaction point, leading also to the different hole radii for the B1 and F1 counters shown in Fig. 2. The HeRSCheL stations are seen to add detector acceptance from five up to nearly ten pseudorapidity units.
3.3
Scintillators and photodetectors
Each station is segmented into four quadrants, i.e. four scintillator plates read out by separate PMTs. The scintillator plates are 20 mm thick and are manufactured from EJ-2001 plastic scintillator material, with a rise time of 0.9 ns and a decay time of 2.1 ns.
Plexiglass light guides of fishtail type are glued to one side of the scintillator plates, providing a transition between the rectangular cross-section of the scintillators and the circular cross-section of the PMT (Fig. 4, left). For safety reasons2and to prevent external
light leaking in, the scintillators and light guides are covered by thin aluminium sheets.
Figure 4: Schematic design of the scintillator and light guide of a single quadrant of B0/B1-type (47 mm inner radius), accompanied by a photograph of a B2/F2-type quadrant with the PMT and ‘clipping cable’ attached.
Each light guide is coupled to a Hamamatsu3 R1828-01 200 PMT. This PMT is a suitable choice because of its relatively fast rise time of 1.3 ns and its large range of gain adjustment.
A general requirement for the stable operation of a PMT is that the resistive divider current exceed the average anode current by a factor of at least 10 – 20. The R1828-01 PMT is rated for a maximum average anode current of 200 µA, and the voltage divider should thus drain about 2 − 4 mA at the relatively low gain (∼ 103 − 104) used in
operation. This is achieved by a custom-made divider that provides an extra bias current to the last set of dynodes, allowing the initial current through the divider to be restricted, while ensuring that there is enough current provided in the vicinity of the anode during nominal operation.
The use of Zener diodes for some of the stages allows a stable voltage to be maintained for the last dynodes at a high current drain. The two voltages for each PMT (bias and high
1Eljen Technology, Sweetwater, Texas, United States (http://www.eljentechnology.com).
2Polyvinyltoluene emits dense black smoke when burning without sufficient oxygen.
voltage) are supplied from CAEN4 A1535 and A1538D modules located on the accessible side of the LHCb cavern.
A short coaxial cable terminated with a resistor-capacitor chain is connected in parallel to the signal cable at the output of the PMT to ‘clip’ the tail of the signal and thus ensure that the pulse width is less than 25 ns. A complete assembly of scintillator, light guide and PMT is shown in Fig. 4 (right).
The PMT signals are transmitted to the readout electronics located in the LHCb cavern using low-loss coaxial cables (C-50-11-1). The length of these cables ranges between 137 m (for station B2), corresponding to a signal attenuation of 15%, and 15.4 m (for station B0), corresponding to an attenuation of 5%.
3.4
Mechanics
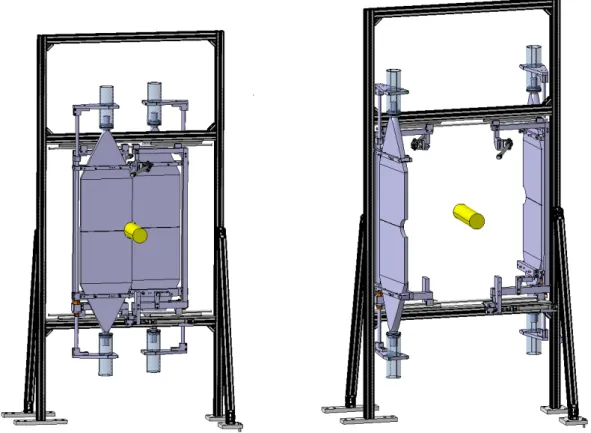
Each photodetector is mounted in a steel housing, including a shielding tube that provides protection against magnetic fields up to approximately 0.1 T. The detectors are mounted on mechanical supports manufactured from standard aluminium Bosch profiles. The stations are equipped with a remote-controlled, pneumatic motion system, illustrated in Fig. 5, which allows the scintillators to be retracted from the high-fluence region close to the vacuum chamber whenever they are not required for data-taking for an extended period of time. Figures 6 and 7 show photographs of the shower counter stations as installed in the LHC tunnel.
3.5
Readout and data acquisition
In order to minimise the development cost and to ease the integration with the LHCb data acquisition and trigger system, HeRSCheL makes use of the electronics of the LHCb preshower system [14], comprised of a very-front end (VFE) board, a front-end board (FEB), and a calorimeter readout card (CROC). The FEB and CROC are housed in a front-end crate (VME 9U card cage with a W-IE-NE-R5 MARATON power supply and a backplane specific to the LHCb calorimeter system). Two front-end crates are installed in the LHCb cavern, one for each side. Fig. 8 gives an overview of the readout chain components and connections.
The multi-anode photomultipliers of the preshower system are connected directly to the VFE board, whereas in HeRSCheL the signals are transmitted over long coaxial cables. A dedicated adapter board was therefore developed for HeRSCheL which receives the signal from the PMTs and adapts it to the input requirements of the VFE board. Each channel of the VFE board has two multiplexed differential integrators running at 20 MHz allowing the VFE channel reading even-numbered bunch crossings an empty, relaxation period while the other channel reads out, and vice-versa. The integrated analogue signal is sent to the FEB which digitises it with a 10-bit ADC and distributes it to the data acquisition and trigger paths. The digitised data are stored in looping RAMs with a depth
4CAEN S. p. A., Viareggio, Italy (http://www.caen.it/).
5
Figure 5: Visualisation of a HeRSCheL station in its nominal data-taking position and in its parking position, when the detectors are retracted and rotated.
of 256 cycles, in groups of four channels. The fine delay of the integration and sampling clock can be adjusted in steps of 0.78 ns in order to maximise the signal and minimise the contamination from signal in pp crossings preceding and following the one of interest.
On a positive decision from the global LHCb hardware trigger (L0), the data from each station are sent from the corresponding RAM depth. This allows for the data from the different stations, which acquire up to 750 ns relative delays due to the different station positions, to be synchronised with the global LHCb bunch counter. The digitised signals are sent to the CROC via the crate backplane. The CROC plays a dual role. Firstly, it is responsible for the control and monitoring of the front-end crate. It receives the timing and fast control (TFC) information and distributes it on the backplane to the FEB. The interface to the Experiment Control System (ECS) is based on the SPECS protocol [15]. The ECS control and monitoring of the FEBs is communicated through the backplane. Secondly, the CROC gathers the front-end data and sends them to the acquisition board (TELL1 [16]) via optical fibres.
Figure 6: Photographs of the backward HeRSCheL stations B0, B1, and B2, respectively.
Figure 7: Photographs of the forward HeRSCheL stations F1 and F2, respectively.
4
Detector sensitivity
In the case of a single CEP interaction, the produced central system may be reconstructed inside the standard LHCb acceptance and will be accompanied by no other activity within the main detector. For this signal no activity is expected in the HeRSCheL system. In the case of non-exclusive processes additional particles are produced together with the CEP candidate. These particles lead to activity being registered in HeRSCheL. In this Section the sensitivity of HeRSCheL to charged-particle activity is considered. Steps taken to minimise noise in order to maximise sensitivity are described. Finally the characteristic response of the detector in the absence of additional particle activity is presented. This ‘empty detector’ signal is the expected response in the case of a single
VFE
Timing and Fast Control System (TFC) TF C C ra te F E B oa rd VFE VFE Adaptor C R O C TE LL1 DAQ M A R A TO N Expt. Control System D A TA C O N TR O L D C V DATA TFC, ECS Shielding Wall SIGNAL D E TE C TO R CONTROL Integrated SIGNAL CLK,RESET CAEN HV H IGH V O LTA GE B IA S V O LTA GE W-IE-NE-R Rectifier W-IE-NE-RRCM SIGNAL
Figure 8: Block diagram of the readout, powering, and control of the FSC detectors. The diagram shows only one quadrant and one of the two front-end crates.
CEP interaction in a pp bunch crossing.
4.1
Response to incident charged particles
The detector response to charged particles has been calibrated in the laboratory, prior to installation, using cosmic muons. To achieve sensitivity to single incident particles, the voltage applied to the PMT was set to 1.1 kV. Later, the PMT gain as a function of the applied high voltage has been measured using LED light pulses. Using these measurements the signal per charged particle is determined as a function of the applied high voltage. This is shown in Fig. 9(a) for one quadrant of station B0.
Figure 9(b) shows the response (analogue pulse shape) of one of the quadrants of station B0, recorded using a digital oscilloscope during LHC injection tests in November 2014. In these tests, proton beams were extracted from the Super Proton Synchrotron (SPS) and dumped on an absorber (named TED) located approximately 340 m away from the LHCb interaction point, generating a shower of secondary particles at small angles
with respect to the beam line.
At the beginning of the 2015 data-taking period, the high-voltage settings were con-figured such that an energy deposit in the scintillator corresponding to one minimum ionising particle (MIP) resulted in a digitised signal between two and five ADC counts. These settings were kept throughout 2015.
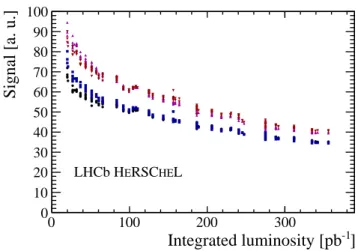
Irradiation leads to a reduction in attenuation length of scintillators and light guides and consequently to a loss of signal. In order to quantify the average signal, the tail of the ADC spectrum above the pedestal (see, for example, Fig. 13) is fitted with an exponential distribution, and the mean of the fitted function is used as a metric of the average signal. The ageing process is illustrated in Fig. 10 which shows the average signal per pp collision in the quadrants of station B0 as a function of the integrated luminosity in LHCb. The PMTs of this station were operated at a high voltage of 830 − 850 V, depending on the quadrant. The average signal corresponded to the equivalent of ∼ 72 − 95 MIPs at the beginning of the data-taking period and degraded to the equivalent of ∼ 35 − 40 MIPs at the end of 2015.
In 2016 and 2017, the high-voltage settings were updated regularly to compensate for the increasing loss of photoelectrons due to radiation damage. For example, the high voltages of station B0 were set to ∼ 830 − 860 V at the beginning of the 2016 data-taking period and were raised gradually up to ∼ 880 − 920 V at the end of 2016. The increase in high voltage did not lead to a significant change of the dark count rate.
HV [kV] 0.8 1 1.2 1.4 [pC / mip] Q 1 − 10 1 10 (a) L HE RSC E LHCb H Time [ns] 0 10 20 30 40 Signal [mV] 30 − 25 − 20 − 15 − 10 − 5 − 0 L HE RSC E LHCb H (b)
Figure 9: (a) shows the signal per particle as a function of PMT high voltage for one of the quadrants of station B0. The absolute scale is determined using measurements with cosmic muons, and the evolution with high voltage using a pulsed LED setup. The analogue signal of one quadrant of station B0, recorded during injection tests (‘TED shots’) in November 2014, is shown in (b).
4.2
Noise
For data collected during 2015 a significant common-noise component was found between the detector channels within each station, arising either from interference induced in the
] -1 Integrated luminosity [pb
0 100 200 300
Signal [a. u.]
0 10 20 30 40 50 60 70 80 90 100 L HE RSC E LHCb H
Figure 10: Average signal in pp collisions as a function of integrated luminosity in 2015, for the four quadrants of station B0. The high-voltage settings were kept the same throughout the entire 2015 data-taking period.
cables passing along the tunnel, or in the front-end electronics. This common noise has been studied by considering the correlation between the signal from each input channel and one spare cable for each station, placed next to the signal cables in the tunnel and connected to the readout electronics but left unconnected at the detector end.
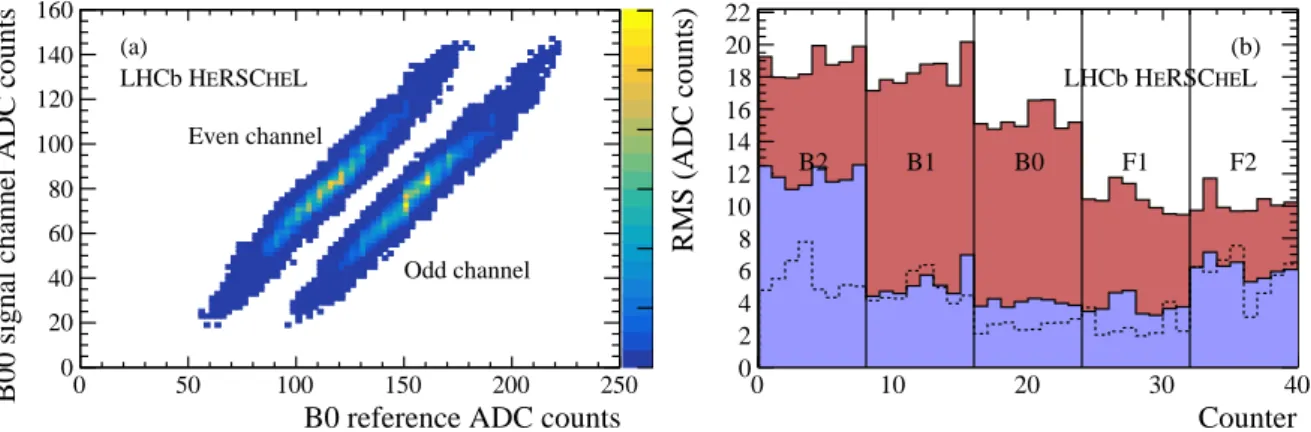
The correlation between the signal and spare cables has been studied using data col-lected during special calibration runs at the end of each fill, once the beams have been dumped. An example of the observed correlation is shown for one channel in Fig. 11. The common noise is then subtracted offline according to the correlations observed in each fill, and the ADC distribution is shifted to be centred at zero.
The adaptor board was replaced at the end of 2015 operation to employ a less noisy input-matching mechanism. Although data taken during 2016 have not been studied in depth yet, the uncorrected pedestal is seen to be much narrower than that observed in 2015, and no offline noise subtraction is required. The RMS for each channel in end-of-fill data is shown in Fig. 11, comparing the raw 2015 signal with that after the calibration has been applied, as well as demonstrating the much less noisy raw signal from 2016.
4.3
Correlation with other LHCb sub-detectors
An important confirmation of the detector’s successful operation is the observation of correspondence between activity registered in other LHCb sub-detectors and that in the HeRSCheL scintillators. In Fig. 12 the sum of the ADC counts from all the stations on each side is shown in the two cases that there are small or large numbers of tracks reconstructed on the corresponding side of the interaction point. For comparison with the B-side HeRSCheL response, only ‘backward’ tracks, leaving deposits in the VELO modules behind the interaction point and therefore reconstructed using only that sub-detector, are considered. To compare with the F-side HeRSCheL response, only ‘long
0 2000 4000 6000 8000 10000 12000
B0 reference ADC counts
0 50 100 150 200 250
B00 signal channel ADC counts
0 20 40 60 80 100 120 140 160 Even channel Odd channel (a) L HE RSC E LHCb H Counter 0 10 20 30 40 RMS (ADC counts) 0 2 4 6 8 10 12 14 16 18 20 22 B2 B1 B0 F1 F2 (b) L HE RSC E LHCb H
Figure 11: Subtraction of common noise. (a) illustrates the correlated noise for the two integrator channels reading out one detector quadrant on station B0 in 2015 end-of-fill data, with respect to the signal in the spare cable (B0 reference), not connected at the detector end. (b) compares the raw signal in end-of-fill data taken during 2015 (red/darker filled histograms) with that after common-noise subtraction (blue filled histogram) and the raw signal RMS with the new adapter board in 2016 (dashed histogram). Each station houses four PMTs, read out via the dual-channel VFE board, and there are therefore eight channels to consider for each station. The relatively large contribution of uncorrelated noise to the signal in the B2 station was the result of imperfect grounding; this was resolved at the end of 2015.
tracks’ are employed, where these tracks are reconstructed using deposits in the VELO modules around the interaction point and the tracking stations further downstream. As expected, more activity is seen in the HeRSCheL counters when more tracks are recon-structed.
Sum ADC B side
0 2000 4000 6000 8000 10000 0 0.02 0.04 0.06 0.08 0.1 No tracks >20 tracks (a) L HE RSC E LHCb H
Sum ADC F side
0 2000 4000 6000 8000 0 0.02 0.04 0.06 0.08 0.1 0.12 <4 tracks >25 tracks (b) L HE RSC E LHCb H
Figure 12: Correlation between sum of raw HeRSCheL ADC counts on (a) the B side and (b) the F side of the interaction point, with reconstructed tracks on the same side.
4.4
Empty-detector signal characterisation
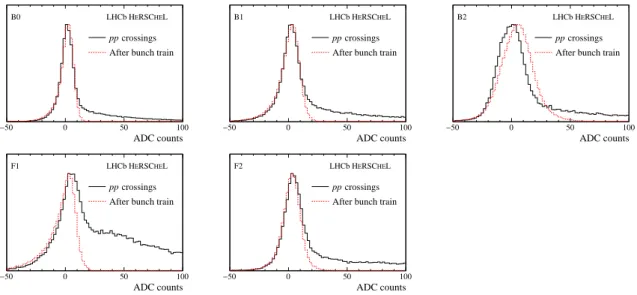
In this section the expected response of the detector is presented in the case that a single CEP interaction occurs during a pp crossing. For illustration Fig. 13 shows the signal recorded in one counter at each of the five HeRSCheL detector stations, for an arbitrary sample of pp collision events selected by the LHCb trigger. The two principal features of the distribution are the large portion of events around zero ADC counts in each counter, corresponding to an absence of activity, and a long tail to higher numbers of ADC counts, corresponding to significant activity in the counters.
Protons circulating in the LHC are distributed in bunches, separated from one another by 25 ns. Bunches are collected into ‘trains’ by virtue of the injection procedure, separated by gaps. A 25 ns window within which proton bunches cross in LHCb is referred to as a ‘bunch crossing’. Whilst the dominant contribution to the HeRSCheL empty-detector signal is electronic noise, secondary contributions arise as the result of activity in nearby crossings which spill into the 25 ns time interval of the triggered crossing. The largest of these secondary contributions is the residual impact on detector electronics of successive large signals in the detector, during a train of proton-proton crossings in the LHC. It is found that the signal recorded in the counters in the window immediately after such a train, where no particle activity can be present, provides a good description of the empty-detector region of the ADC response, as in the case of a CEP interaction. This ADC response for each of the example counters is also shown in Fig. 13.
ADC counts 50
− 0 50 100
crossings pp
After bunch train
L HE RSC E LHCb H B0 ADC counts 50 − 0 50 100 crossings pp
After bunch train
L HE RSC E LHCb H B1 ADC counts 50 − 0 50 100 crossings pp
After bunch train
L HE RSC E LHCb H B2 ADC counts 50 − 0 50 100 crossings pp
After bunch train
L HE RSC E LHCb H F1 ADC counts 50 − 0 50 100 crossings pp
After bunch train
L HE RSC E LHCb H F2
Figure 13: Activity registered, after calibration, in one integrator attached to one counter for each HeRSCheL detector station during beam-beam crossings in the solid histogram, showing only the range up to 100 ADC counts. The empty-detector signal recorded after a bunch train is represented by the dotted histogram.
5
Impact on physics studies
In the case of a single CEP interaction in a pp crossing, no activity is expected in the HeRSCheL detector other than that described in Sect. 4.4. In this section a metric is presented, employing information from all counters in the HeRSCheL detector, that can be used to discriminate between the empty-detector signal and the increased activity associated with background processes. The efficiency of this metric in selecting CEP signal is measured using CEP production of continuum-dimuon pairs, an abundant process that can be rather easily identified without HeRSCheL information. The effectiveness of the same metric in suppressing non-CEP background is determined. Finally the impact of using HeRSCheL information in the measurement of exclusive photoproduction of J/ψ mesons, that can be considered a benchmark for other CEP processes, is considered.
5.1
Efficiency of HeRSCheL in selecting empty events
In order to construct a quantity that combines the responses of all twenty counters com-prising the HeRSCheL detector effectively, it is beneficial to account for the characteristic distribution of the empty-detector signal in each counter. Examples of this empty detec-tor signal have been discussed in Sec. 4.4. The most natural way to combine the activity in all the HeRSCheL detectors is to construct a χ2 quantity, ξ
HRC, such that values of
ξHRC close to zero correspond to events with little or no activity in all the HeRSCheL
counters, as expected in the case of a single CEP interaction, and high values of ξHRC
correspond to events where the counter activity is elevated, as expected for non-CEP back-ground. In order to construct such a χ2 it is necessary to account for two effects. Firstly the non-Gaussian distribution of the empty detector HeRSCheL signals, as displayed in Fig. 13, must be accounted for. Secondly it is required to consider the correlation in the activities recorded in the different quadrants of the HeRSCheL stations, even between the different stations on each side, given the overlap in acceptance shown in Fig. 3. Both these effects have been studied in events recorded immediately after a series of pp bunch crossings in the LHC. A single χ2 quantity, ξHRC, is constructed to quantify the activity
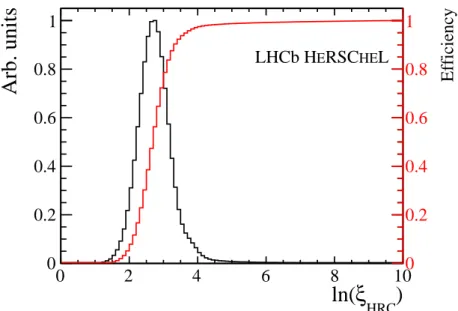
above the noise in all the counters, taking account of correlations between the counters. The distribution of the HeRSCheL metric, ln(ξHRC), is shown in Fig. 14 for the sample
of events immediately after a bunch train discussed in the previous Section. Since these events represent the activity expected in HeRSCheL for CEP processes, the efficiency for these events to survive an upper limit on ln(ξHRC) is also indicated.
5.2
Study of the performance on continuum-dimuon production
In order to enhance the CEP candidates in an event sample, an upper limit on ξHRCshould be chosen. Continuum-dimuon production, an abundant CEP process with a comparatively clear experimental signature, is used to assess the efficiency of such a limit. This process takes place by two-photon exchange between the protons, and results in a very soft spectrum in p2
)
HRCξ
ln(
0 2 4 6 8 10Arb. units
0 0.2 0.4 0.6 0.8 1 L HE RSC E LHCb H Efficiency 0 0.2 0.4 0.6 0.8 1Figure 14: Distribution of HeRSCheL metric for events immediately following a bunch train (black line), representative of the response of the detector to CEP signal. The efficiency for an upper limit on the metric for retention of these events is also shown (red line).
dimuon candidates the CEP component may be reliably isolated.
A sample of dimuon candidates is selected in data collected during 2015. The fraction of single-interaction CEP candidates within this sample, originating from an event where only a single pp interaction is detected, is enhanced by making standard trigger require-ments and imposing limits on the activity in the other LHCb sub-detectors. Specifically only events with exactly two tracks, satisfying standard LHCb muon-identification re-quirements, are allowed in this two-track sample. The invariant mass of the candidate, shown in Fig. 15(a), is chosen to exclude regions of resonant production, which proceeds by a different CEP mechanism and does not have the same p2
T distribution. The p2T
distri-bution of the sample is shown in Fig. 15(b). On Fig. 15(b) a second distridistri-bution has been superimposed corresponding to the p2
T distribution for dimuon candidates selected in the
same way, but where one additional VELO track is required. This category of events is unlikely to be CEP and thus in the case that an additional VELO track is detected, this provides a representation of the background distribution. This distribution is normalised such that the number of background candidates above 0.75 GeV2/c2 matches the number
for the same range in the two-track sample. The very low p2T region, where continuum-dimuon CEP is expected to be concentrated, is magnified in the inset histogram.
These samples are used to obtain the response of the HeRSCheL metric to exclu-sive continuum-dimuon production. The distribution of the natural logarithm of ξHRC
in the background sample is represented by the dashed line in Fig. 16(a). To visualise the ln(ξHRC) response for CEP signal, the distribution is first obtained for dimuon
can-didates with p2T below 0.1 GeV2/c2 in the signal sample. The background shape can be subtracted from this distribution according to the number of events in the background
) 2 ) (GeV/c -µ + µ m( 2 4 6 8 ) 2 Candidates / (32.5 MeV/c 1 10 2 10 3 10 4 10 5 10 6 10 (a) L HE RSC E LHCb H ) 2 /c 2 (GeV 2 T p 0 0.5 1 1.5 2 ) 2 /c 2 Candidates / (0.004 GeV 0 500 1000 1500 2000 2500 (b) L HE RSC E LHCb H
No extra VELO tracks 1 extra VELO track (background)
) 2 (GeV 2 T p 0 0.02 0.04 0.06 0.08 0.1 ) 2 /c 2 Candidates / (500 MeV 2 10 3 10
Figure 15: Selected continuum-dimuon sample. In (a) is shown the invariant mass distribution of dimuon candidates. The shaded regions of resonant production are excluded. In (b) is shown the full p2
T distribution of the selected dimuon candidates. Since the signal is expected to be
concentrated chiefly below 0.1 GeV2/c2, the candidates below this threshold are shown in the
inset histogram. For both regions, an additional histogram is superimposed, corresponding to the distribution of candidates in a background sample.
sample, again normalised in the high-p2
T region. The signal response is shown as the solid
line in Fig. 16(a). It is interesting to note that the background sample has a peak at low values of ln(ξHRC), a feature which can be explained by the presence of background
where all additional activity associated with, for example, proton dissociation lies outside the HeRSCheL acceptance. The significant tail in HeRSCheL activity seen even for ‘CEP signal’ appears because, although the activity in the LHCb spectrometer is con-sistent with only one visible pp interaction there, a second pile-up interaction may still occur producing activity only in the geometrical acceptance covered by the HeRSCheL detector.
In order to obtain the signal efficiency of a given limit on activity in the HeRSCheL detector, the continuum-dimuon sample can again be used. This time a fit is performed to the p2
Tdistribution of signal candidates. A template is taken from simulated samples to
represent the signal component. Studies of the three-track background sample and other, associated, data sets give confidence that the background component can be well-modelled using a probability density function (PDF) consisting of two exponential shapes. To obtain the efficiency of the HeRSCheL activity limit on the continuum-dimuon CEP signal, the p2T distribution is fit with a PDF containing the signal template and the background model, where the slope parameters of the background exponentials are free to vary along with their relative fraction. One such fit is shown, for illustration, in Fig. 16(b). The effect on the exclusive-signal yield of changing the HeRSCheL veto is determined and shown in Fig. 16(c), where the uncertainty is systematically dominated.
It is of interest to consider the effect of the HeRSCheL activity limit on the back-ground component, although it should be noted that the kinematic properties and likely HeRSCheL response to the background are rather specific to the production mode under
consideration. The effect of the HeRSCheL activity limit in suppressing the background in this specific sample is also shown in Fig. 16(c), where the uncertainty receives compa-rable contributions from statistical and systematic sources.
An illustrative veto on activity in HeRSCheL is chosen, consisting of an upper limit on ln(ξHRC) at 4.9. The signal efficiency for continuum-dimuon production at this
work-ing point is 84% accordwork-ing to Fig. 16(c) and, as seen in the same study, 65% of the background is rejected. It is clear from Fig. 14 that the intrinsic HeRSCheL efficiency for selection of empty events at this working point is nearly 100%. The difference be-tween the empty-event selection efficiency and the measured efficiency for selection of CEP continuum-dimuon candidates arises because a limit on activity in the HeRSCheL detector also suppresses events where additional, pile-up pp interactions take place. Such additional pile-up pp interactions, if the resulting particle production escapes the stan-dard spectrometer acceptance but enters the HeRSCheL detector, would be likely to produce a background-like signature in some fraction of events also containing a genuine CEP candidate. ) HRC ξ ln( 0 5 10 Arb. units 0 0.2 0.4 0.6 0.8 1 Signal Background (a) L HE RSC E LHCb H 2 /c 2 GeV 2 T p 0 0.1 0.2 0.3 0.4 0.5 ) 2 /c 2 Candidates / (0.02 GeV 2 10 3 10 Data Background CEP signal + background
(b) L HE RSC E LHCb H ) limit HRC ξ ln( 3 4 5 Efficiency / Rejection 0 0.1 0.2 0.3 0.4 0.5 0.6 0.7 0.8 0.9 1 (c) L HE RSC E LHCb H Signal efficiency Background rejection
Figure 16: In (a) the distribution of ln(ξHRC) is shown for CEP (solid line) and non-CEP
(dashed line) continuum-dimuon candidates. In (b) an example fit to the continuum-dimuon
p2T distribution is shown, with the CEP signal template and double-exponential background
indicated. In (c) the CEP signal efficiency and, for this process, background rejection are shown
5.3
Study of the performance on J/ψ photoproduction
The effect of the limit placed on ξHRC can be considered for the case of resonant dimuon
production, near the J/ψ mass indicated by the first shaded region in Fig. 15(a). In this case, the production mechanism is predominantly photoproduction, neglecting a very small contamination from continuum-dimuon production in this region, and the exclusive J/ψ candidate p2Tdistribution extends to higher values, even up to 1 GeV2/c2. The effect of placing a limit on ln(ξHRC) of 4.9, chosen to have a signal efficiency of approximately 84%
according to the continuum-dimuon studies, is shown for the distribution of J/ψ candidate p2T in Fig. 17. The background yield, determined by the number of candidates in the high p2
T region above 1 GeV2/c2, where little J/ψ CEP signal is expected, is reduced to less
than a third of its original value. A similar suppression is expected in the background component at lower p2T, and a corresponding improvement in the signal purity. The background rejection that is achieved at a particular HeRSCheL working point depends on the production process for that background, hence for this process the HeRSCheL cut is more effective in suppressing background than in the continuum-dimuon study.
) 2 /c 2 ) (GeV ψ (J/ 2 T p 0 0.5 1 1.5 2 ) 2 /c 2 Candidates / (0.02 GeV 102 3 10 Without Herschel With Herschel L HE RSC E LHCb H
Figure 17: Effect on the p2T distribution of J/ψ CEP candidates of applying a limit of 4.9 on
ln(ξHRC). This cut is expected to retain close to 100% of CEP signal which have no additional
tracks due to pile-up or single diffractive events in the combined LHCb and HeRSCheL geo-metrical acceptance. This corresponds to about 84% of the events which would be accepted if only the LHCb geometrical acceptance was used. At this working point, the yield of non-CEP J/ψ candidates falls to nearly a third of the original value.
6
Employing HeRSCheL in the LHCb trigger
The LHCb trigger is divided into a low-level hardware trigger and a higher-level soft-ware trigger. In 2016 HeRSCheL information was introduced into the softsoft-ware trigger. Specifically, a loose limit is placed on the sum of ADC counts for the counters in each sta-tion. The distributions of the sum of ADC counts from each station are shown in Fig. 18 for events which pass the hardware trigger relevant for hadronic CEP. The portion of the
distribution rejected is indicated. This conservative limit, far above the empty-detector portion of the distribution, allows for the trigger rate to be reduced by nearly a factor of two, allowing for other constraints to be relaxed in order to select hadronic CEP signals more efficiently. Work is ongoing to include HeRSCheL information in the hardware trigger.
B0 sum ADC counts
0 1000 2000 3000 4000 Arb. units 3 − 10 2 − 10 1 − 10 L0 Hadron CEP Rejected by HLT Herschel veto
L
HE
RSC
E
LHCb H
B1 sum ADC counts
0 1000 2000 3000 4000 Arb. units 3 − 10 2 − 10 1 − 10 LHCb HERSCHEL
B2 sum ADC counts
0 1000 2000 3000 4000 Arb. units 3 − 10 2 − 10 1 − 10 L HE RSC E LHCb H
F1 sum ADC counts
0 1000 2000 3000 4000 Arb. units 2 − 10 1 − 10 LHCb HERSCHEL
F2 sum ADC counts
0 1000 2000 3000 4000 Arb. units 3 − 10 2 − 10 1 − 10 LHCb HERSCHEL
Figure 18: HeRSCheL in the LHCb software trigger. Distributions of the sum of ADC counts recorded by the four counters in each station. The portion of events rejected by the limit in each station is indicated by the filled region.
7
Conclusion and outlook
A new sub-detector has been constructed, installed and commissioned in the LHC tunnel in order to extend the rapidity coverage of the LHCb experiment in the high-rapidity re-gions either side of the interaction point during Run 2 of the LHC. Five stations have been installed up to a maximum distance of approximately 114 m from the interaction point. The HeRSCheL detector extends the LHCb forward coverage up to a pseudorapidity of around 10.
The physics impact of the new detector has been described; in particular HeRSCheL allows for significant improvement in the suppression of the most problematic backgrounds in studies of Central Exclusive Production at LHCb, whilst maintaining high signal effi-ciency. The new detector is already in use in the LHCb software trigger for CEP processes, and will be integrated at the hardware level in the L0 trigger chain in the near future.
Acknowledgements
We thank all our LHCb collaborators who have contributed to the design, construction, commissioning, and operation of HeRSCheL, in particular J. Buytaert, P. Dziurdzia, C. Gaspar, A. Granik, Yu. Guz, C. Joram, F. Machefert, P. Robbe, and B. Schmidt. Fur-thermore we are grateful to J. Bernhard from the COMPASS collaboration who provided us with the PMT housings. We express our gratitude to our colleagues in the CERN accelerator departments for the excellent performance of the LHC. We thank the tech-nical and administrative staff at the authors’ institutes. We acknowledge support from CERN and from the national agencies: CAPES, CNPq, FAPERJ and FINEP (Brazil); CNRS/IN2P3 (France); MNiSW and NCN (Poland); MinES and FASO (Russia); MinECo (Spain); STFC (United Kingdom). We acknowledge the computing resources that are provided by CERN, IN2P3 (France), KIT and DESY (Germany), INFN (Italy), SURF (The Netherlands), PIC (Spain), GridPP (United Kingdom), RRCKI and Yandex LLC (Russia), CSCS (Switzerland), IFIN-HH (Romania), CBPF (Brazil), PL-GRID (Poland) and OSC (USA). We are indebted to the communities behind the multiple open-source software packages on which we depend.
References
[1] M. G. Albrow, T. D. Coughlin, and J. R. Forshaw, Central Exclusive Particle Pro-duction at High Energy Hadron Colliders, Prog. Part. Nucl. Phys. 65 (2010) 149, arXiv:1006.1289.
[2] CDF, M. G. Albrow, Central Exclusive Production at the Tevatron, Int. J. Mod. Phys. A29 (2014), no. 28 1446009, arXiv:1409.0462.
[3] HERSCHEL Team, FSC Team, CMS, LHCb, M. Albrow, P. Collins, and A. Penzo, Forward shower counters for diffractive physics at the LHC, Int. J. Mod. Phys. A29 (2014), no. 28 1446018.
[4] LHCb collaboration, R. Aaij et al., LHCb detector performance, Int. J. Mod. Phys. A30 (2015) 1530022, arXiv:1412.6352.
[5] LHCb collaboration, R. Aaij et al., Exclusive J/ψ and ψ(2S) production in pp colli-sions at √s = 7 TeV , J. Phys. G40 (2013) 045001, arXiv:1301.7084.
[6] LHCb collaboration, R. Aaij et al., Observation of charmonium pairs produced ex-clusively in pp collisions, J. Phys. G41 (2014) 115002, arXiv:1407.5973.
[7] LHCb collaboration, R. Aaij et al., Updated measurements of exclusive J/ψ and ψ(2S) production cross-sections in pp collisions at √s = 7 TeV , J. Phys. G41 (2014) 055002, arXiv:1401.3288.
[8] LHCb collaboration, R. Aaij et al., Measurement of the exclusive Υ(nS) production cross-section in pp collisions at √s = 7 TeV and 8 TeV , JHEP 09 (2015) 084, arXiv:1505.08139.
[9] H. S. Matis et al., The BRAN luminosity detectors for the LHC, arXiv:1612.01238. [10] M. Clemencic et al., The LHCb simulation application, Gauss: Design, evolution and
experience, J. Phys. Conf. Ser. 331 (2011) 032023.
[11] T. Sj¨ostrand, S. Mrenna, and P. Skands, A brief introduction to PYTHIA 8.1, Com-put. Phys. Commun. 178 (2008) 852, arXiv:0710.3820.
[12] Geant4 collaboration, S. Agostinelli et al., Geant4: A simulation toolkit, Nucl. In-strum. Meth. A506 (2003) 250.
[13] Geant4 collaboration, J. Allison et al., Geant4 developments and applications, IEEE Trans. Nucl. Sci. 53 (2006) 270.
[14] C. Beigbeder-Beau et al., The LHCb calorimeter front-end crate, LHCb-2003-038. [15] D. Breton and D. Charlet, SPECS: the Serial Protocol for the Experiment Control
System of LHCb, LHCb-2003-004.
[16] G. Haefeli et al., The LHCb DAQ interface board TELL1, Nucl. Instrum. Meth. A560 (2006) 494.