Publisher’s version / Version de l'éditeur:
Proceedings of SPIE, 7386, pp. 73860I-1-73860I-7, 2009-08
READ THESE TERMS AND CONDITIONS CAREFULLY BEFORE USING THIS WEBSITE. https://nrc-publications.canada.ca/eng/copyright
Vous avez des questions? Nous pouvons vous aider. Pour communiquer directement avec un auteur, consultez la
première page de la revue dans laquelle son article a été publié afin de trouver ses coordonnées. Si vous n’arrivez pas à les repérer, communiquez avec nous à PublicationsArchive-ArchivesPublications@nrc-cnrc.gc.ca.
Questions? Contact the NRC Publications Archive team at
PublicationsArchive-ArchivesPublications@nrc-cnrc.gc.ca. If you wish to email the authors directly, please see the first page of the publication for their contact information.
NRC Publications Archive
Archives des publications du CNRC
This publication could be one of several versions: author’s original, accepted manuscript or the publisher’s version. / La version de cette publication peut être l’une des suivantes : la version prépublication de l’auteur, la version acceptée du manuscrit ou la version de l’éditeur.
For the publisher’s version, please access the DOI link below./ Pour consulter la version de l’éditeur, utilisez le lien DOI ci-dessous.
https://doi.org/10.1117/12.840500
Access and use of this website and the material on it are subject to the Terms and Conditions set forth at
A single-photon fluorescence and multi-photon spectroscopic study of
atherosclerotic lesions
Smith, Michael S. D.; Ko, Alex C. T.; Ridsdale, Andrew; Schattka, Bernie;
Pegoraro, Adrian; Hewko, Mark D.; Shiomi, Masashi; Stolow, Albert; Sowa,
Michael G.
https://publications-cnrc.canada.ca/fra/droits
L’accès à ce site Web et l’utilisation de son contenu sont assujettis aux conditions présentées dans le site LISEZ CES CONDITIONS ATTENTIVEMENT AVANT D’UTILISER CE SITE WEB.
NRC Publications Record / Notice d'Archives des publications de CNRC:
https://nrc-publications.canada.ca/eng/view/object/?id=8814f441-1bb0-42cf-a252-3aee48a3151d https://publications-cnrc.canada.ca/fra/voir/objet/?id=8814f441-1bb0-42cf-a252-3aee48a3151d
A single-photon fluorescence and multi-photon spectroscopic study of
atherosclerotic lesions
Michael S.D. Smith
1*, Alex C.T. Ko
1, Andrew Ridsdale
2, Bernie Schattka
1, Adrian Pegoraro
2, Mark
D. Hewko
1, Masashi Shiomi
3, Albert Stolow
2, and Michael G. Sowa
11
Institute for Biodiagnostics, National Research Council Canada, Winnipeg, Canada
2Steacie Institute for Molecular Sciences, National Research Council Canada, Ottawa, Canada
3Institute for Experimental Animals, Kobe University School of Medicine, Japan
*
e-mail: Michael.Smith@nrc-cnrc.gc.ca
ABSTRACT
In this study we compare the single-photon autofluorescence and multi-photon emission spectra obtained from the luminal surface of healthy segments of artery with segments where there are early atherosclerotic lesions. Arterial tissue was harvested from atherosclerosis-prone WHHL-MI rabbits (Watanabe heritable hyperlipidemic rabbit-myocardial infarction), an animal model which mimics spontaneous myocardial infarction in humans. Single photon fluorescence emission spectra of samples were acquired using a simple spectrofluorometer set-up with 400 nm excitation. Samples were also investigated using a home built multi-photon microscope based on a Ti:sapphire femto-second oscillator. The excitation wavelength was set at 800 nm with a ~100 femto-second pulse width. Epi-multi-photon spectroscopic signals were collected through a fibre-optics coupled spectrometer. While the single-photon fluorescence spectra of
atherosclerotic lesions show minimal spectroscopic difference from those of healthy arterial tissue, the multi-photon spectra collected from atherosclerotic lesions show marked changes in the relative intensity of two-photon excited fluorescence (TPEF) and second-harmonic generation (SHG) signals when compared with those from healthy arterial tissue. The observed sharp increase of the relative SHG signal intensity in a plaque is in agreement with the known pathology of early lesions which have increased collagen content.
Keywords: multi-photon microscopy, atherosclerosis, two photon excited fluorescence, second harmonic generation,
intrinsic fluorescence
1. INTRODUCTION
Atherosclerosis is the primary cause of heart disease and stroke. It is a chronic progressive disease triggered by hypercholesterolemia and associated with plaque accumulation in the arteries1,2,3. Early consequences of the disease include a thickening of the arterial wall and the appearance of fatty streaks on the vessel. In more advanced disease, vascular smooth muscle cells and a fibrous collagen-elastin network form to encapsulate lipid pools.
Multi-photon microscopy may be used to simultaneously image three different structures important to atherogenesis. Elastin, type-I collagen, and lipid structures are imaged by collecting, respectively, two-photon excited fluorescence (TPEF), second harmonic generation (SHG) and coherent anti-Stokes Raman scattering (CARS) signals4,5. The
technique requires no stains to be added to the tissue and can be performed in an epi-configuration, obviating the need to prepare the tissue in thin sections. These features make multi-photon microscopy a very convenient tool for the study of atherogenesis. For this study we modified our photon microscope, coupling the epi-collected signals into a multi-mode fiber. This modification allowed for collection of either multi-photon images or multi-photon spectra. Using an excitation wavelength of 800 nm multi-photon spectra were acquired over wavelengths 300-600 nm, a spectral range that included both the SHG and TPEF signals. The relative intensities of these two signals and the shape of the TPEF spectra for atherosclerotic plaques were found to differ from those of healthy arterial tissue.
Elastin and collagen are known to emit intrinsic photon autofluorescence. For this study we collected single-photon fluorescence emission spectra for healthy arterial tissue and atherosclerotic plaques using an excitation wavelength of 400 nm. While a general difference in the intensities of the fluorescence spectra collected from these different types of tissue was observed, little difference was found in their spectral shapes.
2. EXPERIMENTAL 2.1 Arterial tissue samples and sample preparation
All animal experiments conformed to the guidelines set out by the Canadian Council on Animal Care regarding the care and use of experimental animals and were approved by the local Animal Care Committee of the National Research Council of Canada. This study uses the myocardial infarction prone Watanabe heritable hyperlipidemic (WHHL-MI) rabbit model6 which due to a hereditary defect in LDL processing develops atherosclerotic plaques without the
requirement of diet modification. Arterial tissue examined in this study came from two rabbits, one 8 months old and the other 22 months old. The rabbits were raised in the Institute for Experimental Animals, Kobe University School of Medicine (Kobe, Japan). After sacrificing each rabbit the aorta was dissected from the ascending aorta to the femoral arteries then cut into sections 20 to 30 mm in length. Each piece was wrapped in aluminum foil, snap frozen in liquid nitrogen, placed in a plastic freezer bag and stored in a -80 Celsius freezer. The frozen tissue was transported to National Research Council Institute for Biodiagnostics (Winnipeg, Canada) on dry ice in an insulated shipping container. Before measurement, tissue samples were thawed then cut open longitudinally exposing the luminal surface. The samples were placed on moist tissue in petri dishes with the luminal surface facing up. Hydration was maintained throughout the measurements by periodically applying phosphate buffered saline (PBS) solution. Digital photos of the luminal surface were acquired and regions of interest identified prior to measurements. Sample points consisting of arterial plaques and regions of healthy arterial tissue were identified for spectral measurements..
2.2 Single photon fluorescence spectra acquisition
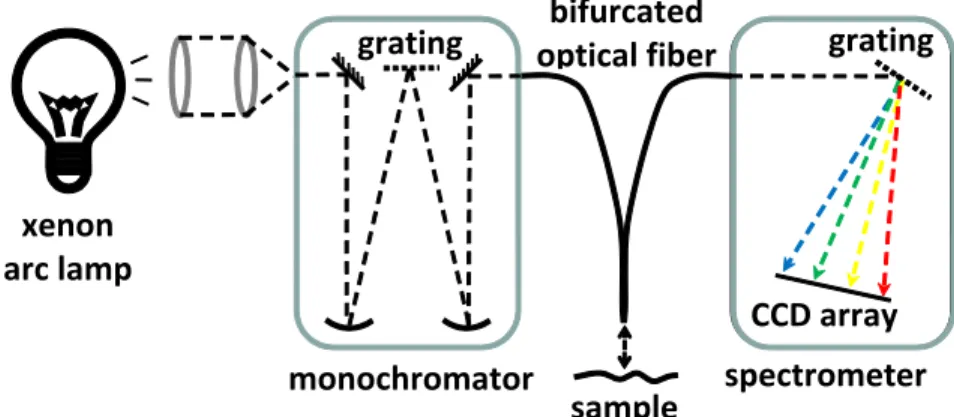
Single photon fluorescence spectra were collected using the spectrofluorometer system illustrated in Figure 1. Source light was provided by a xenon arc lamp (Oriel Instruments, USA). Light from the lamp was directed into a
monochromator (CVI Laser Corporation, USA) to select an excitation wavelength of 400 nm. A bifurcated optical fiber was used to deliver the excitation light to the sample and to collect fluorescence and other back-scattered light coming off of the sample. The sample end of the fiber was directed at the sample area of interest and kept perpendicular to the luminal surface at a height of ~1 mm. The emission arm of the bifurcated optical fiber was connected to a CCD-array based spectrometer (B&W Tek, USA) with a spectral range of 300-600 nm. Excitation wavelength and emission spectra collection were controlled by in-house software written in Matlab (The MathWorks, USA). In addition to acquiring emission spectra at each sample point the monochromator was set to zeroth order and reflectance spectra were acquired. Corresponding reference spectra were acquired using a diffuse reflectance standard (Labsphere, USA) so that attenuation spectra could be calculated for each sample point. Corrected fluorescence spectra of the arterial wall were obtained by dividing the experimental fluorescence spectra with corresponding attenuation spectra.
Figure 1: Schematic of spectrofluorometer set-up for acquisition of single-photon fluorescence emission spectra.
xenon
arc lamp
CCD array
grating
monochromator
sample
grating
optical fiber
bifurcated
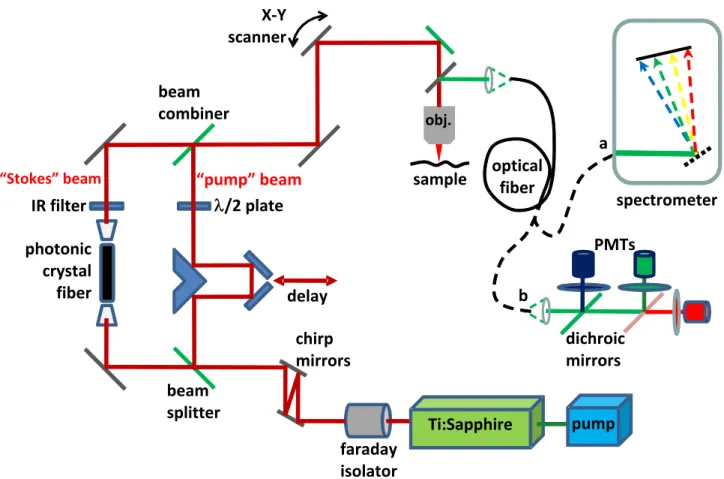
Figure 2: Schematic of home built multi-photon microscope modified for two-photon spectral acquisition. Light emitted
from the sample in the epi-direction is coupled into an optical fiber. The fiber can be connected to either a) a spectrometer for spectral acquisition or b) the array of PMTs, dichroic mirrors, and color filters used for multi-photon imaging.
2.3 Multi-photon spectra and image acquisition
Samples were also investigated using a home built multi-photon laser scanning microscope modified to allow spectral acquisition. A schematic of the modified microscope system is provided in Figure 2. The laser source comprised a 532 nm laser (Spectra-Physics, USA) operating at 7.25 W pumping a Ti:Sapphire oscillator (Spectra-Physics, USA). Output pulses from the oscillator were centered at 800 nm with a pulse width of ~100 fs and average power of 1.1 W. The output femto-second laser pulses were passed through a Faraday isolator (Newport, USA) and a pair of GTI laser mirrors (Layertec GmbH, Germany) then split into “pump” and “Stokes” pulses using a 50/50 beam splitter. The reflected pump pulses propagated through a series of lenses and mirrors including an optical delay stage before re-combining with the Stokes pulses. The transmitted pulses were coupled into a photonic crystal fiber (NL-1.4-775-945, Crystal Fibre, Denmark) to generate a broadband emission. A bandpass filter was used to select the near infra-red portion of the broadband emission for use as the Stokes pulses necessary for generating the CARS signal. The pump and Stokes pulses were combined and directed into the microscope assembly. Two scanning mirrors directed the laser pulses to the sample area of interest. The pulses were focused onto the sample through a 20x, 0.75 NA infinity-corrected air objective lens (Olympus, Japan) and the back scattered (epi-)signals were collected through the same objective lens. Collected light was coupled into a multi-mode fiber to allow for the acquisition of either spectra or images. For spectral acquisition the end of the fiber was connected to the same CCD-array based spectrometer used in the single photon set-up. The spectrometer collected spectra over a wavelength range covering that of the emitted TPEF and SHG signals but not the CARS signal. For image acquisition the proximal end of the fiber was connected to an array of PMTs (Hamamatsu, Japan), dichroic mirrors and color filters normally used for free-space microscopic imaging in the epi-detection configuration. Three PMTs simultaneously detected the TPEF, SHG, and CARS signals. Image acquisition and laser
λ/2 plate
X-Y
scanner
obj.Ti:Sapphire
pump
faraday
isolator
chirp
mirrors
delay
beam
combiner
beam
splitter
dichroic
mirrors
PMTs
photonic
crystal
fiber
IR filter
“pump” beam
sample
optical
fiber
spectrometer
a
b
“Stokes” beamscanning were controlled using ScanImage software7 (Cold Spring Harbour Laboratory, USA). Post image processing and image viewing were carried out in ImageJ (National Institutes of Health, USA) and Matlab.
At each sample point multi-photon spectra and images were collected at the surface of the sample and then every 10 µm going into the sample until the signal started to disappear, usually at about 100 µm. Typically 150 mW of pump and 30 mW of Stokes (measured before the microscope assembly) were used for imaging. Using the 20x objective lens the scanned area was approximately 400x400 µm and 5 images of 256x256 pixels were acquired at each depth and averaged together. During spectral acquisition the Stokes beam was blocked and the microscope was set to a continuous scanning mode so each spectrum represents a bulk sampling of a 400x400 µm area at a particular depth.
3. RESULTS
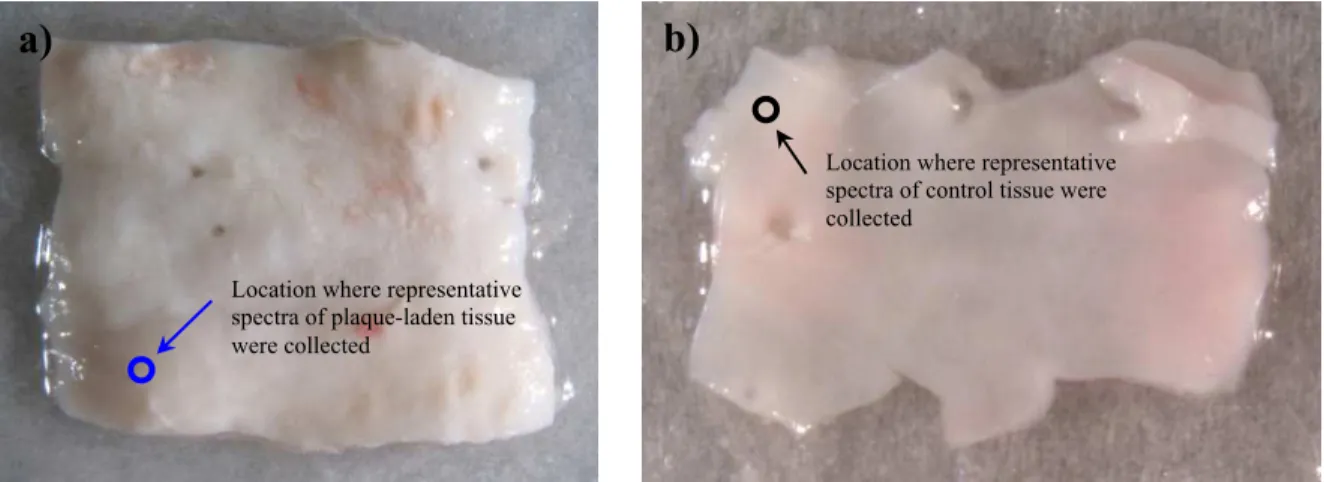
Digital photographs of the two representative sections of aorta that were measured from the 22 month old rabbit are shown in Figure 3. Figure 3(a) shows a section of the aorta that was more proximal to the heart and is almost completely covered in plaque. Figure 3(b) shows a section of the aorta that was more distal to the heart and is almost entirely free of lesions with only a few fatty streaks in the upper right portion of the image. The circles in Figure 3(a) and 3(b) mark the locations where the representative spectra of plaque-laden tissue and healthy tissue presented in this paper were
collected.
Figure 3: Measured sections of aorta from 22 month old WHHL-MI rabbit a) from more proximal to the heart, this section
is almost completely covered in plaque b) from more distal to the heart, this section is almost entirely free of plaque.
3.1 Single-photon fluorescence and multi-photon spectra obtained from arterial tissues
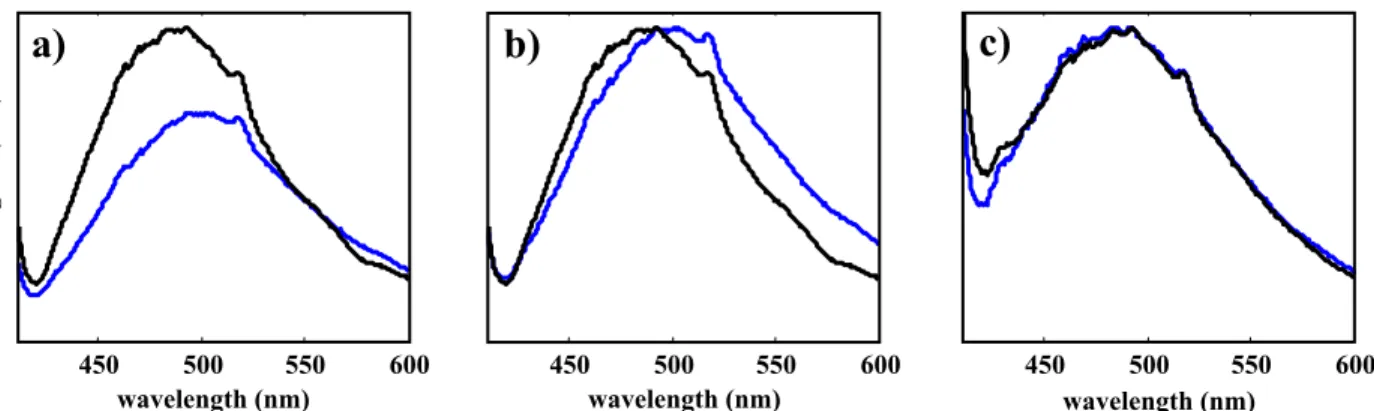
Representative single photon fluorescence spectra collected from plaque-laden arterial tissue and healthy tissue are illustrated in Figure 4. In general, healthy tissue produced a stronger fluorescence signal than plaque-laden tissue. Looking at the normalized spectra in Figure 4(b) one can see differences in the profile of the fluorescence spectrum of healthy tissue compared to that of the plaque-laden tissue. However, when the measured attenuation of the tissue samples is taken into account as in Figure 4(c) the differences between the spectral profiles tend to disappear.
a)
b)
Location where representative spectra of plaque-laden tissue were collected
Location where representative spectra of control tissue were collected
Figure 4: Representative single photon fluorescence spectra of control tissue (black) and plaque-laden tissue (blue) a)
unmodified spectra b) spectra normalized to the fluorescence peak c) spectra corrected for attenuation and normalized to the fluorescence peak
Representative multi-photon fluorescence spectra are plotted in Figure 5. Two peaks are visible in each of these spectra. The peak centered at 400 nm is due to SHG. The peak centered at ~500 nm is due to TPEF. As was observed with the single-photon fluorescence, the TPEF signal was generally higher in healthy arterial tissue than in plaque-laden tissue. When the spectra are normalized to the TPEF peaks as in Figure 5(b) the difference in the relative intensities of the two peaks becomes apparent. In all but one case the TPEF peak intensity was higher than the SHG peak intensity for healthy tissue and in all cases the SHG peak intensity was higher than the TPEF peak intensity for plaque-laden tissue. Looking again at the normalized spectra there is also a difference in the shape of the two TPEF spectra, especially above ~510 nm.
Figure 5: Representative multi-photon spectra for control tissue (black) and plaque-laden tissue (blue) a) unmodified spectra b)
spectra normalized to TPEF peak
3.2 Multi-photon fiber-coupled imaging
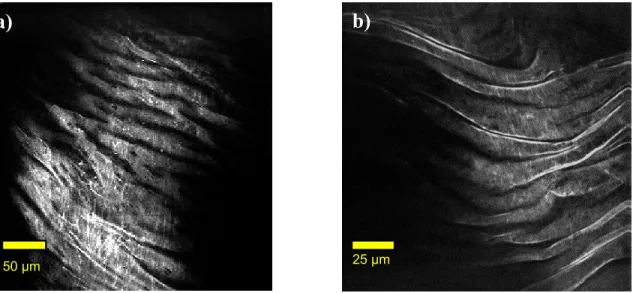
Multi-photon images collected using the fiber-coupled configuration revealed similar features to what we have previously reported for the free space epi-detection configuration5. The structure of the internal elastic lamina was evident in the TPEF images of healthy regions of vessel. The internal elastic lamina was not seen in images of atherosclerotic lesions. For some plaques collagen fibrils were seen in the SHG images and for all plaques, lipid-rich structures were visible in the CARS images (not shown).
Figure 6(a) is a TPEF image of a healthy region of vessel wall acquired using the fiber configuration while for comparison Figure 6(b) is a TPEF image of similar tissue acquired using the free-space microscopic epi-detection configuration with no fiber. The multi-photon signals collected using the fiber-coupled configuration were not as intense
400 450 500 550 600 wavelength (nm) si gn al (a.u .) 400 450 500 550 600 wavelength (nm)
SHG
TPEF
a) b)
450 500 550 600 wavelength (nm) si gn al (a.u .) 450 500 550 600 wavelength (nm) 450 500 550 600 wavelength (nm)a) b) c)
as those collected using the free-space configuration thus leading to a lower SNR in the images acquired using the fibre-coupled configuration.
Figure 6: Representative TPEF images showing structure of internal elastic lamina of arterial samples a) acquired using the
fiber-coupled configuration b) acquired using the free-space microscopic configuration for epi-detection
4. DISCUSSION AND CONCLUSIONS
Using a 400 nm excitation wavelength, single photon fluorescence intensity was found to be generally higher in healthy arterial tissue than in plaque-laden tissue. Unfortunately, the intensity of the fluorescence signal is highly dependent on probe positioning and sample geometry which are difficult to control and keep consistent from one sample to the next making the technique difficult to use to routinely distinguish healthy from plaque-laden tissue. There initially appeared to be some difference between the profiles of the fluorescence spectra of healthy and plaque-laden tissue, however, it seems that this difference is caused primarily by absorption in the tissue rather than by a difference in the intrinsic fluorescence.
Differences were observed between the multi-photon spectra of healthy arterial tissue and those of plaque-laden tissue. Two features of these spectra that are independent of laser power and sample geometry could be useful in distinguishing between these types of tissue. One is the relative intensities of the TPEF and SHG signals and the other is the difference in the spectral profiles of the TPEF spectra especially in the wavelength range of 510-600 nm.
It was demonstrated that epi-detected multi-photon signals could be coupled into an optical fiber and useful SHG, TPEF, and CARS images collected. Collection of these images required higher laser powers and longer acquisition times than collection of comparable images using a free-space imaging configuration.
REFERENCES
1
Libby, P., “Atherosclerosis: Disease Biology Affecting the Coronary Vasculature”, Am. J. Cardiol 98[suppl]: 3Q-9Q (2006).
2
Hansoon, G. K., “Inflammation, Atherosclerosis, and Coronary Artery Disease”, N. Engl J Med 352, 1685-95 (2005).
3
Lusis, A. J., “Atherosclerosis”, Nature (London) 407, 233-241, (2000).
4
Le, T. T., Langohr, I. M., Locker, M. J., Sturek, M. and Cheng, J.-X., “Label-free molecular imaging of atherosclerotic lesions using multimodal nonlinear optical microscopy”, J. Biomed. Opt. 12(5): 054007 (2007).
25 µm 50 µm
5
Ko, A. C.-T., Ridsdale, A., Pegoraro, A. F., Smith, M. S. D., Mostaço-Guidolin, L. B., Hewko, M. D., Kohlenberg, E. M., Schattka, B. J., Shiomi, M., Stolow, A. and Sowa, M. G., “Label-free imaging of arterial tissues using photonic crystal fiber (PCF) based nonlinear optical microscopic system,” Imaging, Manipulation, and Analysis of
Biomolecules, Cells, and Tissues VII. Proc. SPIE Vol. 7182: 718204 (2009).
6
Shiomi, M., Ito, T., Yamada, S., Kawashima, S. and Fan, J., “Development of an Animal Model for Spontaneous Myocardial Infarction (WHHLMI Rabbit),” Arterioscler Thromb Vasc Biol, 23(7), 1239-1244 (2003).
7
Pologruto, T. A., Sabatini, B. L and Svoboda, K., “ScanImage: Flexible software for operating laser scanning microscopes,” BioMedical Engineering Online 2, 13 (2003).