HAL Id: hal-01893498
https://hal.uca.fr/hal-01893498
Submitted on 11 Oct 2018
HAL is a multi-disciplinary open access
archive for the deposit and dissemination of
sci-entific research documents, whether they are
pub-lished or not. The documents may come from
teaching and research institutions in France or
abroad, or from public or private research centers.
L’archive ouverte pluridisciplinaire HAL, est
destinée au dépôt et à la diffusion de documents
scientifiques de niveau recherche, publiés ou non,
émanant des établissements d’enseignement et de
recherche français ou étrangers, des laboratoires
publics ou privés.
convection-permitting aerosol microphysics simulations
in an idealised marine tropical domain
Céline Planche, Graham Mann, Kenneth Carslaw, Mohit Dalvi, John
Marsham, Paul Field
To cite this version:
Céline Planche, Graham Mann, Kenneth Carslaw, Mohit Dalvi, John Marsham, et al.. Spatial and
temporal CCN variations in convection-permitting aerosol microphysics simulations in an idealised
marine tropical domain. Atmospheric Chemistry and Physics, European Geosciences Union, 2017, 17
(5), pp.3371 - 3384. �10.5194/acp-17-3371-2017�. �hal-01893498�
www.atmos-chem-phys.net/17/3371/2017/ doi:10.5194/acp-17-3371-2017
© Author(s) 2017. CC Attribution 3.0 License.
Spatial and temporal CCN variations in convection-permitting
aerosol microphysics simulations in an idealised marine
tropical domain
Céline Planche1,a, Graham W. Mann1,2, Kenneth S. Carslaw1, Mohit Dalvi3, John H. Marsham1,2, and Paul R. Field1,3
1School of Earth and Environment, University of Leeds, Leeds, UK
2National Centre for Atmospheric Science, School of Earth and Environment, University of Leeds, Leeds, UK 3Met Office, Exeter, UK
anow at: Université Clermont Auvergne, Laboratoire de Météorologie Physique, OPGC/CNRS UMR 6016,
Clermont-Ferrand, France
Correspondence to:Céline Planche (celine.planche@uca.fr) and Graham Mann (g.w.mann@leeds.ac.uk)
Received: 15 September 2016 – Discussion started: 4 October 2016
Revised: 29 January 2017 – Accepted: 15 February 2017 – Published: 8 March 2017
Abstract. A convection-permitting limited area model with periodic lateral boundary conditions and prognostic aerosol microphysics is applied to investigate how concentrations of cloud condensation nuclei (CCN) in the marine boundary layer are affected by high-resolution dynamical and thermo-dynamic fields. The high-resolution aerosol microphysics– dynamics model, which resolves differential particle growth and aerosol composition across the particle size range, is ap-plied to a domain designed to match approximately a single grid square of a climate model. We find that, during strongly convective conditions with high wind-speed conditions, CCN concentrations vary by more than a factor of 8 across the domain (5–95th percentile range), and a factor of ∼ 3 at more moderate wind speed. One reason for these large sub-climate-grid-scale variations in CCN is that emissions of sea salt and dimethyl sulfide (DMS) are much higher when spa-tial and temporal wind-speed fluctuations become resolved at this convection-permitting resolution (making peak wind speeds higher). By analysing how the model evolves dur-ing spin-up, we gain new insight into the way primary sea salt and secondary sulfate particles contribute to the overall CCN variance in these realistic conditions, and find a marked difference in the variability of super-micron and sub-micron CCN. Whereas the super-micron CCN are highly variable, dominated by strongly fluctuating sea spray emitted, the sub-micron CCN tend to be steadier, mainly produced on longer timescales following growth after new particle formation in
the free troposphere, with fluctuations inherently buffered by the fact that coagulation is faster at higher particle concentra-tions. We also find that sub-micron CCN are less variable in particle size, the accumulation-mode mean size varying by ∼20 % (0.101 to 0.123 µm diameter) compared to ∼ 35 % (0.75 to 1.10 µm diameter) for coarse-mode particles at this resolution. We explore how the CCN variability changes in the vertical and at different points in the spin-up, showing how CCN concentrations are introduced both by the emis-sions close to the surface and at higher altitudes during strong wind-speed conditions associated to the intense convective period. We also explore how the non-linear variation of sea-salt emissions with wind speed propagates into variations in sea-salt mass mixing ratio and CCN concentrations, finding less variation in the latter two quantities due to the longer transport timescales inherent with finer CCN, which sedi-ment more slowly. The complex mix of sources and diverse community of processes involved makes sub-grid parameter-isation of CCN variations difficult. However, the results pre-sented here illustrate the limitations of predictions with large-scale models and the high-resolution aerosol microphysics– dynamics modelling system shows promise for future studies where the aerosol variations will propagate through to modi-fied cloud microphysical evolution.
1 Introduction
Aerosol particles affect the Earth’s climate system directly by scattering and absorbing shortwave and long-wave radia-tion and indirectly by influencing the albedo and lifetime of clouds (e.g. Lohmann and Feichter, 2005). Successive IPCC climate assessment reports (e.g. Forster et al., 2007; Myhre et al., 2013) have identified the radiative forcing due to aerosol– cloud interactions as having a high level of uncertainty that needs to be better constrained for improved prediction of an-thropogenic climate change.
Atmospheric aerosols, whether natural or anthropogenic, originate from two different pathways: directly emitted “pri-mary particles” (e.g. sea spray, in marine environments) and secondary particles, which are formed by nucleation, of-ten first requiring oxidation of gaseous precursors such as dimethyl sulfide (DMS). In general, the primary particle pop-ulation can be straightforwardly classified into natural (dust, sea spray, primary biogenic) or anthropogenic (e.g. carbona-ceous particles from fossil-fuel combustion sources). How-ever, this classification is not possible for secondary parti-cles because of the complex interactions and influences of gases with both natural and anthropogenic sources (such as sulfur dioxide) and the moderating influence of addi-tional semi-volatile species such as ammonia and nitric acid. In the marine boundary layer however, the dominant two sources of cloud condensation nuclei (CCN) are DMS and sea spray (e.g. Raes et al., 1993; O’Dowd and de Leeuw, 2007; Boucher et al., 2013) and the relative simplicity of this particular compartment of the atmosphere allows for the sys-tematic assessment of how two types of natural particles, pri-mary sea spray and secondary sulfate particles from DMS, influence aerosol–cloud interactions. Carslaw et al. (2013) highlight the importance of quantifying such natural aerosols in order to accurately characterise the anthropogenic radia-tive forcing via aerosol–cloud interactions.
Until recently, computational costs have tended to con-strain most climate models participating in international cli-mate assessment reports to treat aerosol–cloud interactions in a simplified way, with only the mass of several aerosol types transported. With this conventional approach, CCN (number) concentrations are derived from the transported masses based on an assumed size distribution for each type, often taken to be globally uniform (e.g. Jones et al., 2011). The need to represent aerosol–cloud interactions more realistically has been a major reason for the development of a new generation of composition–climate models with interactive aerosol mi-crophysics. The models transport both particle number con-centrations and component masses (e.g. sulfate, black car-bon) in multiple size classes (e.g. Mann et al., 2014), and allows for the representation of sources of primary and sec-ondary CCN explicitly. For example, the UK’s Earth System Model for CMIP6 (Coupled Model Intercomparison Project phase 6) includes the GLOMAP (Global Model of Aerosol Processes) aerosol microphysics module (Mann et al., 2010;
2012), which resolves differential particle growth and aerosol composition across the particle size range including internal mixtures via the computationally efficient modal aerosol dy-namics approach.
In order to understand how aerosols and clouds interact, it is important to assess how aerosol properties vary at finer spatial scales than are resolved in climate models, where both convective–dynamical and aerosol microphysical effects are likely to cause non-linear CCN variations. Whereas many modelling studies have assessed the main features of global variations in the aerosol particle size distribution (e.g. Ghan et al., 2001; Adams and Seinfeld, 2002; Spracklen et al., 2005) and several have explored aerosol–cloud interactions in regional-scale models (e.g. Bangert et al., 2011; Zubler et al., 2011; Yang et al., 2012), only a few studies (Ekman et al., 2004, 2006; Wang et al., 2011; Archer-Nicholls et al., 2016; Possner et al., 2016; Weigum et al., 2016) have explored the microphysical properties of aerosols, and their potential in-teractions with clouds, at resolutions of ∼ 1 km where con-vection is resolved.
It is known that deep convection can lead to transport of aerosols (e.g. Yin et al., 2012). In arid environments, cold-pool outflows from convection can be a major source of dust uplift, which is missed by large-scale models that parame-terise moist convection (Marsham et al., 2011, 2013; Pope et al., 2016). Similarly, it has been shown that over oceans such convectively generated flows can both increase gaseous DMS emission and transport, since the convection generates locally strong winds leading to high emissions that are then preferentially transported by the convection (Devine et al., 2006). There are, however, few model studies of aerosols in ocean environments with deep convection (e.g. Cui et al., 2011) or shallow convection (e.g. Kaufman et al., 2005).
The main objective of the current study is to assess spatial and temporal variations in aerosol properties in a convection-permitting resolution model (grid spacing ∼ 1 km), in partic-ular investigating the concentration range of different-sized CCN, considering potential implications for aerosol–cloud interactions simulated by current composition–climate mod-els. In order to characterise the influence of both the dynam-ics and aerosol microphysdynam-ics on cloud-relevant aerosol prop-erties, the GLOMAP aerosol microphysics scheme is applied at high resolution over an idealised three-dimensional trop-ical marine domain. The convection-permitting aerosol mi-crophysics simulations represent a highly realistic represen-tation of CCN variations (e.g. Yang et al., 2011), providing a ground-breaking research tool for investigating aerosol– cloud interactions. The model includes interactive emissions of DMS and sea spray and an online tropospheric chemistry scheme, ensuring the simulations include a comprehensive treatment of the combined effects from dynamical, chemical and aerosol-microphysics processes occurring in the marine boundary layer. This paper is organised as follows: after a de-scription of the UKCA (UK Chemistry and Aerosol) model and its high-resolution configuration in Sect. 2, simulation
results are described in Sect. 3. Section 4 summarises, con-cludes and discusses the findings.
2 Model description
2.1 The UK Chemistry and Aerosol (UKCA) model
The UKCA sub-model of the UK Met Office Unified Model (MetUM) is used (hereafter UM-UKCA), including the GLOMAP-mode aerosol microphysics scheme (Mann et al., 2010), which calculates the evolution of aerosol mass and number in several log-normal size modes. The scheme rep-resents each size mode as an internal mixture, with several aerosol components able to be simulated including sulfate (SU), sea salt (SS), dust (DU), black carbon (BC), and par-ticulate organic matter (POM; including primary and bio-genic secondary POM). Any number of modes (with a fixed standard deviation) and possible components can be tracked, but the simulations here apply the “standard” configuration used in UM-UKCA (e.g. as in Bellouin et al., 2013) with four components (SU, SS, BC, POM) in five modes (Ta-ble 1) and dust transported separately in the existing 6-bin MetUM scheme (Woodward, 2001). The aerosol processes are simulated in a size-resolved manner and include primary emissions, secondary particle formation by binary homoge-neous nucleation of sulfuric acid and water, growth by coagu-lation, hygroscopic growth, ageing, condensation and cloud-processing and removal by dry deposition, nucleation scav-enging, impaction scavscav-enging, and sedimentation. All the de-tails about the description of the different aerosol processes and the size distributions in UKCA are available in Mann et al. (2010, 2012).
The standard tropospheric chemistry configuration of UM-UKCA is used (O’Connor et al., 2014), which includes Ox–
HOx–NOy chemistry with degradation of methane, ethane
and propane. The implementation here also includes the ex-tension for aerosol precursor chemistry (as in Bellouin et al., 2013) for the oxidation of sulfur precursors DMS and SO2,
and produces secondary organic aerosols via gas-phase oxi-dation of a biogenic monoterpene tracer.
2.2 High-resolution configuration of UM-UKCA
The simulations are carried out with UM-UKCA applied in a high-resolution limited area model with periodic lat-eral boundary conditions, specifically applying the numer-ical weather prediction (NWP) configuration of MetUM GA4.0 (Walters et al., 2014). MetUM GA4.0 provides tracer transport, boundary-layer mixing, and large-scale cloud and precipitation, with UKCA simulating atmospheric chem-istry and aerosol processes. The limited area domain is centred close to the Equator (1.32◦N, 1.08◦E) and set to 240 km × 240 km with 1.5 km horizontal grid spacing. At this resolution, much of the convective-scale dynamics is re-solved, and the MetUM convection parameterisation
(Gre-gory and Rowntree, 1990) is not applied. Cloud microphysics is represented using a single-moment scheme (Wilson and Ballard, 1999). Even if the representation of some micro-physical processes may not be well captured compared to multi-moment microphysics schemes (Morrison et al., 2009; Igel et al., 2015), the operational NWP models, such as the MetUM (Wilkinson et al., 2012; Planche et al., 2015), gener-ally use single-moment microphysics schemes. In these ide-alised simulations the radiation scheme was switched off, with the model therefore evolving without a diurnal cycle in-troduced by the daily variation in solar insolation or in varia-tions in long-wave cooling. The prognostic aerosols analysed here also do not interact radiatively. We analyse CCN con-centrations, defined as soluble particles with the dry diame-ter Dp> 50 nm (supersaturation of 0.35 %, assuming a pure
sulfuric acid solution droplet), the size taken as represen-tative for activating nuclei in marine stratocumulus regions (e.g. O’Dowd et al., 1997). However, note that as well as being radiatively non-interactive, the CCN variations simu-lated by the model also do not feed through to modified cloud physics, with the investigation here exploring only variations in aerosol properties. A 73-level vertical grid is used up to a model top of 80 km, with 50 levels in the troposphere, 21 of which span the lowest 2 km of the atmosphere. The sim-ulation analysed here is over 24 h from an initial time of 09:00 UTC on 24 May 2002. Emissions are calculated on the simulation time step of 30 s with UKCA chemistry and aerosol processes integrated every 10 time steps, i.e. every 5 min.
Emissions of DMS and sea spray are interactive in the model, with their flux into the atmosphere primarily driven by variations in the model wind speed (using the same ap-proaches described in Bellouin et al., 2013). Anthropogenic emissions of SO2 and BC/OC are taken from the
corre-sponding grid cell of the IPCC AR5 global emission data (Lamarque et al., 2010), with monoterpene and biomass BC/OC emissions from the GEIA1and GFEDv22databases respectively, but sources from these sectors are not sig-nificant in this domain. At the initial time, the chemistry tracers (HONO2, O3, and H2O2) and the aerosol
precur-sor gas-phase tracers (DMS, SO2, H2SO4, MONOTER, and
SEC_ORG) are respectively set to 1 and 0.001 pptv, whereas the aerosol concentrations are spun up from an entirely clean environment.
The thermodynamic (temperature and humidity) and dy-namic (horizontal wind) variables are initialised from a sin-gle model profile (Fig. 1) taken from a global aqua-planet configuration of a MetUM operational run (where all land points are removed). The profiles are deliberately chosen to be strongly unstable so that the model will experience a sudden deep convective instability in the early phase of its
1Global Emissions InitiAtive: www.geiacenter.org
2Global Fire Emissions Database, Version2: www.
Table 1. Standard aerosol configuration for GLOMAP-mode. The size distribution is described by log-normal modes with varying geometric mean diameter D and fixed geometric standard deviation σg. Particle number and mass are transferred between modes when D exceeds the
upper limit for the mode. Names are given in function of the aerosol mode (“nuc”, “Ait”, “acc”, and “coa” stand for nucleation, Aitken, accumulation, and coarse) and their solubility properties (“sol” or “ins” mean the aerosols are soluble or insoluble). The aerosols can be composed of sulfate (SU), primary organic matter (POM), black carbon (BC), or sea salt (SS).
Index Name Size range Composition Soluble σg
1 nucsol D<10 nm SU, POM yes 1.59 2 Aitsol 10 nm < D < 100 nm SU, BC, POM yes 1.59 3 accsol 100 nm < D < 1 µm SU, BC, POM, SS yes 1.59 4 coasol D> 1 µm SU, BC, POM, SS yes 2.00 5 Aitins 10 nm < D < 100 nm BC, POM no 1.59
Figure 1. Tephigram representing the vertical profile of the ini-tial dew point temperature (dashed line) and the temperature (solid line). The thick dotted line represents the adiabatic parcel ascent and the circles indicate the specific levels of the parcel such as the lifted condensation level (LCL), the convective condensation level (CCL) and the level of free convection (LFC).
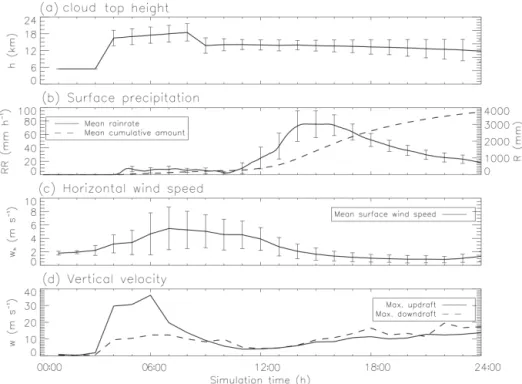
evolution. The convective perturbation can clearly be seen in Fig. 2, with deep convective clouds forming after a few hours, reaching up to a cloud top height of approximately 18 km (Fig. 2a). The precipitation onset is after ∼ 5 h of simulation (Fig. 2b). The surface rain rate intensifies after 12 h of simulation and reaches a maximum of approximately 80 mm h−1 between 14 and 16 h of simulation. The mean
horizontal surface wind speeds over the domain increase only slightly from 2 up to around 4 m s−1as the storm develops (Fig. 2c), but variations within the domain are large with a maximum 1 standard deviation range of 3 to 9 m s−1 and strong wind speeds occurring consistently between 6 and 10 h of simulation (15:00 and 19:00 UTC). Between 3 and 6 h of integration (12:00 to 15:00 UTC), intense vertical wind speeds occur (Fig. 2d) and those upward movements trans-port DMS into the free troposphere where, after oxidation, it is known to cause new aerosol particle formation (e.g. Raes et al., 1993), with subsequent growth and re-entrainment into the boundary layer of the resulting secondary particles con-stituting a major source of marine CCN on the global scale (e.g. Korhonen et al., 2008). The sharp variations in hori-zontal wind speeds also induce strong variations in the emis-sion of sea-spray particles, since their source function has a cubic dependence on horizontal wind speed (e.g. Gong et al., 2002). Other influences such as changes in sea surface wave state also influence sea-spray emissions (e.g. Grythe et al., 2014), but these effects are not resolved in this study. The Gong–Monahan parameterisation used here is based on sea-spray flux measurements made over a longer time period than the model time step (30 s), and observation capabilities now include eddy covariance sea-spray flux measurements (e.g. Norris et al., 2012), we expect our approach will resolve the dominant sources of sea-spray emissions flux variability. Figure 3a–c present the variation in aerosol particle concen-trations across the domain at the time of maximum convec-tive instability, i.e. intense updraughts and horizontal wind speeds, with squall lines and associated cold pool clearly apparent, with very strong particle concentration gradients across the gust fronts, and the gravity currents inducing re-gions of greatly enhanced sea-spray emissions. The strong convective event causes a rapid spin-up of the atmospheric composition in the model, giving an opportunity to assess the variation in aerosol properties across a range of wind speeds during the decay after the storm has subsided. In the next sec-tion, these high-resolution spatial variations in size-resolved aerosol properties are explored, examining how the different aerosol sources and processes represented in the simulations
influence fluctuations in marine boundary layer CCN con-centrations at this convection-permitting resolution.
3 Results
3.1 Gas-to-particle conversion
To aid interpretation and inference from the assessment of aerosol properties in subsequent sections, in this first part of the results we explore how the substantial emission of DMS during the intense storm period propagates through to sim-ulated concentrations of its oxidised forms, sulfur dioxide (SO2)and sulfuric acid (H2SO4). Emissions of DMS vary
strongly with wind speed, and emissions fluxes will therefore be highest between 7 and 9 h of integration when the peak of the wind-speed fluctuations is at maximum. The high emis-sions lead to a peak in the domain-mean DMS concentration with maximum of ∼ 10 pptm after 9 h of simulations (i.e. at 18:00 UTC). DMS is oxidised by OH during the daytime and by NO3 at night, both reactions producing SO2, which, in
the gas phase, goes on to form H2SO4vapour following
fur-ther reaction with OH. Figure 4 illustrates the timescales as-sociated with these processes. The domain-averaged surface SO2and H2SO4 concentrations peak much later than DMS
(22 h of simulation, 07:00 UTC, day +1) at respectively ∼ 18 and 6.5×10⁻³pptm. Given the photochemistry involved, the peak concentration at 07:00 UTC is surprising, but illustrates how atmospheric composition at the surface is strongly influ-enced by dynamical effects, not just atmospheric chemistry. The fact that the simulated sulfur gases and aerosol fields spin up helps identify which processes cause the CCN varia-tions and allows for better understanding the temporal sig-natures of the different processes involved. The gas-phase H2SO4 produced from the emitted DMS is a prerequisite
for effective new particle formation and also causes growth of existing particles following vapour condensation, both ef-fects being important sources of marine cloud condensation nuclei (e.g. Korhonen et al., 2008). Although BC and POM are resolved in the model, and UKCA chemistry includes the oxidation of monoterpenes, their emission in this marine do-main is negligible. Rather sea spray and DMS-derived sulfate particles are the only two significant particle sources in these simulations.
Hereafter, the analysis focuses on separately assessing the aerosol particles in the different size modes, investigating how the identified driver sources and processes are influenc-ing simulated CCN variations at this convection permittinfluenc-ing resolution. The analysis is restricted to the last 12 h of simu-lation with an emphasis on the results obtained after 18 h of integration, by which time the model has fully spun-up. In-deed, according to the extreme convective instability that in-duces intense updrafts the spin-up time lasts approximately 6 h of simulation.
3.2 Properties of the aerosol fields
In this section, the focus is on quantifying variations in aerosol properties in the three different particle size ranges: Aitken, accumulation, and coarse modes. The analysis be-gins (Fig. 3) with instantaneous snapshots of surface aerosol particle concentration and size at two different times in the simulation. Figure 3a–c present a snapshot of spatial vari-ability at 6 h of integration, when a dynamics intense storm period occurred. Figure 3d–i show the snapshot spatial varia-tion at 18 h of integravaria-tion, in more modest and representative wind-speed conditions but with intense rain rates. The coarse mode consists entirely of sea-spray particles, so the highest particle concentrations are expected to generally indicate re-gions where simulated horizontal wind speeds are highest. However, during the initial storm period, and at this high spatial resolution, there are also regions of intense localised precipitation (greater than 10 mm h−1)and powerful vertical wind speeds, which also strongly influence aerosol proper-ties due to removal and transport effects. At 6 h of simulation, Fig. 3a–c show that particle concentrations in the two largest modes (accumulation and coarse) are indeed extremely vari-able over the entire domain. For example, particle concentra-tions vary from 1 to 1000 cm−3for the accumulation mode and from 0.1 to 100 cm−3 for the coarse mode. Note how-ever that this very high aerosol variability is unrealistically large, mostly due to the model being initialised with a “warm bubble” to ensure model spin-up proceeds rapidly. However, the period from 12 to 24 h of integration can be considered to span a representative range of wind-speed conditions, and we focus on this second half of the day in the rest of the results sections.
Despite the fact that particles in Aitken mode can be af-fected by the emission of sea spray (e.g. Salter et al., 2015), in this remote marine domain, particles in the Aitken mode are almost exclusively secondary in nature, being originally formed via nucleation in the free troposphere. Over the ini-tial 12 h of integration, free troposphere concentrations of the driver gas for nucleation, H2SO4, are not yet high enough
to initiate significant particle formation, with low simulated concentrations of its precursor species SO2(see Fig. 4) and
timescales for oxidation and transport being relative long. After 18 h of simulations, the strongly convective episode has passed, and coarse-mode particle concentrations (Fig. 3f), al-though still quite variable, have more moderate peak con-centrations, lower by around a factor of 10 than during the intense storm period (Fig. 3c, f). Accumulation-mode par-ticle concentrations at 18 h of integration (Fig. 3e) are also much less variable than at 6 h of simulations, with the high-est concentrations in the same regions that coarse-mode par-ticle concentrations were highest, likely indicating where sea-spray emissions are highest (horizontal wind speeds are strongest). Patches of low concentrations are also found where the precipitation is most intense, with the washout rate (impaction scavenging efficiency) tied to rainfall rates.
Figure 2. Temporal evolution of (a) the mean cloud top height, (b) the mean accumulated rain and rain rate at the surface, (c) the mean surface horizontal wind speed, and (d) the maximum of the updraughts and downdraughts. The averages are obtained over the entire grid points of the domain and given with ± 1 standard deviation. The initial time of the simulation is 09:00 UTC on 24 May 2002.
In the Aitken mode (Fig. 3d), particle concentrations have be-come significant by 18 h of integration, although still an order of magnitude lower than in the accumulation mode. Spatial variations in the size of the aerosol particles are also highest for the coarse mode (Fig. 3i), likely reflecting the nature of the sea-spray source function. The general spatial patterns of size variation seen for the coarse mode are also seen for the accumulation mode (Fig. 3h), but the accumulation mode has additional regions of lower particle size where Aitken-mode particle concentrations are highest (Fig. 3d). This covaria-tion is expected, since the accumulacovaria-tion-mode mean radius will be lower, on average, when there are a significant num-ber of smaller particles being chemically cloud processed or mode-merged in from the Aitken mode. Over the domain, mean particle size variations are largest for the Aitken mode at 118 % min-to-max ratio (geometric mean radius from 22 to 48 nm), compared to ∼ 20 % for the accumulation mode (101 to 123 nm) and ∼ 35 % for the coarse mode (0.75 to 1.10 µm).
In Fig. 5 we show Hovmöller diagrams to further explore the temporal evolution in surface concentrations of Aitken-, accumulation-Aitken-, and coarse-mode particles during the last 12 h of integration (at y = 150 km). Highest particle concen-trations from accumulation and coarse modes are apparent between 12 and 15 h of integrations, whereas Aitken-mode particle concentrations evolve with quite different time vari-ation. The convective storm period in the first 12 h of simu-lation causes very strong wind speeds and the decay of the
coarse-mode particles concentrations over this second half of the day reflects the progression to calmer conditions with consequently reduced sea-spray emissions but also the inten-sification of the precipitation (Fig. 2) increasing the scaveng-ing process efficiency. By contrast, Aitken particle concen-trations steadily increase to a maximum of around 1–2 cm−3 after 22 h of simulations, matching that seen for SO2 and
gas-phase H2SO4(Fig. 4), consistent with the timescales of
the two oxidation steps required to convert enough of the emitted DMS into sulfuric acid vapour to trigger new par-ticle formation. For parpar-ticles to reach Aitken sizes, growth by condensation and coagulation is also required, and since nucleation will mostly tend to occur in the free troposphere, any transition to a statically stable boundary layer during late evening would likely also be important, influencing particle entrainment and the timing of the increase in Aitken particle concentrations at the surface. In these idealised simulations however, the shortwave and long-wave radiation schemes are switched off, thus resulting in no solar-induced diurnal varia-tions in boundary layer entrainment (but photochemical vari-ations proceeding in the model based on local time).
Assessing how each of the size modes spins up reveals how temporal variations in marine CCN concentrations are actually reflecting the very different time profiles of the two dominant CCN production pathways: primary emissions of sea-spray particles and entrainment of DMS-derived sec-ondary particles formed in the free troposphere. The analysis illustrates the way a diverse community of processes
(dy-Figure 3. Snapshot spatial variations in the number concentrations (a–f) and geometric-mean radius (g–i) of the aerosol particles in the Aitken (aitsol; a, d, g), accumulation (accsol; b, e, h), and coarse (coasol; c, f, i) soluble modes after 6 h (in model spin-up) (a–c) and 18 h (d–i) of integration. The black solid lines represent the surface vertical wind speed (w = 5 m s−1). Note that the colour scales are different. The dashed lines correspond to the transects shown in Figs. 5 and 9.
Figure 4. Temporal evolution of the mean mass mixing ratios of the gas precursors to aerosols. The DMS, SO2, and H2SO4mass
concentrations are in pptm (part per trillion in mass). The error bars correspond to ± 1 standard deviation.
namical, chemical, and microphysical) together determine CCN variations in the marine boundary layer. Figure 5a shows an Aitken mode emerging after 17 h of integration which also explains the dip in accumulation-mode size (con-tour lines), as a substantial number of smaller secondary par-ticles are “mode-merged in” from the Aitken mode at that time. For the coarse mode, as particle concentrations de-crease, there is also a progression to smaller particles, which can be explained by that fact that, in the model, sedimenta-tion (the dominant removal process for this mode) removes both number and mass, enabling the simulation to reflect the fact that larger particles fall faster even when they are in the same mode.
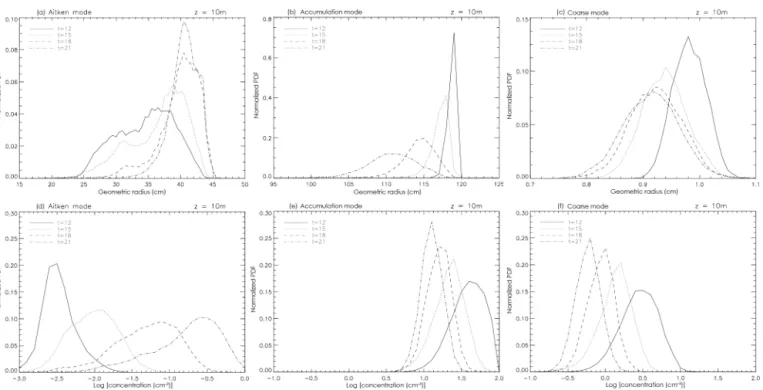
A more quantitative analysis of the simulated aerosol properties is presented hereafter, with Fig. 6 showing prob-ability density functions (PDFs) of the geometric dry radius (a–c) and particle concentrations (d–f) for the Aitken, accu-mulation, and coarse modes at different times in the second 12 h of the integration. The analysis shows that, for the ac-cumulation and coarse modes, as seen in Fig. 5, as time pro-gresses, the particle size PDFs shift to smaller sizes, with the accumulation-mode PDFs becoming much wider in the
Figure 5. Temporal evolution of the aerosol concentration from the Aitken (a), accumulation (b), and coarse (c) soluble mode after the model spin-up. Temporal evolution of the aerosol dry radius is also illustrated for the three modes: 30 (dashed line) and 35 nm (solid line) for the Aitken soluble mode, 110 (solid line) and 115 nm (dashed line) for the accumulation soluble mode, and 0.96 (solid line) and 1.0 µm (dashed lines) for coarse soluble mode. Note that the colour scales are different.
Figure 6. Normalised probability density function (PDF) of the geometric radius (a, b, c) and the logarithm of the concentration (d, e, f) of the surface aerosols from the Aitken (a, d), accumulation (b, e), and coarse (c, f) soluble modes obtained at different integration times.
evening as the source of smaller particles from the Aitken mode becomes significant. By contrast, as Aitken-mode con-centrations increase, the particles are clearly also larger, re-flecting that growth processes are acting on the particles, with this size increase ceasing at about 18 h of integration, while particle concentrations continue to increase (likely due to en-trainment). For the accumulation- and coarse-mode particles, this quantitative approach is consistent with sedimentation causing the shift in size distribution as the larger particles sediment out faster than the smaller ones. Figure 7 shows
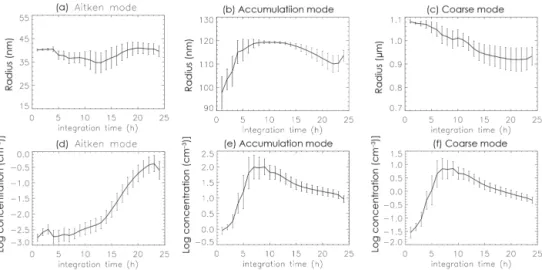
the temporal evolution of the mean and standard deviation of the geometric mean radius values and number concentra-tion (over grid boxes in the domain) for Aitken, accumula-tion, and coarse modes at the surface. The accumulation- and coarse-mode concentration and radius fields have largest spa-tial variations between 5 and 8 h of simulation as the model adjusts to the very strong sea-salt emission and quite effi-cient wet removal induced by the precipitation onset dur-ing the peak convective activity, whereas Aitken-mode con-centrations, and their variations, stay approximately constant
Figure 7. Time series of the mean ± 1 standard deviation of the geometric radius (a, b, c) and the logarithm of the concentration (d, e, f) of the surface aerosols from the Aitken (a, d), accumulation (b, e) and coarse (c, f) soluble modes. The initial time of the simulation is 09:00 UTC on 24 May 2002.
through that period. During the simulations, the mean radius and particle concentration values from the coarse mode, on average, decrease (Fig. 7c, f), but the mean size variations show the opposite evolution, with greater variability in the calmer second half of the day, reflecting the strengthening influence of sedimentation as sea-spray emissions decrease. For the accumulation mode, the mean particle size displays remarkably little variation over the domain between 9 and 14 h of simulation (as seen in Fig. 6a), with the variation in-creasing as the source of secondary CCN from the Aitken mode becomes significant later in the day.
3.3 CCN spatial and temporal features
In this marine domain, sea-salt particles represent a major component of the CCN population (e.g. O’Dowd et al., 1997; O’Dowd and de Leeuw, 2007). Models parameterise sea-spray emission fluxes as a function of the 10 m wind speed (u10), with some source functions linked directly to field
measurements of the particle concentrations (e.g. Smith et al., 1993), while others (e.g. Monahan et al., 1986) reflect the processes that form ocean whitecaps by laboratory ex-periments on particle emissions. In the simulations presented here, the model uses the sea-spray source function of Gong (2003) which applies the approach of Monahan et al. (1986), and its u3.4110 m wind-speed dependence, with a refined for-mulation with an additional parameter determining emission of ultra-fine sea-spray particles, as constrained by field mea-surements from O’Dowd et al. (1997).
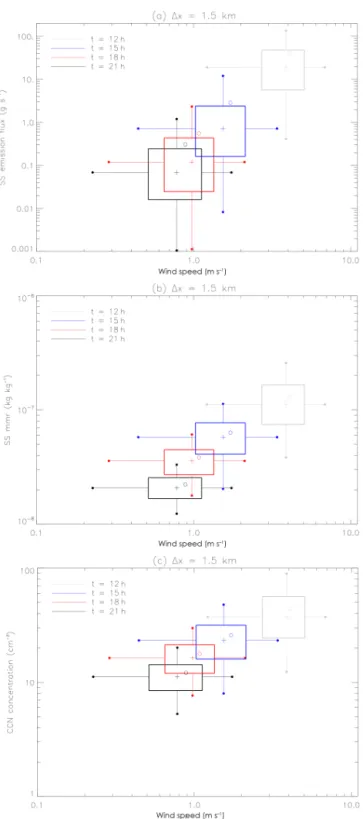
In light of the inference of sea-spray emissions fluxes from measurements of particle concentrations, Fig. 8 presents sev-eral snapshot variation box plots for simulated sea-salt emis-sion flux, sea-salt mass mixing ratio (MMR), and the CCN number concentration as a function of the u10 (called
here-after surface wind speed) at different integration times. At
this convection-permitting resolution, the sea-salt emission fields are highly heterogeneous at each integration time with the emission flux median highest at 12 h of integration then decreasing towards the end of the simulations, consistent with the mean wind-speed evolution (Fig. 2c). After their emission into the atmosphere, sea-salt aerosols are trans-ported vertically by turbulence, with larger particles also in-fluenced by sedimentation. As expected, near the surface, the higher the sea-salt emission fluxes, the higher the sea-salt MMR, but, as we show below, the covariation of the sea-salt MMR field with wind speed (Fig. 8b) is fundamentally dif-ferent than it is for sea-salt emission (Fig. 8a). Sea-spray par-ticles are highly soluble and are, in most cases, directly emit-ted at sizes where they are effective CCN, but, as discussed earlier, in marine regions, the CCN population also has a sub-stantial contribution from nucleated sulfate particles which have grown large enough to be CCN-active. Figure 8c shows the variation of CCN concentrations in this marine domain at different integration times and allows for the exploration of how its variation compares to that seen for sea-spray MMR and emissions flux. By sampling the four periods at 12, 15, 18, and 21 h of integration, it is possible to assess the spa-tial variability in sea-salt emissions, sea-salt concentrations, and CCN concentrations at a range of wind-speed conditions; the earliest period representing a strong convective period (i.e. intense wind speeds) when sea spray would be domi-nant, and through the progression to calmer conditions later in the simulation. First, the relative change in the median be-tween each period (12–15, 15–18, and 18–21 h) is assessed. As expected, the median sea-salt emission flux (Fig. 8a) de-creases linearly on the log–log plot over the period, reflect-ing the 3.41 exponent in the wind-speed-dependence for the sea-spray source function. By contrast, the median sea-salt mixing ratio (Fig. 8b) decreases much more steeply over the
Figure 8. 2D distribution of the surface sea-salt emission flux (a), sea-salt mass mixing ratio (MMR) (b) and CCN concentration (c) as a function of the surface horizontal wind for four different inte-gration times (t = 12, 15, 18 or 21 h). The hinges of the box plots represent the 25th and 75th percentiles and the ends of the whiskers (full circles) represent the 5th and 95th percentiles. The plus sym-bols represent the median values. The empty circles show the mean values over the domain.
18–21 h period than in the 12–15 h period, despite strong de-creases in wind speed. This effect is likely a result of the timescale for the decay from the excited state acquired dur-ing the strong convection period (the strong turbulence and direct transport having lifted particles much higher), as the atmosphere is still “catching up”, with the adjustment to the new calmer conditions only visible after 18 h of integration. The equivalent temporal decay for CCN concentrations is also curved (Fig. 8c), but part of the signal of steeper decline between 18 and 21 h of integration (from the decreased sea salt) is “straightened out” by the compensating emergence of the secondary nucleated particles making an important con-tribution to CCN in this later period (as we showed in Fig. 7). In the calm conditions, wind speeds across the domain vary (5th to 95th percentile) from ∼ 0.21 to 1.6 m s−1, around a factor of 8, with the CCN particle concentration range from around 6 to 20 cm−3(a factor of 3). In contrast, during the 12–15 h period (i.e. with intense wind speeds and moderate rain rates), the CCN particle variation is much larger, be-tween 12 and 95 cm−3(a factor of 8).
Figure 9 presents the vertical variation of the simulated CCN concentration using an altitude PDF profile (a-PDF) for the same periods as mentioned above. As expected, on average, the CCN concentration drops off with increasing al-titude reflecting a balance between turbulence and convec-tion lifting the particles vertically and gravitaconvec-tional settling transporting larger particles back towards the surface. In the atmospheric surface layer (lowest 100 m or so) the profile of mean CCN follows a power-law profile but the spatial CCN variance (standard deviation over grid boxes in the domain) decreases much less rapidly with altitude. As a consequence, the CV increases with increasing altitude from ∼ 11 % at the surface to ∼ 22.5 % at 1.3 km height. The CCN concentration fields close to the surface are mainly influenced by the emis-sions whereas at higher altitudes they are mostly influenced by the transport. This explains why, after 12 h of simulation, the CV is slightly higher than at the others times. Note that the emergence of the secondary nucleated particles is also visible in the CCN concentration vertical properties on the 18–21 h period.
4 Conclusions and discussions
We have analysed spatial and temporal sea-spray and CCN variations in a convection-permitting model with interac-tive sea-spray emissions, sulfur chemistry and aerosol micro-physics over an idealised marine tropical domain. In this ma-rine atmosphere the two dominant CCN sources are both nat-ural: primary sea-spray particles and secondary sulfate parti-cles. However, even in this relatively simple two-component CCN system, our analysis has revealed that there is a diverse community of processes: dynamical, chemical, and micro-physical, that combine to determine the number of particles which can activate to cloud droplets.
Figure 9. Altitude-dependent probability density function (a-PDF) in percent of the CCN concentration at different integration times. The a-PDFs are obtained calculating the PDF for each different level. A resolution of 0.1 is used for quantify the logarithm of the concentration. The lines represent the mean (solid lines) ± 1 standard deviation (dashed lines) of the CCN concentration. The dotted lines represent the coefficient of variation (CV) which is defined as the ratio of the standard deviation to the mean of the CCN concentration.
First, the dynamics strongly influences the sea-spray emis-sions since highest particle concentrations occur where wind speeds are highest, and there is a cubic wind-speed depen-dence for sea-salt emission. The emitted sea-spray particles have a range of sizes, being directly emitted in both the ac-cumulation (sub-micron) and coarse (super-micron) modes. After their emission into the atmosphere, sea-salt aerosols are transported vertically by turbulent diffusion and convec-tive updrafts, with larger particles also being influenced by sedimentation. We show that the covariation of sea-salt mass mixing ratio with wind speed is fundamentally different than that for sea-salt emission, with implications for derivations that treat the two synonymously. In particular, since sub-micron sea-spray has much longer atmospheric residence time (days) than super-micron sea-spray (hours), care must be taken when relating measured sea-spray concentrations to emissions. Intense localised precipitation during strong con-vection also impacts aerosol concentrations at the climate grid scale with removal effects introducing strong variations (e.g. via the impaction scavenging process). The combination of these processes impacts the particle concentration prop-erties, which become extremely variable in space (about a factor of 8 over the entire domain, one climate model grid square) and time. We acknowledge that if the aerosol had
been initialised with a background profile, the variability de-scribed here might have been lower.
Moreover, the emissions of DMS strongly vary spatially and temporally according to wind speeds and become sub-stantial during intense storm period (as in Devine et al., 2006). There is a requirement for gas-phase species SO2and
H2SO4vapour to be sufficiently produced following
oxida-tion of DMS before new sulfate particle formaoxida-tion in the free troposphere can occur, and the latter species also causes en-hanced growth of existing particles following condensation. The combination of the two oxidation steps is required to convert emitted DMS into sulfuric acid vapour, also at the timescales inherent in particle growth processes (e.g. coag-ulation and condensation), explaining why there is a quite different time variation for the Aitken-mode particle concen-trations. Provided the air mass has had sufficient time, a sig-nificant proportion of these small secondary particles could grow large enough to be cloud processed or mode-merged from the Aitken mode to the accumulation mode. The effects of these processes is illuminated by assessing how each of the particle modes is spinning up, revealing the way they in-fluence spatial- and temporal CCN variations in the marine boundary layer.
Sea-spray particles are highly soluble and, in most cases, are directly emitted at sizes where they are already effective
CCN. In contrast, a different component of the CCN popu-lation comprises nucleated sulfate particles which need more time to grow large enough to be CCN-active. The variations in the CCN concentrations are strong and can attain a factor of 8 in strongly convective conditions, mostly reflecting the properties of larger CCN. Smaller (sub-micron) CCN, from the accumulation mode, tend to have less variation, which in part is due to their source having a significant contribu-tion from the steady formacontribu-tion of secondary sulfate parti-cles in the free troposphere. We have seen how dynamics and microphysical processes also affect CCN, in particular with a 2nd CCN peak at the top of the boundary layer during the strongly convective period before the secondary particles emerged. These effects combine to determine how the CV in CCN concentration changes with altitude, our results sug-gesting an increase from around 10 % at the surface to more than 20 % at the top of the marine boundary layer. Whereas CCN concentration fields close to the surface are mainly in-fluenced by the emissions, at higher altitudes they are in gen-eral older, and inherit influences propagated via transport.
We also examine spatial and temporal variations in aerosol particle size, finding that the geometric radius of the Aitken and coarse modes are particularly variable, which will intro-duce further variability in cloud droplet number concentra-tions and cloud brightness. The different influences on the two CCN types (primary and secondary), and the diverse community of processes involved (microphysical, chemical and dynamical), makes sub-grid parameterisation of the CCN variations difficult. This study provides valuable results on the impact of the local dynamics and aerosol sources on the CCN population and on the aerosol–cloud interactions oc-curring at these fine spatial scales. We have applied the UM-UKCA model for non-idealised case studies with a nesting procedure to retain the larger-scale influences, as is the capa-bility to allow these aerosol variations to couple with a new cloud microphysics scheme in MetUM (Shipway and Hill, 2012).
Competing interests. The authors declare that they have no conflict of interest.
Acknowledgements. This project was made possible through the financial support of the Leeds-Met Office Academic Partnership (ASCI project). The authors acknowledge use of the MONSooN system, a collaborative facility supplied under the Joint Weather and Climate Research Programme, which is a strategic partnership between the Met Office and the Natural Environment Research Council. The lead author wishes to thank Douglas Parker for useful discussions. Graham W. Mann is funded by the UK National Centre for Atmospheric Science, one of the UK Natural Environment Research Council (NERC) research centres. John H. Marsham ac-knowledges funding from the SAMMBA project (NE/J009822/1).
Edited by: C. Hoose
Reviewed by: two anonymous referees
References
Adams, P. J. and Seinfeld, J. H.: Predicting global aerosol size dis-tributions in general circulation models, J. Geophys. Res., 107, 4370, doi:10.1029/2001JD001010, 2002.
Archer-Nicholls, S., Lowe, D., Schultz, D. M., and McFiggans, G.: Aerosol–radiation–cloud interactions in a regional coupled model: the effects of convective parameterisation and resolution, Atmos. Chem. Phys., 16, 5573–5594, doi:10.5194/acp-16-5573-2016, 2016.
Bangert, M., Kottmeier, C., Vogel, B., and Vogel, H.: Regional scale effects of the aerosol cloud interaction simulated with an online coupled comprehensive chemistry model, Atmos. Chem. Phys., 11, 4411–4423, doi:10.5194/acp-11-4411-2011, 2011.
Bellouin, N., Mann, G. W., Woodhouse, M. T., Johnson, C., Carslaw, K. S., and Dalvi, M.: Impact of the modal aerosol scheme GLOMAP-mode on aerosol forcing in the Hadley Centre Global Environmental Model, Atmos. Chem. Phys., 13, 3027– 3044, doi:10.5194/acp-13-3027-2013, 2013.
Boucher, O., Randall, D., Artaxo, P., Bretherton, C., Feingold, G., Forster, P., Kerminen, V.-M., Kondo, Y., Liao, H., Lohmann, U., Rasch, P., Satheesh, S. K., Sherwood, S., Stevens, B., and Zhang, X. Y.: Clouds and aerosols, in: Climate Change 2013: The phys-ical basis. Contribution of working group I to the Fifth Assess-ment Report of the IntergovernAssess-mental Panel on Climate Change, edited by: Stocker, T. F., Qin, D., Plattner, G.-K., Tignor, M., Allen, S. K., Boschung, J., Nauels, A., Xia, Y., Bex, V., and Midgley, P. M., Cambridge University Press, Cambridge, United Kingdom and New York, NY, USA, 2013.
Carslaw, K. S., Lee, L. A., Reddington, C. L., Pringle, K. J., Rap, A., Forster, P. M., Mann, G. W., Spracklen, D. V., Woodhouse, M. T., Regayre, L. A., and Pierce, J. R.: Large contribution of natural aerosols to uncertainty in indirect forcing, Nature, 503, 67–71, 2013.
Cui, Z., Davies, S., Carslaw, K. S., and Blyth, A. M.: The re-sponse of precipitation to aerosol through riming and melting in deep convective clouds, Atmos. Chem. Phys., 11, 3495–3510, doi:10.5194/acp-11-3495-2011, 2011.
Devine, G. M., Carslaw, K. S., Parker, D. J., and Petch, J. C.: The influence of subgrid surface-layer variability on vertical transport of a chemical species in a convective environment, Geophys. Res. Lett., 33, L15807, doi:10.1029/2006GL025986, 2006.
Ekman, A., Wang, C., Ström, J., and Krejci, R.: Explicit simulation of aerosol physics in a cloud-resolving model: Aerosol transport and processing in free troposphere, J. Atmos. Sci., 63, 682–695, 2006.
Ekman, A. M. L., Wang, C., Wilson, J., and Ström, J.: Explicit sim-ulations of aerosol physics in a cloud-resolving model: a sensitiv-ity study based on an observed convective cloud, Atmos. Chem. Phys., 4, 773–791, doi:10.5194/acp-4-773-2004, 2004.
Forster, P., Ramaswamy, V., Artaxo, P., Berntsen, T., Betts, R., Fa-hey, D. W., Haywood, J., Lean, J., Lowe, D. C., Myhre, G., Nganga, J., Prinn, R., Raga, G., Schulz, M., and Van Dorland, R.: Changes in atmospheric constituents and in radiative forcing. Chapter: Climate Change 2007: The Physical Science Basis, in:
Contribution of Working Group I to Fourth Assessment Report of the Intergovernmental Panel on Climate Change Cambridge University Press, Cambridge, UK and New York, USA, 129–234, 2007.
Ghan, S. J., Easter, R. C., Chapman, E. G., Abdul-Razzak, H., Zhang, Y., Leung, L. R., Laulainen, N. S., Saylor, R. D., and Zaveri, R. A.: A physically based estimate of radiative forcing by anthropogenic sulphate aerosol, J. Geophys. Res., 106, 5279– 5293, 2001.
Gong, S. L.: A parameterization of sea-salt aerosol source function for sub- and super-micron particles, Global Biogeochem. Cy., 14, 1097–1103, 2003.
Gong, S. L., Barrie, L. A., and Lazare, M.: Canadian Aerosol Mod-ule (CAM): A size-segregated simulation of atmospheric aerosol processes for climate and air quality models. 2. Global sea-salt aerosol and its budgets, J. Geophys. Res., 107, D244779, doi:10.1029/2001JD002002, 2002.
Gregory, D. and Rowntree, P. R.: A mass flux convection scheme with representation of cloud ensemble characteristics and stability-dependent closure, Mon. Weather Rev., 118, 1483– 1506, 1990.
Grythe, H., Ström, J., Krejci, R., Quinn, P., and Stohl, A.: A review of sea-spray aerosol source functions using a large global set of sea salt aerosol concentration measurements, Atmos. Chem. Phys., 14, 1277–1297, doi:10.5194/acp-14-1277-2014, 2014. Igel, A., Igel, M., and van den Heever, S.: Make It a Double?
Sober-ing Results from Simulations UsSober-ing SSober-ingle-Moment Micro-physics Schemes, J. Atmos. Sci., 72, 910–925, doi:10.1175/JAS-D-14-0107.1, 2015.
Jones, C. D., Hughes, J. K., Bellouin, N., Hardiman, S. C., Jones, G. S., Knight, J., Liddicoat, S., O’Connor, F. M., Andres, R. J., Bell, C., Boo, K.-O., Bozzo, A., Butchart, N., Cadule, P., Corbin, K. D., Doutriaux-Boucher, M., Friedlingstein, P., Gor-nall, J., Gray, L., Halloran, P. R., Hurtt, G., Ingram, W. J., Lamar-que, J.-F., Law, R. M., Meinshausen, M., Osprey, S., Palin, E. J., Parsons Chini, L., Raddatz, T., Sanderson, M. G., Sellar, A. A., Schurer, A., Valdes, P., Wood, N., Woodward, S., Yoshioka, M., and Zerroukat, M.: The HadGEM2-ES implementation of CMIP5 centennial simulations, Geosci. Model Dev., 4, 543–570, doi:10.5194/gmd-4-543-2011, 2011.
Kaufman, Y. J., Koren, I., Remer, L. A., Rosenfeld, D., and Rudich, Y.: The effect of smoke, dust, and pollution aerosol on shallow cloud development over the Atlantic Ocean, P. Natl. Acad. Sci. USA., 102, 11207–11212, 2005.
Korhonen, H., Carslaw, K. S., Spracklen, D. V., Mann, G. W., and Woodhouse, M. T.: Influence of oceanic DMS emissions on CCN concentrations and seasonality over the remote Southern Hemi-sphere oceans: A global model study, J. Geophys. Res., 113, D15204, doi:10.1029/2007JD009718, 2008.
Lamarque, J.-F., Bond, T. C., Eyring, V., Granier, C., Heil, A., Klimont, Z., Lee, D., Liousse, C., Mieville, A., Owen, B., Schultz, M. G., Shindell, D., Smith, S. J., Stehfest, E., Van Aar-denne, J., Cooper, O. R., Kainuma, M., Mahowald, N., Mc-Connell, J. R., Naik, V., Riahi, K., and van Vuuren, D. P.: His-torical (1850–2000) gridded anthropogenic and biomass burning emissions of reactive gases and aerosols: methodology and ap-plication, Atmos. Chem. Phys., 10, 7017–7039, doi:10.5194/acp-10-7017-2010, 2010.
Lohmann, U. and Feichter, J.: Global indirect aerosol effects: a re-view, Atmos. Chem. Phys., 5, 715–737, doi:10.5194/acp-5-715-2005, 2005.
Mann, G. W., Carslaw, K. S., Spracklen, D. V., Ridley, D. A., Manktelow, P. T., Chipperfield, M. P., Pickering, S. J., and Johnson, C. E.: Description and evaluation of GLOMAP-mode: a modal global aerosol microphysics model for the UKCA composition-climate model, Geosci. Model Dev., 3, 519–551, doi:10.5194/gmd-3-519-2010, 2010.
Mann, G. W., Carslaw, K. S., Ridley, D. A., Spracklen, D. V., Pringle, K. J., Merikanto, J., Korhonen, H., Schwarz, J. P., Lee, L. A., Manktelow, P. T., Woodhouse, M. T., Schmidt, A., Brei-der, T. J., Emmerson, K. M., Reddington, C. L., Chipperfield, M. P., and Pickering, S. J.: Intercomparison of modal and sectional aerosol microphysics representations within the same 3-D global chemical transport model, Atmos. Chem. Phys., 12, 4449–4476, doi:10.5194/acp-12-4449-2012, 2012.
Mann, G. W., Carslaw, K. S., Reddington, C. L., Pringle, K. J., Schulz, M., Asmi, A., Spracklen, D. V., Ridley, D. A., Wood-house, M. T., Lee, L. A., Zhang, K., Ghan, S. J., Easter, R. C., Liu, X., Stier, P., Lee, Y. H., Adams, P. J., Tost, H., Lelieveld, J., Bauer, S. E., Tsigaridis, K., van Noije, T. P. C., Strunk, A., Vignati, E., Bellouin, N., Dalvi, M., Johnson, C. E., Bergman, T., Kokkola, H., von Salzen, K., Yu, F., Luo, G., Petzold, A., Heintzenberg, J., Clarke, A., Ogren, J. A., Gras, J., Baltensperger, U., Kaminski, U., Jennings, S. G., O’Dowd, C. D., Harrison, R. M., Beddows, D. C. S., Kulmala, M., Viisanen, Y., Ulevicius, V., Mihalopoulos, N., Zdimal, V., Fiebig, M., Hansson, H.-C., Swi-etlicki, E., and Henzing, J. S.: Intercomparison and evaluation of global aerosol microphysical properties among AeroCom models of a range of complexity, Atmos. Chem. Phys., 14, 4679–4713, doi:10.5194/acp-14-4679-2014, 2014.
Marsham, J. H., Knippertz, P., Dixon, N., Parker, D. J., and Lister, G. M. S.: The importance of the representation of deep convection for modeled dust-generating winds over West Africa during summer, Geophys. Res. Lett., 38, L16803, doi:10.1029/2011GL048368, 2011.
Marsham, J. H., Dixon, N., Garcia-Carreras, L., Lister, G. M. S., Parker, D. J., Knippertz, P., and Birch, C. E.: The role of moist convection in the West African monsoon system – insights from continental-scale convection-permitting simulations, Geophys. Res. Lett., 40, 1843–1849, 2013.
Monahan, E. C., Spiel, D. E., and Davidson, K. L.: A model of marine aerosol generation via whitecaps and wave disrup-tion. Oceanic Whitecaps, edited by: Monahan, E. C. and Mac-Niochaill, G., 167–193, D Reidel, Norwell, Mass, 1986. Morrison, H., Thompson, G., and Tatarskii, V.: Impact of cloud
mi-crophysics on the development of trailing stratiform precipitation in a simulated squall line: comparison of one- and two-moment schemes, J. Atmos. Sci., 137, 991–1007, 2009.
Myhre, G., Samset, B. H., Schulz, M., Balkanski, Y., Bauer, S., Berntsen, T. K., Bian, H., Bellouin, N., Chin, M., Diehl, T., Easter, R. C., Feichter, J., Ghan, S. J., Hauglustaine, D., Iversen, T., Kinne, S., Kirkevåg, A., Lamarque, J.-F., Lin, G., Liu, X., Lund, M. T., Luo, G., Ma, X., van Noije, T., Penner, J. E., Rasch, P. J., Ruiz, A., Seland, Ø., Skeie, R. B., Stier, P., Takemura, T., Tsigaridis, K., Wang, P., Wang, Z., Xu, L., Yu, H., Yu, F., Yoon, J.-H., Zhang, K., Zhang, H., and Zhou, C.: Radiative forcing of the direct aerosol effect from AeroCom Phase II simulations,
Atmos. Chem. Phys., 13, 1853–1877, doi:10.5194/acp-13-1853-2013, 2013.
Norris, S. J., Brooks, I. M., Hill, M. K., Brooks, B. J., Smith, M. H., and Sproson, D. A. J.: Eddy covariance measurements of the sea spray aerosol flux over the open ocean, J. Geophys. Res., 117, D07210, doi:10.1029/2011JD016549, 2012.
O’Connor, F. M., Johnson, C. E., Morgenstern, O., Abraham, N. L., Braesicke, P., Dalvi, M., Folberth, G. A., Sanderson, M. G., Telford, P. J., Voulgarakis, A., Young, P. J., Zeng, G., Collins, W. J., and Pyle, J. A.: Evaluation of the new UKCA climate-composition model – Part 2: The Troposphere, Geosci. Model Dev., 7, 41–91, doi:10.5194/gmd-7-41-2014, 2014.
O’Dowd, C. D. and de Leeuw, G.: Marine aerosol production: a review of the current knowledge, Phil. Trans. R. Soc. A, 365, 1753–1774, 2007.
O’Dowd, C. D., Smith, M. H., Consterdine, I. E., and Lowe, J. A.: Marine aerosol, sea salt, and the marine sulphur cycle: a short review, Atmos. Environ., 31, 73–80, 1997.
Planche, C., Marsham, J., Field, P., Carslaw, K., Hill, A., Mann, G., and Shipway, B.: Precipitation sensitivity to autoconversion rate in a Numerical Weather Prediction Model, Q. J. Roy. Meteor. Soc., 141, 2032–2044, doi:10.1002/qj.2497, 2015.
Pope, R. J., Marsham, J. H., Knippertz, P., Brooks, M. E., and Roberts, A. J.: Identifying errors in dust models from data assimilation, Geophys. Res. Lett., 43, 9270–9279, doi:10.1002/2016GL070621, 2016.
Possner A., Zubler, E. M., Lohmann, U., and Schär, C.: The resolu-tion dependence of cloud effects and ship-induced aerosol-cloud interactions in marine stratocumulus, J. Geophys. Res.-Atmos., 121, 4810–4829, 2016.
Raes, F., Van Dingenen, R., Wilson, J., and Saltelli, A.: Cloud condensation nuclei from dimethyl sulphide in the natural ma-rine boundary layer: Remote vs. in-situ production, in: Dimethyl Sulphide: Oceans, Atmosphere and Climate, edited by: Restelli, G. and Angeletti, G., 311–322, Kluwer, Acad., Norwell, Mass, 1993.
Salter, M. E., Zieger, P., Acosta Navarro, J. C., Grythe, H., Kirkevåg, A., Rosati, B., Riipinen, I., and Nilsson, E. D.: An empirically derived inorganic sea spray source function incorpo-rating sea surface temperature, Atmos. Chem. Phys., 15, 11047– 11066, doi:10.5194/acp-15-11047-2015, 2015.
Shipway, B. J. and Hill, A. A.: Diagnosis of systematic differ-ences between multiple parameterizations of warm rain micro-physics using a kinematic framework, Q. J. Roy. Meteor. Soc., 138, 2196–2211, 2012.
Smith, M. H., Park, P. M., and Consterdine, I. E.: Marine aerosol concentrations and estimated fluxes over the sea, Q. J. Roy. Me-teor. Soc., 119, 809–824, 1993.
Spracklen, D. V., Pringle, K. J., Carslaw, K. S., Chipperfield, M. P., and Mann, G. W.: A global off-line model of size-resolved aerosol microphysics: I. Model development and pre-diction of aerosol properties, Atmos. Chem. Phys., 5, 2227– 2252, doi:10.5194/acp-5-2227-2005, 2005.
Walters, D. N., Williams, K. D., Boutle, I. A., Bushell, A. C., Ed-wards, J. M., Field, P. R., Lock, A. P., Morcrette, C. J., Strat-ton, R. A., Wilkinson, J. M., Willett, M. R., Bellouin, N., Bodas-Salcedo, A., Brooks, M. E., Copsey, D., Earnshaw, P. D., Hardi-man, S. C., Harris, C. M., Levine, R. C., MacLachlan, C., Man-ners, J. C., Martin, G. M., Milton, S. F., Palmer, M. D., Roberts, M. J., Rodríguez, J. M., Tennant, W. J., and Vidale, P. L.: The Met Office Unified Model Global Atmosphere 4.0 and JULES Global Land 4.0 configurations, Geosci. Model Dev., 7, 361–386, doi:10.5194/gmd-7-361-2014, 2014.
Wang, M., Ghan, S., Ovchinnikov, M., Liu, X., Easter, R., Kas-sianov, E., Qian, Y., and Morrison, H.: Aerosol indirect effects in a multi-scale aerosol-climate model PNNL-MMF, Atmos. Chem. Phys., 11, 5431–5455, doi:10.5194/acp-11-5431-2011, 2011. Weigum, N., Schutgens, N., and Stier, P.: Effect of aerosol subgrid
variability on aerosol optical depth and cloud condensation nu-clei: implications for global aerosol modelling, Atmos. Chem. Phys., 16, 13619–13639, doi:10.5194/acp-16-13619-2016, 2016. Wilkinson, J. M., Porson, A. N. F., Bornemann, F. J., Weeks, M., Field, P. R., and Lock, A. P.: Improved microphysical parametrization of drizzle and fog for operational forecasting us-ing the Met Office Unified Model, Q. J. Roy. Meteor. Soc., 139, 488–500, doi:10.1002/qj.1975, 2012.
Wilson, D. R. and Ballard, S. P.: A microphysically based precipi-tation scheme for the UK Meteorological Office Unified Model, Q. J. Roy. Meteor. Soc., 125, 1607–1636, 1999.
Woodward, S.: Modeling the atmospheric life cycle and radiative impact of mineral dust in the Hadley Centre climate model, J. Geophys. Res., 106, 18115–18166, 2001.
Yang, Q., W. I. Gustafson Jr., Fast, J. D., Wang, H., Easter, R. C., Morrison, H., Lee, Y.-N., Chapman, E. G., Spak, S. N., and Mena-Carrasco, M. A.: Assessing regional scale predictions of aerosols, marine stratocumulus, and their interactions dur-ing VOCALS-REx usdur-ing WRF-Chem, Atmos. Chem. Phys., 11, 11951–11975, doi:10.5194/acp-11-11951-2011, 2011.
Yang, Q., Gustafson Jr., W. I., Fast, J. D., Wang, H., Easter, R. C., Wang, M., Ghan, S. J., Berg, L. K., Leung, L. R., and Morrison, H.: Impact of natural and anthropogenic aerosols on stratocumu-lus and precipitation in the Southeast Pacific: a regional mod-elling study using WRF-Chem, Atmos. Chem. Phys., 12, 8777– 8796, doi:10.5194/acp-12-8777-2012, 2012.
Yin, Y., Chen, Q., Jin, L., Chen, B., Zhu, S., and Zhang, X.: The effects of deep convection on the concentration and size distribution of aerosol particles within the upper tro-posphere: A case study, J. Geophys. Res., 117, D22202, doi:10.1029/2012JD017827, 2012.
Zubler, E. M., Folini, D., Lohmann, U., Lüthi, D., Schär, C., and Wild, M.: Simulation of dimming and brightening in Europe from 1958 to 2001 using a regional climate model, J. Geophys. Res., 116, D18205, doi:10.1029/2010JD015396, 2011.