Publisher’s version / Version de l'éditeur:
Vous avez des questions? Nous pouvons vous aider. Pour communiquer directement avec un auteur, consultez la première page de la revue dans laquelle son article a été publié afin de trouver ses coordonnées. Si vous n’arrivez pas à les repérer, communiquez avec nous à [email protected].
Questions? Contact the NRC Publications Archive team at
[email protected]. If you wish to email the authors directly, please see the first page of the publication for their contact information.
https://publications-cnrc.canada.ca/fra/droits
L’accès à ce site Web et l’utilisation de son contenu sont assujettis aux conditions présentées dans le site LISEZ CES CONDITIONS ATTENTIVEMENT AVANT D’UTILISER CE SITE WEB.
FS/AWWA Conference [Proceedings], pp. 1-14, 2005-11-01
READ THESE TERMS AND CONDITIONS CAREFULLY BEFORE USING THIS WEBSITE. https://nrc-publications.canada.ca/eng/copyright
NRC Publications Archive Record / Notice des Archives des publications du CNRC :
https://nrc-publications.canada.ca/eng/view/object/?id=0f8ae733-8539-4f69-81a2-635a435dab59 https://publications-cnrc.canada.ca/fra/voir/objet/?id=0f8ae733-8539-4f69-81a2-635a435dab59
NRC Publications Archive
Archives des publications du CNRC
This publication could be one of several versions: author’s original, accepted manuscript or the publisher’s version. / La version de cette publication peut être l’une des suivantes : la version prépublication de l’auteur, la version acceptée du manuscrit ou la version de l’éditeur.
Access and use of this website and the material on it are subject to the Terms and Conditions set forth at
Supplementing drinking water sources by brackish water desalination
http://irc.nrc-cnrc.gc.ca
S u p p l e m e n t i n g d r i n k i n g w a t e r s o u r c e s b y
b r a c k i s h w a t e r d e s a l i n a t i o n
I m r a n , S . A . ; L e e , Y . C . ; M a t h e w s , B . ; T a y l o r ,
J . S .
N R C C - 4 9 2 5 9
A v e r s i o n o f t h i s d o c u m e n t i s p u b l i s h e d i n
/ U n e v e r s i o n d e c e d o c u m e n t s e t r o u v e
d a n s : F S / A W W A C o n f e r e n c e , O r l a n d o , F L . ,
N o v . 2 7 , 2 0 0 5 , p p . 1 - 1 4
Supplementing Drinking Water Sources by Brackish Water
Desalination
Syed A. Imran1, Ying C. Lee , Brian Mathews and James S. Taylor2 3 4
1
Corresponding Author
Institute for Research in Construction – National Research Council, Ottawa, Canada Phone: (613)9930122, Fax: (613)9931866, E-mail: [email protected]
2
Senior Engineer, CPH Engineers Inc., Sanford, Florida
3
City of Palm Coast Utilities, Palm Coast, Florida
4
Professor, University of Central Florida, Orlando, Florida
Abstract
The City of Palm Coast has traditionally relied on the surficial or intermediate Floridian Aquifer for meeting its drinking water demand. In order to reduce over-usage of this environmentally sensitive source, the deeper brackish water Floridian aquifer was identified as an alternate source. A 2½ - month pilot study was conducted to evaluate the feasibility of using reverse osmosis to treat the brackish water to acceptable drinking water quality. The results of the study indicate that the brackish water source can be effectively treated to safe and aesthetic drinking water quality standards. The City can further minimize finishing chemical costs by blending brackish water RO permeate and untreated surficial aquifer in a 3:1 ratio.
Background of the Study
The two main sources of water were the environmentally sensitive (and relatively clean) surficial aquifer. The surficial aquifer is desirable from the treatment point of view due to its low dissolved solid content. However, increased growth and subsequent
utilizing alternative drinking water sources. The alternative source identified was the deeper brackish water aquifer. The brackish aquifer is characterized by high dissolved solids and chloride content. The high chloride in this source necessitates the use of reverse osmosis desalination as opposed to nanofiltration softening.
CPH Engineers Inc., was the chief contractor for the project and responsible for the management and oversight of the pilot operations. The City provided trained personnel from the Palm Coast Utilities to help in daily monitoring, sampling and
maintenance of the pilot unit and upkeep and security of the pilot site. Though the initial planning and preparatory groundwork for the pilot started much earlier, the actual pilot study commenced on 12/16/04 and ended on 3/1/05
The main design objectives of the pilot study were to
1. optimize the usage of both the surficial and brackish water sources,
2. minimize the usage of chemical feeds for pre-treatment and post-treatment, and 3. to have a finished water quality as close to the historical distribution system water
quality to avoid corrosion related problems.
Description of Pilot Study
The pilot study was conducted at the same site as the planned site for the City of Palm Coast’s third water and wastewater treatment plant. The site is located on US Highway 1 and 3 miles north of the Palm Coast Parkway and US 1 intersection. The site was cleared to provide access to drilling equipment, pilot equipment and access vehicles for sampling and maintenance.
The brackish aquifer well (Well #1) was a 12-inch production well drilled to 400 feet depth. The shallow aquifer well (Well #2) was a 4-inch observation well drilled to 80 feet depth. Both the wells were capped and airtight connections to the pilot unit were constructed to prevent external contamination or aeration of the RO feed waters.
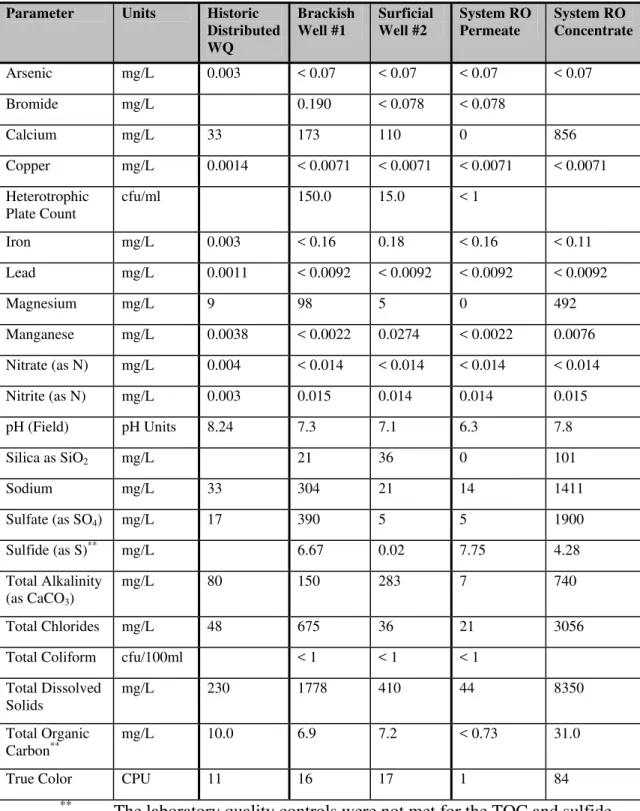
The total dissolved solids (TDS) of the brackish aquifer were approximately 1800 mg/L and varied from 1700 – 1900 mg/L. The major TDS ions were chlorides, sulfates, total alkalinity, sodium, calcium, magnesium and silica. Many metals like aluminum, antimony, barium, beryllium, cadmium, chromium, copper, iron, manganese, mercury, nickel, selenium, silver, strontium, thallium and zinc were detected in very low
concentrations or were below the method detection limit. The regulated organic compounds were below the detection limit. Hydrogen sulfide in the brackish aquifer varied from 4.0 – 8.1 mg/L as S indicating hydrogen sulfide treatment would be required for the permeate and concentrate streams. The silt density index of the brackish aquifer was consistently below 1, which indicated the suitability of the source water for RO treatment.
The range of the shallow aquifer TDS was 390 – 420 mg/L. The major TDS ions were alkalinity, calcium and silica. Chlorides and sodium were relatively low compared to the brackish aquifer. The source water quality is shown in Table 1.
The pilot reverse osmosis system (contracted from Harn R/O, Florida) consisted of pretreatment acid and scale inhibitor chemical injection, cartridge filtration, well boost pump, high pressure feed pump, pressure vessels, RO membrane elements,
instrumentation, controls, and inter-stage booster pump. The design utilized pressure vessels that contain the equivalent of seven membrane elements per pressure vessel staged in a 2-1, two-stage array.
Several pre-pilot computer aided design simulations were conducted for
evaluating the membranes on the two sources and analyzing the design for pre-treatment, scaling, operating pressures and quality of permeate. The City desired that pre-treatment with acid addition be limited due to safety concerns and operational simplicity.
Therefore, the pilot operations were designed to have only pre-filtration and antiscalent addition as pre-treatment. Based on these design and operational requirements, an
appropriate membrane designed for brackish water desalination and capable of significant removal of monovalent ions was selected. The selected system configuration for the pilot study was a two-stage process with a 2:1 configuration. The first stage had two pressure vessels with 7 elements each and the second stage had one pressure vessel with 7
membrane elements. The concentrate stream for the first stage served as the feed stream for the second stage. The permeate streams from the first and second stages were mixed to produce the final permeate stream. The system recovery was 75 – 80% for all cases. The feed flow was set at 24 gpm, which corresponded to a flux of 15.5 gsfd.
Table 1: Average historic, surficial source, brackish source, RO permeate and RO concentrate water quality.
Parameter Units Historic Distributed WQ Brackish Well #1 Surficial Well #2 System RO Permeate System RO Concentrate Arsenic mg/L 0.003 < 0.07 < 0.07 < 0.07 < 0.07 Bromide mg/L 0.190 < 0.078 < 0.078 Calcium mg/L 33 173 110 0 856 Copper mg/L 0.0014 < 0.0071 < 0.0071 < 0.0071 < 0.0071 Heterotrophic Plate Count cfu/ml 150.0 15.0 < 1 Iron mg/L 0.003 < 0.16 0.18 < 0.16 < 0.11 Lead mg/L 0.0011 < 0.0092 < 0.0092 < 0.0092 < 0.0092 Magnesium mg/L 9 98 5 0 492 Manganese mg/L 0.0038 < 0.0022 0.0274 < 0.0022 0.0076 Nitrate (as N) mg/L 0.004 < 0.014 < 0.014 < 0.014 < 0.014 Nitrite (as N) mg/L 0.003 0.015 0.014 0.014 0.015 pH (Field) pH Units 8.24 7.3 7.1 6.3 7.8 Silica as SiO2 mg/L 21 36 0 101 Sodium mg/L 33 304 21 14 1411 Sulfate (as SO4) mg/L 17 390 5 5 1900 Sulfide (as S)** mg/L 6.67 0.02 7.75 4.28 Total Alkalinity (as CaCO mg/L 80 150 283 7 740 3) Total Chlorides mg/L 48 675 36 21 3056
Total Coliform cfu/100ml < 1 < 1 < 1
Total Dissolved Solids mg/L 230 1778 410 44 8350 Total Organic Carbon mg/L 10.0 6.9 7.2 < 0.73 31.0 **
True Color CPU 11 16 17 1 84
**
The laboratory quality controls were not met for the TOC and sulfide analysis
In order to avoid corrosion, red water and dissolution of existing films or chemical scales in the City's distribution system due to introduction of chemically incompatible waters, it was necessary to produce chemically balanced blended water. This was most easily achieved by blending the RO permeate stream with water from the surficial aquifer. Simulations were conducted to evaluate the optimum blend of the brackish aquifer’s RO permeate and the surficial aquifer that would produce water quality that was similar to the existing distribution system water quality. In all the blending discussion, 100 % of the RO permeate stream is used for blending. It should not be inferred that only 72 % of the RO permeate stream is utilized.
It can be observed from Figure 1 that the blend of 25% surficial aquifer and 75% RO permeate is suitable to achieve a blended calcium hardness that is historically similar to the existing distribution system water quality. Similarly as shown in Figure 2, a blend ratio of 25 % surficial aquifer to 75 % RO permeate stream also produces optimum alkalinity. As lower concentrations of sulfates and chlorides are desired, chloride and sulfate water quality is improved by blending as the blended water at 1/3 ratio of surficial aquifer raw water to RO permeate stream produces lower chlorides and sulfates than the historical distribution system water quality.
The pilot was operated in three phases for assessment of water quality and operational criteria for different modes of operation. The different phases were:
Phase 1: two months of operation with Well #1 as feed source for RO treatment at 80% recovery and post-RO blending of permeate with Well #2.
Phase 2: one week of operation with Well #1 as feed source for RO treatment at 75% recovery and post-blending of permeate with Well #2.
Phase 3: one week of operation with Well #2 as feed source for RO treatment at 75% recovery and post-blending of permeate.
0 10 20 30 40 50 60 0 10 20 30 40 5
% Intermediate Aquifer Source
C al ci um ( m g/L ) . 0
Simulated RO permeate and Well #2 Blend Actual Pilot Data
Plant # 1 Historic
Figure 1: Simulated and actual blend calcium for pilot RO softening
0 20 40 60 80 100 120 140 160 0 5 10 15 20 25 30 35 40 45 50
% Intermediate Aquifer Source
T ota l A lk al in ity ( m g Ca C O 3/L )
Simulated RO permeate and Well #2 Blend Actual Pilot Data
Plant # 1 Historic
0 5 10 15 20 25 30 35 40 45 50 0 5 10 15 20 25 30 35 40 45 50
% Intermediate Aquifer Source
C hl or id e ( m g/ L) .
Simulated RO permeate and Well #2 Blend Actual Pilot Data
Plant # 1 Historic
Figure 3: Simulated and actual blend chloride for pilot RO softening
Phase 1 operational conditions were determined as optimum by manufacturer recommendations and computer simulation. Hence, Phase 1 operation was conducted for two months, which was the longest period of operation for any phase. Operational
conditions for Phases 2 and 3 were conducted to evaluate the operational flexibility of the RO plant. A one week period of operation was utilized in Phase 3 and again in Phase 3. Under Phase 1, the pilot unit was operated continuously (with scheduled stops for
generator maintenance) for a period of two months. The system recovery was set at 80%. The operational and system parameters for the three phases are shown in Table 2.
During Phase 2, the system recovery was reduced to 75%. During this phase the flux was increased such that the permeate production would be similar to Phase 1.
In Phase 3 the feed water source was switched to Well #2 (intermediate aquifer source). The system recovery was 75% as this is the highest non-scaling recovery that can be achieved due to high silica in the intermediate aquifer source. The intermediate aquifer is not envisioned as a permanent source for RO treatment. However, it is included as part of the pilot study since the City desired to have the flexibility of using both the sources during initial start-up.
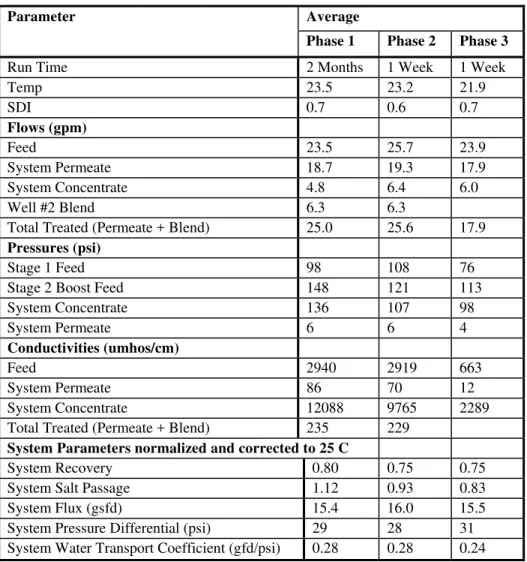
Table 2: Average operational parameters for pilot phases
Average Parameter
Phase 1 Phase 2 Phase 3
Run Time 2 Months 1 Week 1 Week
Temp 23.5 23.2 21.9 SDI 0.7 0.6 0.7 Flows (gpm) Feed 23.5 25.7 23.9 System Permeate 18.7 19.3 17.9 System Concentrate 4.8 6.4 6.0 Well #2 Blend 6.3 6.3
Total Treated (Permeate + Blend) 25.0 25.6 17.9
Pressures (psi)
Stage 1 Feed 98 108 76
Stage 2 Boost Feed 148 121 113
System Concentrate 136 107 98 System Permeate 6 6 4 Conductivities (umhos/cm) Feed 2940 2919 663 System Permeate 86 70 12 System Concentrate 12088 9765 2289
Total Treated (Permeate + Blend) 235 229
System Parameters normalized and corrected to 25 C
System Recovery 0.80 0.75 0.75
System Salt Passage 1.12 0.93 0.83
System Flux (gsfd) 15.4 16.0 15.5
System Pressure Differential (psi) 29 28 31
System Water Transport Coefficient (gfd/psi) 0.28 0.28 0.24
The pilot was operated on a continuous basis for a period of 2.5 months. Out of 2.5 months the system operated normally for 93% of the time. The pilot was not
operational for 4% of the time due to planned shutdowns for generator maintenance and plumbing changes to the system. The remaining 3% of the time the pilot was shutdown to repair and replace a malfunctioning generator. There was no shutdown due to actual pilot malfunction or breakdown. The operating parameters for the pilot under the three phases are listed in Table 2. The system recoveries for the period of pilot operation are shown in Figure 4. The recoveries and fluxes were stable during the first two months of operation (Phase I). Rapid variations are seen in the recoveries and fluxes during the smaller phases (Phase II and Phase III). This is due to a relatively rapid frequency for changing recoveries that resulting in a non-steady conditions. The recoveries were changed back to
Phase I conditions to conduct sampling for acute toxicity tests for the concentrate stream. This change is reflected in the graphs for recoveries and fluxes. The decline in the
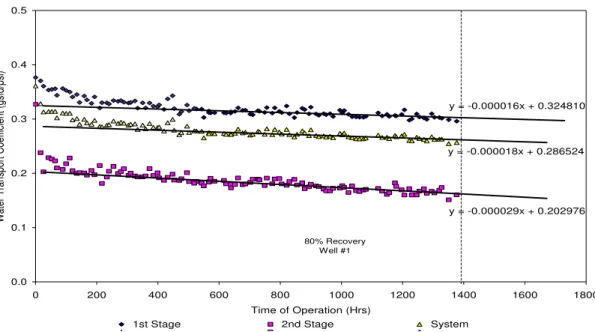
normalized water transport coefficient indicates that the system will have achieved a 15% flux decline in 100 days (Figure 5). This implies that the cleaning frequency for the pilot system would be over 3 times annually.
The permeate water quality analysis indicated greater than 99% removal for most contaminants in the source water. Chlorides and sodium comprised the major portion of the dissolved solid content in the permeate water. The sulfide content in the permeate is high as expected since RO or NF membranes do not reject H2S. However, the analytical
technique used by the professional laboratory for sulfides was inaccurate and therefore an exact measure of the sulfide concentration in the permeate is not known. It can be safely assumed that based on the source-water pH of 7.3 at least 50% of the sulfides from the source will be present in permeate. There was little difference in permeate water quality at 75% and 80% recovery with Well #1 as the RO source.
0.4 0.6 0.8 1.0 0 200 400 600 800 1000 1200 1400 1600 1800 Time of Operation (Hrs) R eco ve ry (F raction ) 40 60 80 100 Recovery ( % )
1st Stage 2nd Stage System
80% Recovery Well #1 75% Recovery Well #1 75% Recovery, Well #2
y = -0.000016x + 0.324810 y = -0.000018x + 0.286524 y = -0.000029x + 0.202976 0.0 0.1 0.2 0.3 0.4 0.5 0 200 400 600 800 1000 1200 1400 1600 1800 Time of Operation (Hrs) Wa te r T rans por t C oef fici en t (g sf d/ psi )
1st Stage 2nd Stage System
80% Recovery Well #1
Figure 5: System, Stage 1 and Stage 2 linear trends of decline in water transport coefficient y = -0.000011x + 0.047340 y = -0.000010x + 0.037419 y = -0.000012x + 0.031056 0.00 0.02 0.04 0.06 0.08 0.10 0 200 400 600 800 1000 1200 1400 1600 1800 Time of Operation (Hrs) So lu te Transpo rt Coe ffic ien t (ft/d)
1st Stage 2nd Stage System
80% Recovery Well #1
Figure 6: System, Stage 1 and Stage 2 linear trends of decline in solute transport coefficient
The main purpose of evaluating the concentrate water quality was to determine the feasibility of different disposal alternatives. Therefore a comprehensive list of potential contaminants was analyzed in the concentrate stream. As expected, the concentrate stream had high dissolved solids consisting of primarily chlorides, sulfates, calcium, magnesium, sodium and alkalinity. Most of the heavy metals, with the
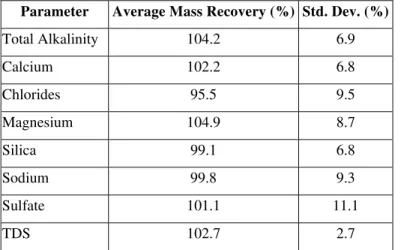
exception of strontium, were either in low concentrations or below the detection level. Mass balance was conducted around selected water quality parameters for system pilot operations using Equation 1. Due to pilot operations paired data was not always available for conducting mass balance. Only paired data, where available was used for these calculations. Another complicating factor was that most heavy metals were at or below detection limits in both the permeate and feed water. Due to the high degree of error associated with measurements in very low concentrations it is not feasible to have meaningful inference from such data. Therefore, only selected parameters were used in this report. A summary of these mass balances for the selected parameters is given in Table 3. The solute mass balances are indicative of the accuracy of the field and laboratory data. Values between 86 and 116 are typical for pilot studies.
[
]
f f c c p p C Q C Q C Q + × 100System percent mass recovery = Equation 1
Table 3: System percent mass recovery
Parameter Average Mass Recovery (%) Std. Dev. (%)
Total Alkalinity 104.2 6.9 Calcium 102.2 6.8 Chlorides 95.5 9.5 Magnesium 104.9 8.7 Silica 99.1 6.8 Sodium 99.8 9.3 Sulfate 101.1 11.1 TDS 102.7 2.7
In order to address the Utilities concern that the sufficient quantity of surficial aquifer may not always be available due to seasonal or demand dynamics, different
percentages (10, 15, 20 and 25%) of surficial aquifer water was blended with the RO permeate to evaluate the optimum blend percentage as well as to estimate the amount of post-treatment chemicals that would be needed to have an acceptable water quality. This was achieved in the field by changing the flow rate of the surficial aquifer blend to correspond to the required blend percentage and then sampling for selected water quality parameters (calcium, alkalinity, chlorides and sulfates etc.).
The goal was to have a water quality similar to the historic water quality. Water quality parameters considered critical for this evaluation and their levels at different percentages of blending are given in Table 4. The water quality of the blends was similar to the predicted water quality from the desktop simulations as shown in Figure 1, Figure 2 and Figure 3. From an operational viewpoint, the optimum blend as defined by
producing a finished water by blending the surficial aquifer with the RO permeate stream following treatment of the brackish aquifer would be 28% of surficial aquifer blended with 72% of reverse osmosis permeate.
Table 4: Blended product water quality for different blend ratios
(Blended Water Quality) % Well #2 Blended with RO Permeate
Parameter Units Historic Plant #1 25% 20% 15% 10%
Calcium mg/L 33 27 22 17 12
Magnesium mg/L 9 1 1 1 1
Sodium mg/L 33 13 14 13 13
Total Alkalinity (as CaCO3) mg/L 80 68 56 42 31
Total Chlorides mg/L 48 23 21 20 20
Sulfate mg/L 17 6 7 8 8
Total Dissolved Solids mg/L 230 125 110 94 70
Conclusions and Recommendations
Reverse osmosis treatment is applicable to the desalination of the brackish water from deeper Floridian aquifer source. High removal of dissolved solids like calcium, alkalinity, magnesium, chloride, sulfate, sodium and other heavy metals was achieved.
Blending with the surficial Floridian aquifer source provided a means of stabilizing the reverse osmosis permeate with respect to calcium carbonate and alkalinity.
The selected membrane has high cleaning frequency (100 days) as evaluated from the flux decline. The normalized flux decline should be monitored closely during the first phase of operation to determine the cause of the increased cleaning frequency.
The permeate and the blended waters meet the primary and secondary water quality standards. However, taste and odor tests are needed to determine the aesthetic water quality. The finished water needs to be treated for sulfide removal, dissolved oxygen content, pH elevation and chloramination. The full-scale facility should be operated at or below 80% recovery due to
potential for fouling by silica.
The optimum blend determined from simulations and pilot study are 25-28% surficial aquifer blended with 75-72% reverse osmosis permeate.
Recommendations for Full-Scale Plant
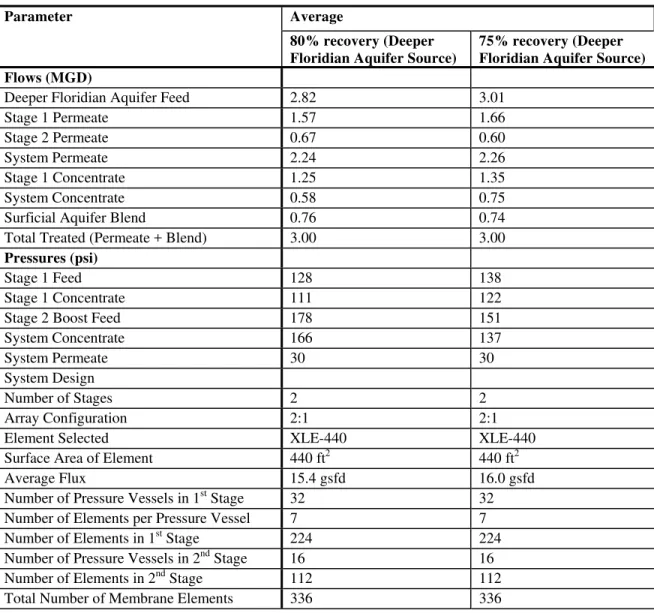
It is proposed to develop the ultimate 9 MGD production in three phases of 3 MGD each. Therefore, during the first phase of construction the design is only for a 3 MGD capacity. Additional capacity will be installed in multiples of 3 MGD. Table 5 gives the recommended flows, pressures and system configuration for the full-scale unit.
Table 5: Design flows, pressures and system configuration for full-scale plant
Average Parameter
80% recovery (Deeper Floridian Aquifer Source)
75% recovery (Deeper Floridian Aquifer Source) Flows (MGD)
Deeper Floridian Aquifer Feed 2.82 3.01
Stage 1 Permeate 1.57 1.66
Stage 2 Permeate 0.67 0.60
System Permeate 2.24 2.26
Stage 1 Concentrate 1.25 1.35
System Concentrate 0.58 0.75
Surficial Aquifer Blend 0.76 0.74
Total Treated (Permeate + Blend) 3.00 3.00
Pressures (psi)
Stage 1 Feed 128 138
Stage 1 Concentrate 111 122
Stage 2 Boost Feed 178 151
System Concentrate 166 137
System Permeate 30 30
System Design
Number of Stages 2 2
Array Configuration 2:1 2:1
Element Selected XLE-440 XLE-440
Surface Area of Element 440 ft2 440 ft2
Average Flux 15.4 gsfd 16.0 gsfd
Number of Pressure Vessels in 1st Stage 32 32
Number of Elements per Pressure Vessel 7 7
st
Number of Elements in 1 Stage 224 224
Number of Pressure Vessels in 2nd Stage 16 16
nd
Number of Elements in 2 Stage 112 112