Publisher’s version / Version de l'éditeur:
Vous avez des questions? Nous pouvons vous aider. Pour communiquer directement avec un auteur, consultez la
première page de la revue dans laquelle son article a été publié afin de trouver ses coordonnées. Si vous n’arrivez pas à les repérer, communiquez avec nous à PublicationsArchive-ArchivesPublications@nrc-cnrc.gc.ca.
Questions? Contact the NRC Publications Archive team at
PublicationsArchive-ArchivesPublications@nrc-cnrc.gc.ca. If you wish to email the authors directly, please see the first page of the publication for their contact information.
https://publications-cnrc.canada.ca/fra/droits
L’accès à ce site Web et l’utilisation de son contenu sont assujettis aux conditions présentées dans le site LISEZ CES CONDITIONS ATTENTIVEMENT AVANT D’UTILISER CE SITE WEB.
Client Report (National Research Council of Canada. Construction), 2014-12-31
READ THESE TERMS AND CONDITIONS CAREFULLY BEFORE USING THIS WEBSITE.
https://nrc-publications.canada.ca/eng/copyright
NRC Publications Archive Record / Notice des Archives des publications du CNRC : https://nrc-publications.canada.ca/eng/view/object/?id=6e692f41-97b6-46f5-80a3-76ce83b4e3d1 https://publications-cnrc.canada.ca/fra/voir/objet/?id=6e692f41-97b6-46f5-80a3-76ce83b4e3d1
NRC Publications Archive
Archives des publications du CNRC
For the publisher’s version, please access the DOI link below./ Pour consulter la version de l’éditeur, utilisez le lien DOI ci-dessous.
https://doi.org/10.4224/21274582
Access and use of this website and the material on it are subject to the Terms and Conditions set forth at
Climatological analysis for hygrothermal performance evaluation: Mid-rise wood: report to Research Consortium for Wood and Wood-Hybrid Mid-Rise Buildings
NATIONAL RESEARCH COUNCIL CANADA
REPORT TO RESEARCH CONSORTIUM
FOR WOOD AND WOOD-HYBRID
MID-RISE BUILDINGS
Climatological Analysis for Hygrothermal
Performance Evaluation: Mid-Rise Wood
CLIENT REPORT: A1-100035-03.2
REPORT TO RESEARCH CONSORTIUM FOR WOOD
AND WOOD-HYBRID MID-RISE BUILDINGS
Climatological Analysis for Hygrothermal Performance
Evaluation: Mid-Rise Wood
S.M. Cornick and M.C. Swinton
Report No. A1-100035-03.2 Report date: December 31, 2014 Contract No. B-7000 (A1-100035) Prepared for Canadian Wood Council
FPInnovations
Régie du bâtiment du Québec
HER MAJESTY THE QUEEN IN RIGHT OF ONTARIO as represented by the Minister of Municipal Affairs and Housing
17 pages
This report may not be reproduced in whole or in part without the written consent of both the client and the National Research Council of Canada.
Table of Contents
Contents
Part 1. Locations ...1
Two selection criteria: thermal and moisture ...2
Selecting locations ...2
Recommendations...10
Part 2. Driving-rain wind pressure and spay rates for water entry testing ...12
References...14
CLIMATOLOGICAL ANALYSIS FOR HYGROTHERMAL
PERFORMANCE EVALUATION: MID-RISE WOOD
S.M. Cornick and M.C. Swinton
This report discusses the selection of locations for the hygrothermal simulation task of the project on Mid-rise Wood Buildings and the determination of spray-rates and pressure differentials for the water penetration testing portion of the project.
Part 1. Locations
The objective of the task is to select, from the 679 locations in Table C-2 of the 2010 National Building Code of Canada (NBC 2010) [1], several representative locations for which long-term historical weather data exists. This information from these locations can subsequently be used to determine the exterior boundary conditions for input files for hygrothermal simulation programs and hygrothermal testing in the laboratory.
The design of the exterior walls of proposed mid-rise wood buildings is covered by Part 5, “Environmental Separation,” of the NBCC 2010 [1]. Such exterior claddings should be designed by an engineer or architect. Although not specifically mandated, in general, the exterior walls are designed as pressure moderated rainscreen walls, i.e. the walls have a drainage cavity [2].
The exterior walls considered in this report are all assumed to conform to 2011 National Energy Code for Buildings (NECB 2011), specifically Sentence 3.2.2.2.(1) and Table 3.2.2.2 [3]. The NECB 2011 defines six different climatic regions for Canada. Examination of Table 3.2.2.2 shows that there are 5 different insulation requirements for the 6 climate zones; zones 7a and 7b have the same insulation requirements. There are potentially at least 5 different wall systems to evaluate assuming that 5 different insulation levels are proposed. While the NECB 2011 climate zones are strictly thermal zones, the IECC and ANSI/ASHRAE Standard 169 [4][5] further refine the thermal zones into marine, dry, and humid. Although originally defined for HVAC and humidification and dehumidification purposes, the sub-classification of thermal zones into moisture zones can be useful for the purpose of cladding evaluation. For the purposes of this project, the marine and humid zones have been combined into one zone classified as wet. For each thermal zone a dry and wet representative location was selected where possible1.
Experimenters and modellers should be able to investigate the performance of the proposed exterior wall systems under higher or lower moisture loadings in a given thermal zone if
1Zones 7 and 8 are very cold zones that for HVAC purposes are not divided into dry and humid classes. For moisture related purposes neither are they are generally classified as humid or dry; these climates tend to be dry given that the climates are very cold, much of the precipitation is delivered in solid not liquid form.
required. A minimum of 9 locations was envisaged, one for each thermal/moisture zone combination.
Classification criteria: thermal and moisture
The first criterion is thermal. Zones are delineated by degree-days below 18°C, hereafter known as HDD18 [6]. This requirement is obtained from the NEBC 2011. The zones are given in Table 1below along with the prescribed overall thermal transmittance requirements for above-grade opaque walls. In Figure 1 is shown the distribution of the thermal zones in Canada.
The second criterion is moisture related. A practical definition of what constitutes wet and dry can be gleaned from the NBCC 2010. A moisture index, MI, is defined in the NBCC 2010 [Volume 2, Appendix C, Division B, C-6] (see Figure 2). The exterior cladding design criteria for Part 9 buildings are specified by the clauses 9.27.2.2.5 (a) and (b). These clauses mandate that exterior walls should include a drainage cavity if MI > 1. For MI ≤ 1 a drainage cavity is not required. Note that Part 9 of the code specifies in climates with MI > 0.9 and HDD18 < 3400 a drainage cavity is required; i.e. the “Victoria exception”. Thus the definition for wet and dry can be taken as MI >1 and M ≤ 1, respectively. This also admits the possibility of establishing boundary conditions and input files for cases where a proposed exterior wall is not a rainscreen wall. Such walls would be permitted under Part 5 of the NBCC2010. Note that for Zones, 7a, 7b, and 8 (Artic/Subarctic) there are no wet locations and similarly for Zone 4 (Mixed) there are no
dry Canadian locations as per the NBCC 2010.
A third criterion is population. For each thermal and moisture division the largest population center would be selected as the representative location.
Selecting locations
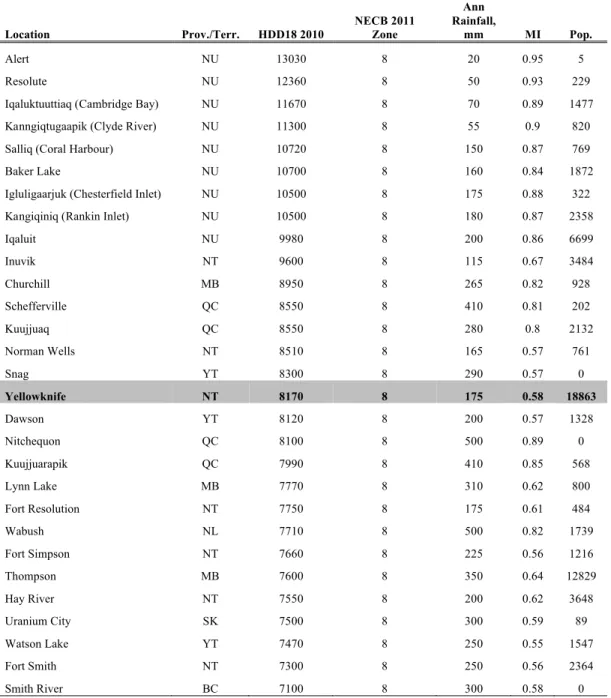
Zone 8: There are 61 locations in Zone 8, 29 of which have long-term data readily available
(Table 2). The coldest location in the dataset is Alert NU (82°30′05″N 062°20′20″W) at 13,030 HDD18. The largest, coldest community is Cambridge Bay; with a population of 1477 with 11,670 HDD18. There are three large communities grouped around 10,000 degree-days, Iqaluit being the largest, with a population of 6,699. There is no climatological reason why the coldest location should not be used as a location for this project. However, from a Building Code
perspective, a solution that works for all locations is required then Alert should be selected. That being said it is unlikely that any mid-rise wood buildings would ever be constructed in Alert. The most likely place that such a building might be constructed would be Iqaluit. The largest
Figure 1 Extended climate zone map of Canada. Zones defined by HDD18.
Table 1Thermal Zones and Overall Thermal Transmittance Requirements (source: Table 3.2.2.2. NECB 2011)
Description Zone HDD18 U-overall W/(m2K)*
Subarctic/Arctic 8/9 >=7000 0.183 Very Cold 7b <7000 0.210 Very Cold 7a <6000 0.210 Cold 6 <5000 0.247 Cool 5 <4000 0.278 Mixed 4 <3000 0.315
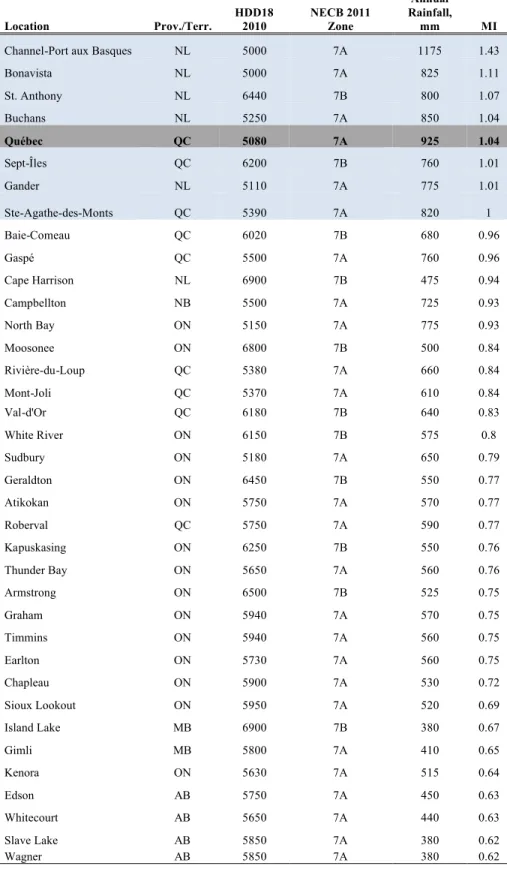
Figure 2 MI values for Table C-2 locations and MI contours for Canada based on 2010 NBC Zones 7a and 7b: The insulation requirements in the NECB 2011 for zones 7a and 7b are
identical; consequently the zones for this analysis have been combined. There are 215 locations in Table C-2 that fall into Zone 7 (Table 3). The bulk of the locations in Zone 7 are dry (194). Two representative locations for Zone 7 are required; a very cold dry location and a very cold
wet location. St. Anthony NF is the coldest wet location for which long-term data is available
(HDD18 = 6440; MI = 1.07). The wettest very cold location is Channel-Port aux Basques (5000, 1.43). If there is the assumption that MI is a measure of the risk of moisture damage for a given location, then Port-aux Basques is the recommended location for Zone 7 wet. The risk of interstitial vapour condensation in building envelope assemblies is usually higher in a colder climate. If large population centers are of interest then Quebec City (5080/1.04) would be an appropriate for a cold wet location, whereas the large population center in Zone 7 having a cold
Table 2 Zone 8: Locations with long-term data
Location Prov./Terr. HDD18 2010 NECB 2011 Zone
Ann Rainfall,
mm MI Pop.
Alert NU 13030 8 20 0.95 5
Resolute NU 12360 8 50 0.93 229 Iqaluktuuttiaq (Cambridge Bay) NU 11670 8 70 0.89 1477 Kanngiqtugaapik (Clyde River) NU 11300 8 55 0.9 820 Salliq (Coral Harbour) NU 10720 8 150 0.87 769 Baker Lake NU 10700 8 160 0.84 1872 Igluligaarjuk (Chesterfield Inlet) NU 10500 8 175 0.88 322 Kangiqiniq (Rankin Inlet) NU 10500 8 180 0.87 2358 Iqaluit NU 9980 8 200 0.86 6699 Inuvik NT 9600 8 115 0.67 3484 Churchill MB 8950 8 265 0.82 928 Schefferville QC 8550 8 410 0.81 202 Kuujjuaq QC 8550 8 280 0.8 2132 Norman Wells NT 8510 8 165 0.57 761 Snag YT 8300 8 290 0.57 0 Yellowknife NT 8170 8 175 0.58 18863 Dawson YT 8120 8 200 0.57 1328 Nitchequon QC 8100 8 500 0.89 0 Kuujjuarapik QC 7990 8 410 0.85 568 Lynn Lake MB 7770 8 310 0.62 800 Fort Resolution NT 7750 8 175 0.61 484 Wabush NL 7710 8 500 0.82 1739 Fort Simpson NT 7660 8 225 0.56 1216 Thompson MB 7600 8 350 0.64 12829 Hay River NT 7550 8 200 0.62 3648 Uranium City SK 7500 8 300 0.59 89 Watson Lake YT 7470 8 250 0.55 1547 Fort Smith NT 7300 8 250 0.56 2364 Smith River BC 7100 8 300 0.58 0
Table 3 Zones 7a and 7b: Locations with long-term data*
Location Prov./Terr. HDD18 2010 NECB 2011Zone
Annual Rainfall,
mm MI
Channel-Port aux Basques NL 5000 7A 1175 1.43 Bonavista NL 5000 7A 825 1.11 St. Anthony NL 6440 7B 800 1.07 Buchans NL 5250 7A 850 1.04 Québec QC 5080 7A 925 1.04 Sept-Îles QC 6200 7B 760 1.01 Gander NL 5110 7A 775 1.01 Ste-Agathe-des-Monts QC 5390 7A 820 1 Baie-Comeau QC 6020 7B 680 0.96 Gaspé QC 5500 7A 760 0.96 Cape Harrison NL 6900 7B 475 0.94 Campbellton NB 5500 7A 725 0.93 North Bay ON 5150 7A 775 0.93 Moosonee ON 6800 7B 500 0.84 Rivière-du-Loup QC 5380 7A 660 0.84 Mont-Joli QC 5370 7A 610 0.84 Val-d'Or QC 6180 7B 640 0.83 White River ON 6150 7B 575 0.8 Sudbury ON 5180 7A 650 0.79 Geraldton ON 6450 7B 550 0.77 Atikokan ON 5750 7A 570 0.77 Roberval QC 5750 7A 590 0.77 Kapuskasing ON 6250 7B 550 0.76 Thunder Bay ON 5650 7A 560 0.76 Armstrong ON 6500 7B 525 0.75 Graham ON 5940 7A 570 0.75 Timmins ON 5940 7A 560 0.75 Earlton ON 5730 7A 560 0.75 Chapleau ON 5900 7A 530 0.72 Sioux Lookout ON 5950 7A 520 0.69 Island Lake MB 6900 7B 380 0.67 Gimli MB 5800 7A 410 0.65 Kenora ON 5630 7A 515 0.64 Edson AB 5750 7A 450 0.63 Whitecourt AB 5650 7A 440 0.63 Slave Lake AB 5850 7A 380 0.62 Wagner AB 5850 7A 380 0.62
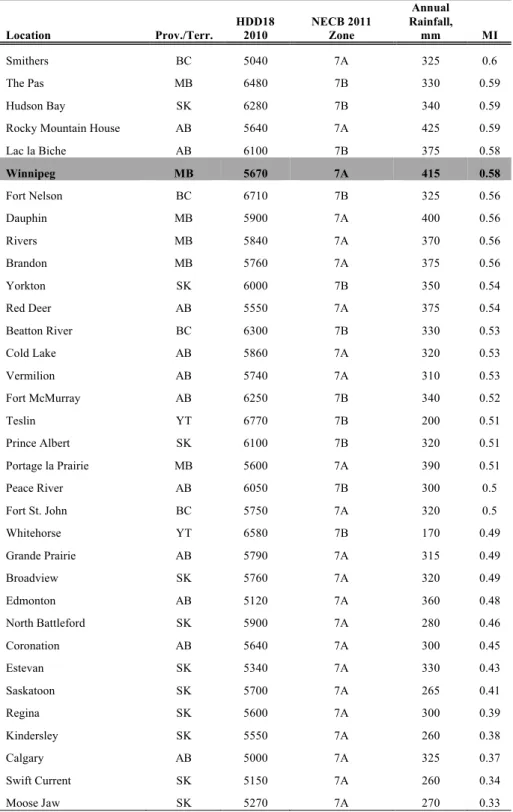
Table 3 cont’d Zones 7a and 7b: Locations with long-term data Location Prov./Terr. HDD18 2010 NECB 2011 Zone Annual Rainfall, mm MI Smithers BC 5040 7A 325 0.6 The Pas MB 6480 7B 330 0.59 Hudson Bay SK 6280 7B 340 0.59 Rocky Mountain House AB 5640 7A 425 0.59 Lac la Biche AB 6100 7B 375 0.58 Winnipeg MB 5670 7A 415 0.58 Fort Nelson BC 6710 7B 325 0.56 Dauphin MB 5900 7A 400 0.56 Rivers MB 5840 7A 370 0.56 Brandon MB 5760 7A 375 0.56 Yorkton SK 6000 7B 350 0.54 Red Deer AB 5550 7A 375 0.54 Beatton River BC 6300 7B 330 0.53 Cold Lake AB 5860 7A 320 0.53 Vermilion AB 5740 7A 310 0.53 Fort McMurray AB 6250 7B 340 0.52 Teslin YT 6770 7B 200 0.51 Prince Albert SK 6100 7B 320 0.51 Portage la Prairie MB 5600 7A 390 0.51 Peace River AB 6050 7B 300 0.5 Fort St. John BC 5750 7A 320 0.5 Whitehorse YT 6580 7B 170 0.49 Grande Prairie AB 5790 7A 315 0.49 Broadview SK 5760 7A 320 0.49 Edmonton AB 5120 7A 360 0.48 North Battleford SK 5900 7A 280 0.46 Coronation AB 5640 7A 300 0.45 Estevan SK 5340 7A 330 0.43 Saskatoon SK 5700 7A 265 0.41 Regina SK 5600 7A 300 0.39 Kindersley SK 5550 7A 260 0.38 Calgary AB 5000 7A 325 0.37 Swift Current SK 5150 7A 260 0.34 Moose Jaw SK 5270 7A 270 0.33
Table 4 Zones 6: Locations with long-term data* Location Prov./Terr. HDD18 2010 NECB 2011 Zone Annual Rainfall, mm MI Halifax NS 4000 6 1350 1.49 Argentia NL 4600 6 1250 1.47 St. John's NL 4800 6 1200 1.41 Sydney NS 4530 6 1200 1.36 Saint John NB 4570 6 1100 1.27 Stephenville NL 4850 6 1000 1.19 Debert NS 4500 6 1000 1.16 Truro NS 4500 6 1000 1.16 Charlottetown PE 4460 6 900 1.09 Terrace BC 4150 6 950 1.08 Greenwood (CFB) NS 4140 6 925 1.05 Summerside PE 4600 6 825 1.03 Sherbrooke QC 4700 6 900 1.03 Fredericton NB 4670 6 900 1.02 Moncton NB 4680 6 850 1.02 Miramichi NB 4950 6 825 0.97 Kingston ON 4000 6 780 0.96 Montréal-Est QC 4470 6 830 0.93 Montréal-Nord QC 4470 6 830 0.93 Saint-Eustache QC 4500 6 820 0.92 St-Hubert QC 4490 6 820 0.92 Sault Ste. Marie ON 4960 6 660 0.89
Dorval QC 4400 6 760 0.85 Gore Bay ON 4700 6 640 0.84 Ottawa (M-C Int'l Airport) ON 4500 6 750 0.84 Ottawa (Orleans) ON 4500 6 750 0.84 Peterborough ON 4400 6 710 0.83 Petawawa ON 4980 6 640 0.8 Prince George BC 4720 6 425 0.58 Quesnel BC 4650 6 380 0.51 Williams Lake BC 4400 6 350 0.47 Kimberley BC 4650 6 350 0.38 Cowley AB 4810 6 310 0.36 Cranbrook BC 4400 6 275 0.3 Lethbridge AB 4500 6 250 0.26 Medicine Hat AB 4540 6 250 0.25
Zone 6: There are 252 locations in Zone 6 as given in Table C-2 of the 2010 NBC, 194 classified
as dry and 58 wet. Of those for which long-term data exists there are 15 wet locations and 21 dry locations (Table 4). Two representative locations for Zone 6 are required; a cold dry location and a cold wet location. Stephenville NF is the coldest wet location for which long-term data is available (HDD18 = 4850; MI = 1.19). The wettest cold location is Halifax (4000, 1.49). If the assumption that MI is a measure of the risk of moisture damage for a given location then Halifax is the recommended Zone 6 wet location. If large population centers are of interest then Halifax would again be appropriate.
For a cold dry location Petawawa ON is appropriate (HDD18 = 4980; MI = 0.80). The coldest large population center in Zone 6 is Ottawa (4500/0.86).
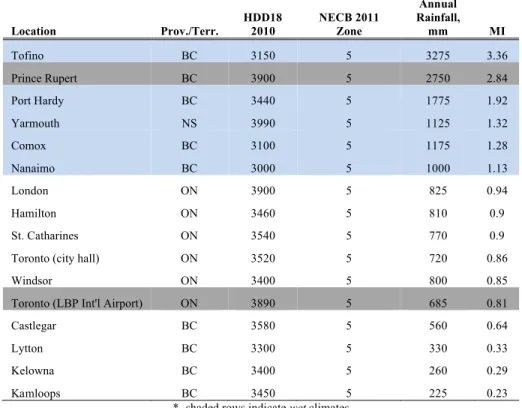
Zone 5: There are 123 Zone 5 locations in Table C-2 of the 2010 NBC, 89 classified as dry and
34 wet. Of those for which long-term data exists there are 6 wet locations and 10 dry locations (Table 5). Two representative locations for Zone 5 are required; a cool dry location and a cool
wet location. Yarmouth NS is the coolest wet location for which long-term data is available
(HDD18 = 3990; MI = 1.32). The wettest cool location is Tofino BC (3150, 3.36). If the
assumption that MI is a measure of the risk of moisture damage for a given location, the Tofino is the recommended Zone 5 wet location. If large population centers are of interest then Prince Rupert BC would be appropriate.
Table 5 Zone 5: Locations with long-term data*
Location Prov./Terr. HDD18 2010 NECB 2011 Zone
Annual Rainfall, mm MI Tofino BC 3150 5 3275 3.36 Prince Rupert BC 3900 5 2750 2.84 Port Hardy BC 3440 5 1775 1.92 Yarmouth NS 3990 5 1125 1.32 Comox BC 3100 5 1175 1.28 Nanaimo BC 3000 5 1000 1.13 London ON 3900 5 825 0.94 Hamilton ON 3460 5 810 0.9 St. Catharines ON 3540 5 770 0.9 Toronto (city hall) ON 3520 5 720 0.86 Windsor ON 3400 5 800 0.85 Toronto (LBP Int'l Airport) ON 3890 5 685 0.81 Castlegar BC 3580 5 560 0.64
Lytton BC 3300 5 330 0.33
Kelowna BC 3400 5 260 0.29 Kamloops BC 3450 5 225 0.23
For a cool dry location, London ON is appropriate (HDD18 = 3900; MI = 0.94), with a relative higher MI among all the locations. The coldest large population center in Zone 5 is, however, Toronto.
Zone 4: There are 28 Zone 4 locations in Table C-2 of the 2010 NBC, 24 classified as dry and 4 wet (Table 6). Of those for which long-term data exists, there are 4 wet locations and 1 dry
location. Only one representative location for Zone 4 is required. Why? The reason is based on the NBCC Part 9 requirement, Clause 9.27.2.2.5 (a), which defines the wet criterion to be MI > 0.9 for all Canadian Zone 4 locations. The coldest location for which long-term data is available is Duncan BC (HDD18 = 2980; MI = 1.13). The wettest location is Port Renfrew BC (2900, 3.64). If large population centers are of interest, then Vancouver would be an appropriate choice of location.
Table 6 Zone 4: Locations with long-term data*
Location Prov./Terr. HDD2010 NECB 2011 Zone AnnR, mm MI
Port Renfrew BC 2900 4 3600 3.64 Vancouver Int’l BC 2925 4 1325 1.44 Duncan BC 2980 4 1000 1.13 Crofton BC 2880 4 925 1.06 Victoria BC 2650 4 800 0.98
*- all climates in this zone are wet climates
Criteria for selecting locations
Three selection criteria are possible: (1) the largest population center in a 2011 NECB zone or moisture class; (2) a thermal criterion, i.e., most degree-days below 18°C, and; (3) a moisture-based criterion, i.e., the MI. Suggested locations are taken from the respective list of locations having long-term climate data provided in Tables 2 to 6.
Recommendations
It is recommended that the locations listed in Table 7, and shown in Figure 3, selected using the population based criteria, be used for this project. These locations represent large markets within the specified climate zones where mid-rise wood buildings are likely to be built. Locations selected using the other two criteria are given in the Appendix.
Table 7 Recommended locations primarily based on population
Zone
Description Zone Wet (MI > 1) Dry (MI ≤1)
Subarctic/Arctic 8/9 n/a Yellowknife (8170/0.58)* Very Cold 7 Quebec City (5080/1.04) Winnipeg (5670/0.58) Cold 6 Halifax (4000/1.49) Ottawa Int’l (4500/0.84) Cool 5 Prince Rupert (3900/2.84) Toronto (Pearson)(3980/0.86) Mixed 4 Vancouver (Int'l) (2925/1.44) n/a
* - bracketed terms are HDD18 and MI respectively
Part 2. Driving-rain wind pressure and spay rates for water entry testing
Upper limit values were determined for water entry testing of the proposed mid-rise wood walls (see the water penetration test report). The test protocol consisted of three deposition rates horizontally deposited directly above deficiencies placed in each wall specimen. The deposition rates were 0.58 l/min-m2, 1.16 l/min-m2, and 1.74 l/min-m2. The range of spray rates cover the
maximum observed and expected hourly Wind-Driven Rain (WDR) intensities for a 1 in 50 year return period for most locations in Canada (see Figure 4)2.
Generally when considering shorter averaging periods the horizontal rainfall intensity is increased from hourly intensity [7]. The calculation of WDR, however, is not directly
proportional to horizontal rainfall intensity. Larger raindrop sizes tend to occur at higher rainfall intensities and can actually reduce the amount of WDR rain over a 10-minute averaging period, the reduction ranging between 85 and 95% [8][9][10]. A conservative assumption is to assume no reduction in WDR intensity for shorter averaging periods.
Figure 4 WDR rates for various locations in Canada.
Each deposition rate was tested at several steps of pressure differential across the specimen. The pressure differential ranged from 0 Pa, up to 1150 Pa. A comprehensive survey of extreme Driving-Rain Wind Pressures (DRWP) was undertaken by Welsh, Skinner, and Morris [11]. The highest extreme hourly DRWP values in the report were calculated for a 1 in 30 year return period at minimum rainfall intensity of 1.8 mm/h. Since the report also provided the mean and standard deviation of the sets of extreme values, it was straightforward to estimate 1 in 50 values. The values reported were at the standard World Meteorological Organization height of 10 m above grade. With respect to the variation of wind speed with height, most of the wind speed data came from airport locations which are open environments. The assumption that the building
0.00 0.10 0.20 0.30 0.40 0.50 0.60 0.70 0.80 0.90 1.00
W
D
R,
l/
m
in
is located in similar terrain is conservative in that the wind speed will increase with height. If the building is assumed to be located in urban terrain then translating the wind speed from an open environment to an urban environmental will result in a decrease in wind speed for the same height on the order of 50 to 70%. The wind pressure values were adjusted using a power law for the estimated height of a 6 storey mid-rise wood building, 18 m. Assuming an exponent of 1/7 for urban areas the scaling factor for wind pressures measured from the standard height was 1.18 or 18% [12]. The highest expected 1 in 50 values for DRWP for a mid-rise building, derived from Welsh, Skinner, and Morris, and are listed below in Table 8 [11].
The limit of the current test apparatus at NRC is 1250 Pa, the maximum upper range of the pressure sensors. The effective safe limit for laboratory testing was determined to be 1150 Pa. A 1150 Pa peak pressure covers all of Canada except for the south western tip of Newfoundland (St. Andrews) and the western side of Haida Gwaii (the Queen Charlotte Islands). The locations are listed in Table 8. Therefore all the locations listed in Table 7 are adequately by this testing pressure.
Each pressure step is conducted at each water deposition rate for 10 minutes. Even if the wind pressures are increased by 14% to account for a 10-minute averaging period, most Canadian locations are adequately covered [13].
Table 8 1 in 30 and 1 in 50 Year DRWP’s for various locations in Canada, Pa [11] Location 1 in 30 DRWP @ 10m 1 in 50 DRWP @ 10m 1 in 50 DRWP @ 18m 10-minute wind Cape St. James 1240 1338 1582 1804 St. Andrews 1191 1296 1533 1745 Spring Island 902 969 1147 1307 Grind Stone Island 754 810 958 1092 Battle Harbour 668 727 860 980 Sandspit 625 659 779 888 Sable Island 617 669 791 902 Summerside 602 660 781 890 Port Aux Basques 600 648 767 874 St. John's 593 647 765 872 Daniel's Harbour 583 634 749 854 Twillingate 583 636 753 858
References
[1] Canadian Commission on Building and Fire Codes, National Research Council of Canada. National Building Code of Canada 2010. Ottawa.
[2] Rousseau, M. Z.; Poirier, G. F.; Brown, W. C., Pressure Equalization in Rainscreen Wall
Systems, Construction Technology Update, 17, 1998-07, Institute for Research in
Construction, National Research Council of Canada p. 6
[3] Canadian Commission on Building and Fire Codes, National Research Council of Canada. National Energy Code for Buildings 2011. Ottawa.
[4] ICC (International Code Council). 2012 International Energy Conservation Code (IECC). Falls Church, VA: International code congress.
[5] ANSI/ASHRAE 169-2006 “Weather Data for Building Design Standards (ANSI Approved)”, American Society of Heating, Refrigerating and Air-Conditioning Engineers, 2006, 70 pages.
[6] http://www.climate.weatheroffice.gc.ca/Glossary-popup_e.html
[7] Choi, E.C.C., “Wind-Driven Rain and Driving Rain Coefficient During Thunderstorms and Non-Thunderstorms,” Journal of Wind Engineering and Industrial Aerodynamics, Vol. 89, 2001, pp. 293–308.
[8] Best, A.C., “The size distribution of raindrops,” Quarterly Journal of Royal Meteorological Society, Vol. 76, 1950, pp. 16-36.
[9] Straube, J.F. and Burnett, E.F.P., Building Science for Building Enclosures, Chapter 12, Building Science Press, Westford, MA, 2005, 549
[10] Cornick, S. M. and M. A. Lacasse (2009), An Investigation of Climate Loads on Building Facades for selected locations in the US, submitted to: ASTM E06 Symposium Up Against the Wall - An Examination of Building Envelope Interface Techniques and Systems, Journal of ASTM International (JAI) Volume 6, No. 2 (DOI
10.1520/JAI1011210)
[11] Welsh, L. E., Skinner, W. R., and Morris, R. J., A Climatology of Driving Rain Pressure for Canada, Climate and Atmospheric Research Directorate Draft Report, Environment Canada, Atmospheric Environment Service. 1989.
[12] W. A. Dalgliesh and D. W. Boyd, CBD-28. Wind on Buildings, Institute for Research in Construction, National Research Council of Canada, April 1962 p. 4.
[13] ASCE 7-95 Minimum Design Loads for Buildings and Other Structures, American Society of Civil Engineers, 345 East 47th Street New York, NY 10017-2398, p. 155.
Appendix A
Additional Climate Information
Table A.1 Locations selected using thermal based criteria (HDD18)
Zone Description Zone Wet (MI > 1) Dry (MI ≤1)
Arctic/Subarctic 8 n/a Alert (13030/0.95)* Very Cold 7 St. Anthony (6440/1.07) Island Lake (6900/0.67) Cold 6 Stephenville (4850/1.19) Petawawa (4980/0.8) Cool 5 Yarmouth (3990/1.39) London (3900/0.94) Mixed 4 Duncan (2980/1.1.3) n/a
Table A.2 Locations selected using moisture based criteria (MI)
Zone Description
Zone Wet (MI > 1) Dry (MI ≤1)&
Arctic/Subarctic 8 n/a Watson Lake (7470/0.55) Very Cold 7 Channel-Port aux Basques
(5000/1.43) Moose Jaw (5270/0.33) Cold 6 Halifax (4000/1.49) Medicine Hat (4540/0.25) Cool 5 Tofino (3150/3.36) Kamloops (3450/0.23) Mixed 4 Port Renfrew (2900/3.64) n/a
* - bracketed terms are HDD18 and MI respectively
& - These locations are provided for completeness only. Limited information on moisture performance is to be gained from evaluating the driest location in a thermal zone.