Properties of B-site substituted
La
0
:5
Sr
0
:5
FeO
3
δ
perovskites
for application in oxygen separation membranes
Defne Bayraktar&Stefan Diethelm&Thomas Graule& Jan Van herle&Peter Holtappels
Received: 15 March 2007 / Accepted: 21 January 2008 / Published online: 7 February 2008 # Springer Science + Business Media, LLC 2008
Abstract Mixed ionic–electronic conducting La0:5Sr0:5 Fe1 xBxO3 δ (B: Al, Cr, Zr, Ga, Ti, Sn, Ta, V, Mg, and In withx=0, 0.1, 0.2) perovskite materials were produced via solid-state synthesis. In order to study the effect of B-site substitution on the expansion behavior of these materials, their thermal expansion in air up to 900°C and isothermal expansion at the same temperature from air to Ar were measured by dilatometry. Ti and Ta were found to be the most effective substitutions in suppressing the isothermal expansion. The isothermal expansion at 900°C from air to Ar was reduced by 50% by substitution of 20% Ti or 10% Ta. Therefore, these compositions were further characterized by 4-probe total DC conductivity and permeation measurements under air/Ar gradient. The total conductivity of La0:5Sr0:5FeO3 δ was decreased by more than one order of magnitude at low temperatures and from 430 S/cm, which is the maximum, to around 100 S/cm at 500°C with the addition of Ti and Ta. The normalized oxygen permeation of LSF at 900°C decreased from 0.18 to
0.05 μmol/cm2s and 0.07 μmol/cm2s with the substitution of 20% Ti and 10% Ta, respectively.
Keywords Isothermal expansion . Oxygen permeation . Mixed ionic electronic conductor . Perovskite
1 Introduction
Mixed ionic electronic conducting (MIEC) perovskites or related materials receive considerable attention for the application as oxygen separation membranes for air separation [1–3]. The challenge for application of these materials is the lack of chemical and mechanical stability [4] as a result of the oxygen activity difference across the membranes, especially in case of partial oxidation applica-tions, such as syngas production from methane. Significant chemical expansion is observed in MIEC perovskite materials in reducing atmospheres associated with the reduction of the B-site cation, which induces mechanical stress. The stabilities of the materials are commonly improved by B-site doping with a more stable cation such as Cr, Al, Ga, etc [5–7], however these additions are reported to cause a decrease in ionic conductivity with exception of Ga [8] in oxidizing conditions. Therefore, it is important to screen cations for B-site substitution to optimize the properties of the perovskite material.
In the presented work, La0:5Sr0:5FeO3 δ was chosen as the host material. This material was reported to possess the highest ionic conductivity in this series of materials with Sr-substitution on the A-site [9]. Several elements with different valence states were used to substitute the host material on the B-site up to 20%. Isothermal expansion behavior from air to Ar at 900°C was used as the selection criteria for further characterization.
D. Bayraktar
:
T. Graule:
P. Holtappels (*)Empa, Swiss Federal Laboratories for Materials Testing and Research, Laboratory for High Performance Ceramics, Ueberlandstr. 129,
CH-8600 Dübendorf, Switzerland e-mail: [email protected] S. Diethelm
HT Ceramix SA, Av. Des Sports 26,
CH-1400 Yverdon-les-Bains, Switzerland J. Van herle
Ecole Polytechnique Fédérale de Lausanne (EPFL), Laboratory for Industrial Energy Systems (LENI), STI, CH-1015 Lausanne, Switzerland
2 Experimental procedure
Powders of La0:5Sr0:5Fe1 xBxO3 δ (x=0, 0.1, 0.2 and B: Al, Cr, Zr, Ga, Ti, Sn, Ta, In, V, and Mg) were prepared by solid state reaction of the reagents La(OH)3, SrCO3, Fe2O3,
Al2O3, Cr2O3, ZrO2, Ga2O3, TiO2, SnO2, Ta2O5, In2O3,
V2O5, and MgO. Stoichiometric amounts of reagents were
mixed by ball-milling in isopropyl alcohol for 24 h and dried while stirring. Powders were calcined at 1250°C for 4 h or at 1350°C for 4 h if secondary phases were detected. The phase-purity of the calcined powders was examined by XRD (X’pert PRO PW3040, PANalytic). The programs CMPR [10] and UnitCell [11] were used to fit the peaks and to refine the structure, respectively. The powders were subsequently ball-milled in order to obtain a particle size in the range of few microns. Uniaxial pressing was used (70 MPa) to produce bars (∼3×4×45 mm) and discs (∼Ø25 mm) from those compositions, which were consid-ered to be of high phase-purity. Pressed bars were sintconsid-ered in air in the temperature range of 1430–1530°C for 4–20 h to achieve dense samples (generally >95% of theoretical density). The densities of the samples were measured by Archimedes method and crosschecked with SEM (Vega© Tescan).
The expansion behaviors of the samples as a function of temperature in air and Ar atmospheres were studied by a dilatometer (802 S, Baehr Thermoanalyse GmbH, Germany). Rectangular dilatometry bars were prepared by polishing the both ends of the sintered bars to a final length of 35 mm. A sapphire bar with the same length was used as a reference and spring-loaded quartz tubes were used to hold the samples in a quartz furnace tube. The samples were measured in air with a heating rate of 5 K/min up to 900°C and kept at this temperature until the equilibrium expansion was reached. Afterwards, the atmosphere was
changed to Ar to determine the isothermal expansion at these conditions.
The oxygen losses of the samples were determined by thermo gravimetry (TGA) (Netzsch STA 409, Netzsch-Geraetebau GmbH, Germany) in air and Ar. The difference in weight was related to the change in non-stoichiometry (δ) of the compositions.
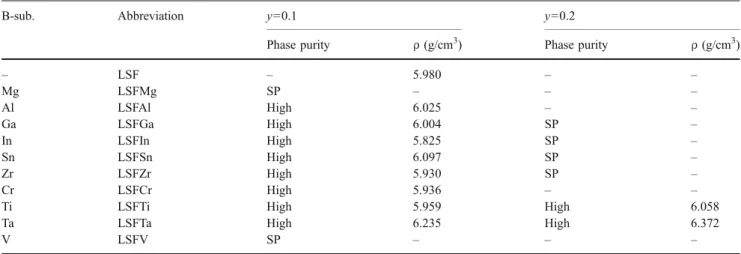
The total conductivities of the samples were investigated as a function of temperature by 4-point DC technique using a Milli-Ohmmeter RESISTOMAT 2318 (Burster Praezi-sionmesstechnik GmbH & Co KG, Germany). The tests were conducted on bars with dimensions of about 3×4× 25 mm, which were painted on both ends with Pt-paste (CL11–5100, W. C. Heraeus GmbH & Co. KG, Germany) and contacted by attaching Pt-wires around the bars, approximately 15 mm away from each other. The speci-mens were heated up to 900°C by 5 K/min with dwell times approximately every 100 K to obtain the equilibrium Table 1 B-site substituting cations, their abbreviations, XRD results (“high” indicates there is no considerable second phase and “SP” meaning second phase is present), and the Archimedes densities of the sintered bars.
B-sub. Abbreviation y=0.1 y=0.2
Phase purity ρ (g/cm3) Phase purity ρ (g/cm3)
– LSF – 5.980 – – Mg LSFMg SP – – – Al LSFAl High 6.025 – – Ga LSFGa High 6.004 SP – In LSFIn High 5.825 SP – Sn LSFSn High 6.097 SP – Zr LSFZr High 5.930 SP – Cr LSFCr High 5.936 – –
Ti LSFTi High 5.959 High 6.058
Ta LSFTa High 6.235 High 6.372
V LSFV SP – – –
conductivity values. The pellets for electrochemical and permeation measurements were prepared by polishing the surfaces of the pellets down to 2500 grit SiC paper. Finally, the oxygen permeation characterization was performed on disc-shaped samples with a diameter of 25 mm, clamped between two alumina tubes with gold-rings as sealings. Air (50 ml/min) was flown on one side and argon (100 ml/min) on the other. The amount of oxygen that has permeated through the membrane is determined by measuring the outlet argon flow with a bubble-meter and analyzing the oxygen content with a gas chromatograph (Varian) equipped with a molecular sieve 5 Å capillary column. The membrane was initially heated under an air/argon gradient up to 1050°C to soften the gold and tighten the sealing. The temperature was then decreased to the measurement temperature. The permeation values were taken at each temperature after equilibrium was reached and the leakages in the setup were corrected for based on the nitrogen counts.
Throughout this paper the compositions are abbreviated as shown in Table1. The percentage of B-site substitution is indicated at the end of the abbreviations by 1 or 2 meaning 10 and 20% respectively (e.g. LSFTi1 is the base material La0:5Sr0:5FeO3 δ (LSF) with 10% Ti on the B-site).
3 Results and discussion 3.1 B-site substitution screening 3.1.1 XRD
XRD analysis showed that small amounts of a Ruddlesden-Popper phase were present in most of the compositions. However, the amount of the second phase was less than a few percent for several compositions. Those compositions with considerable amounts of second-phase (>5%) are denoted with SP in Table1and were not considered further for sample production. The remaining compositions were pressed into bars after sintering conditions were optimized. LSFAl1 composition was found to be very brittle after sintering and was not characterized further. All samples were dense enough to be considered gas tight.
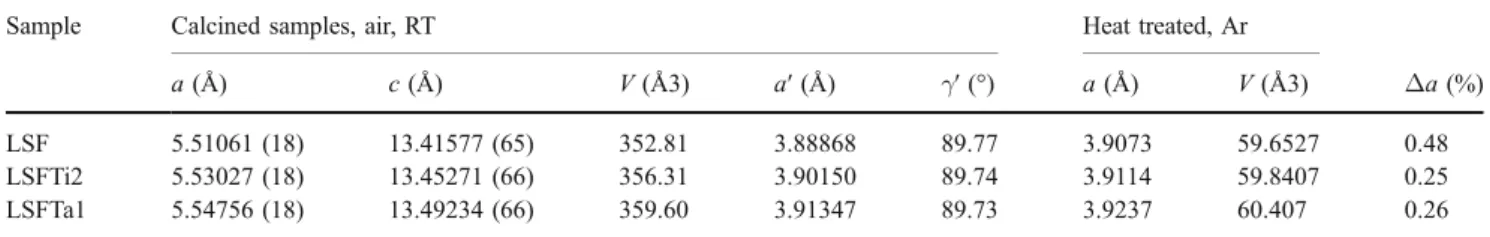
Table 2 Unit cell parameters of calcined and heat treated (in Ar at 850°C) LSF, LSFTi2, and LSFTa1.
Sample Calcined samples, air, RT Heat treated, Ar
a (Å) c (Å) V (Å3) a′ (Å) γ′ (°) a (Å) V (Å3) Δa (%)
LSF 5.51061 (18) 13.41577 (65) 352.81 3.88868 89.77 3.9073 59.6527 0.48
LSFTi2 5.53027 (18) 13.45271 (66) 356.31 3.90150 89.74 3.9114 59.8407 0.25
LSFTa1 5.54756 (18) 13.49234 (66) 359.60 3.91347 89.73 3.9237 60.407 0.26
Fig. 2 X-ray diffractograms of LSF and LSFTa1 bars kept in 4% H2–
Ar mixture at 900°C over a week
Fig. 3 (a) Total expansion in air and Ar and (b) isothermal expansion of B-site substituted LSF materials at 900°C
XRD was used to determine the structure of the selected compositions (as a result of expansion behavior as will be explained in the next chapter). The X-ray diffractograms of LSF, LSFTi2, and LSFTa1 are shown in Fig. 1. The compositions were considered of high phase-purity. All three compositions were found to have hexagonal structures with the space group R-3c. The calculated unit cell parameters are shown in Table2for the calcined powders. In the JCPDS XRD database, La0:5Sr0:5FeO3 δ material is
reported as rhombohedral (R-3c) with a=5.5111 Å,
c=13.4158 Å and V=352.87 Å3
(01-082-1962), which is very close to the values refined for LSF in this work. As can be seen from the table, the unit cell is expanding (XRD pattern is shifting to lower 2θ-values) with the addition of Ti and Ta due to larger ionic sizes of Ti4+ and Ta5+ compared to Fe4+ion.
In order to see the effect of reducing atmospheres on the structure, small amounts of calcined powders were kept in Ar atmosphere at 850°C for 3 days and cooled down to RT in Ar. Afterwards, all the compositions were refined as cubic with the unit cell parameters as shown in Table 2. LSF composition is known to be cubic at high temperatures [12]. For comparison reasons, the pseudo-cubic unit cell parameters (a′ and γ′) were calculated for calcined powders for half of the unit cell (i.e. c/2). The change in the unit cell length (in %) is also shown in Table 2. There’s 0.48% increase in case of LSF due to oxygen vacancy formation, while it is 0.25% for LSFTi2 and LSFTa1.
In order to check the chemical stability of the materials in reduced atmosphere, solid bars of LSF and LSFTa1 were kept in 4% H2–Ar mixture at 900°C for over a week. The
samples were crushed and the phase composition was checked by XRD. The resulting diffractograms are shown in Fig. 2. LSF was found to have a tetragonal structure (I4/mmm) similar to SrLaFeO4 (JCPDS 01-071-1744),
which is not surprising considering the amount of Fe found in the metal state (indicated with (*) in Fig.2). However, LSFTa1 material was found to be much more stable
maintaining the perovskite structure with small amount of second phase formed.
3.2 Isothermal expansion in Ar as selection criterion The thermal expansion of the sintered bars was measured up to 900°C in air followed by the change of atmosphere from air to Ar for the isothermal expansion behavior of the materials. The results are shown in Fig.3. Figure3(a) shows the thermal expansion at 900°C in air and in Ar in percentage where l0 is the initial length at RT in air.
Figure 3(b) shows the isothermal expansion at the same temperature as a result of the change of atmosphere from air to Ar. In this case,l0is taken as the equilibrium length
at 900°C in air. As is seen in the figure, the thermal and isothermal expansion is suppressed in case of each substitution compared to LSF.
Replacing the multi-valence Fe-ion reduces the concen-tration of the Fe4+cation, which (at high temperatures and reducing atmospheres) is reduced accompanied with oxy-gen vacancy formation. It is expected that the effect would be more pronounced if the substituting ion has higher valence state (e.g. 4+ or 5+). This is in agreement with the results obtained. The isothermal expansion (Fig. 3(b)) is reduced to half of its value compared to LSF in case of several additives (Cr, Ti, Zr, In), while it is considerably lower for LSFTa samples. LSFIn1 sample showed compa-rable isothermal expansion to other 3+ or 4+ additions; however, the total expansion was measured as high as the base material itself. As a result of the B-site substitution screening experiments, LSFTi2 and LSFTa1 samples were selected for further characterization since they show the lowest total expansion under Ar (after LSFTa2) and similar isothermal expansion in case of LSFTi2. LSFTa2 was not considered because of the possibility of severe reduction in electrical conductivity and oxygen permeation.
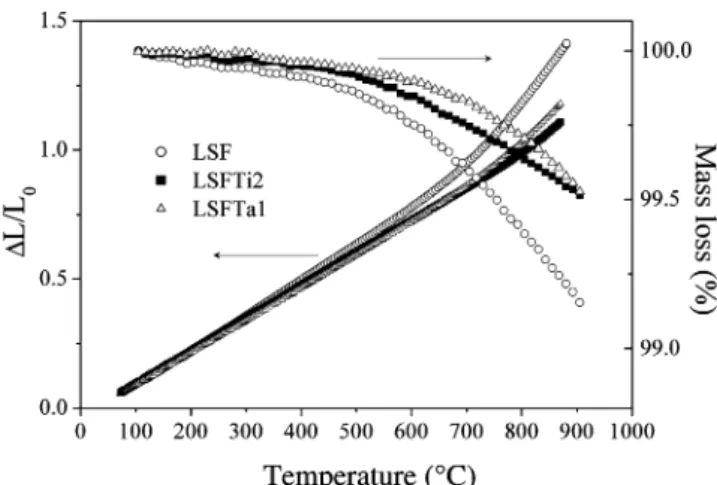
Thermal expansion and thermal gravimetric curves of LSF, LSFTi2, and LSFTa1 measured in air as a function of T are shown in Fig. 4. Average coefficients of thermal expansion (CTE) calculated from these curves are given in Table3. The curves deviate from linearity around 600°C for Fig. 4 Dilatometry and TGA curves for LSF, LSFTi2, and LSFTa1
Table 3 Coefficient of thermal expansion (CTE) and activation energy (Ea) for oxygen permeation.
Sample T-range CTE,α×10−6 T-range Ea
(°C) (K−1) (°C) (kJ/mol) LSF 120–680 14.0±0.02 750–850 209 (7) 700–880 26.0±0.5 875–1000 101 (6) LSFTi2 100–750 12.6±0.05 750–850 79 (5) 875–1000 111 (12) LSFTa1 100–690 12.7±0.01 750–850 121 (16) 710–890 18.4±0.16 900–1000 93 (11)
LSF and at higher temperatures for LSFTa1 and especially for LSFTi2. The higher CTEs after these temperatures are attributed to chemically induced expansion in addition to the thermal expansion, which is a typical feature [7,13] for LSF type perovskites. The CTEs are lowered with Ti and Ta substitution while the linear expansion range is shifted to higher temperatures. According to thermal gravimetric analysis, the mass loss related to oxygen vacancy formation becomes considerable after 400°C. This temperature is lower than what is observed on dilatometry curves. However, considering the dilatometry samples are in solid form while the TGA is conducted on powders, this difference is attributed to a slower oxygen exchange rate for the dense samples.
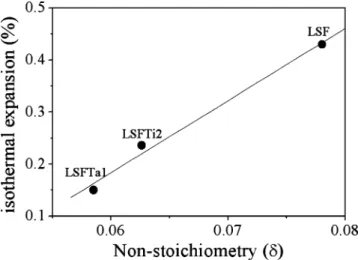
The non-stoichiometry (δ) of the materials was calculat-ed from the TGA-data assuming that they are stoichiometric at room temperature. The non-stoichiometry vs. the isothermal expansion of the materials induced during atmosphere change from air to Ar at 900°C is shown in Fig. 5, which shows a linear relation. A similar linear relation was shown for LaCrO3-based materials [5] over a
broad range of pO2. In case of LSF materials, the situation
is more complex since the structure is not thermodynam-ically stable at highly reducing atmospheres. However, in Ar–atmosphere our results (Table 2) indicate that LSF, LSFTi2, and LSFTa1 are stable.
3.3 Total conductivity and oxygen permeation of selected compositions
A large hysteresis was seen on conductivity measurements conducted in air, especially for LSF. The conductivity measured during cooling was much lower than the values obtained during heating. This is thought to be a result of lower oxygen uptake rate during cooling compared to oxygen loss during heating. The hysteresis can be avoided
by allowing necessary equilibration times, which may be extremely long at intermediate temperatures. The conduc-tivity data shown below is recorded during heating when equilibration was reached at corresponding temperatures.
The total conductivity values are shown in Fig. 6 as logσT vs. 1000/T plots. The conductivity in these kinds of materials is considered to be electronic (p-type) since the ionic conduction is very low compared to the total conductivity [6]. The materials show semiconductor behav-ior up to a certain temperature after which the conductivity starts to decrease. This decrease can be related to the decrease of the electronic carrier concentration as a result of the oxygen vacancy formation due to reduction of B-site cation [14]. As a consequence, the thermally activated electronic transport, which occurs via Fe4+–O–Fe3+bonds, is partially blocked.
La0:5Sr0:5FeO3 δ material was reported to be the optimum composition in La1−xSrxFeO3 series considering
electronic conductivity since Fe4+/Fe3+ ratio is close to 1
Fig. 5 Nonstoichiometry (δ) and isothermal expansion at 900°C from air to Ar
Fig. 6 Arrhenius plots of total conductivity of LSF, LSFTi2, and LSFTa1
Fig. 7 Arrhenius plots of normalized oxygen permeation flux of LSF, LSFTi2, and LSFTa1
[15]. Substitution of Ti and Ta lowers this ratio (in addition to the lowered Fe concentration) resulting in reduced electronic conductivity. The activation energy increases with Ti and Ta-substitutions and the total conductivity of LSF decreases to one fourth with 20% Ti or 10% Ta on the B-site. The activation energy (Ea) changes as a function of
temperature. At lower temperature range it is 0.044, 0.053, and 0.107 eV for LSF, LSFTi2, and LSFTa1, respectively, which are in the same range with similar perovskite (La, Sr) FeO3-based materials [14].
Finally, the oxygen permeation of LSF, LSFTi2, and LSFTa1 was measured under air/Ar-gradient. The perme-ation data of LSF and LSFTi2 was published previously by the authors [16]. Figure7compares the Arrhenius plots for LSFTa1 with these earlier results. Assuming that the oxygen transport is governed by the bulk diffusion the data were normalized for direct comparison to a thickness of 1 mm by multiplying the oxygen flux by the thickness of the membrane disc in millimeters. The absolute value for the oxygen permeation is decreased from 0.18μmol/cm2s for LSF to 0.05μmol/cm2s with the substitution of 20% Ti and to 0.07 μmol/cm2s with 10% Ta at 900°C. The activation energies were calculated in two temperature ranges as shown in Table3. All samples showed a change in the activation energy,Ea, above 850°C. The doubling of
theEaat lower temperatures for LSF may be attributed to
the change of the oxygen transport governing step from bulk to surface exchange. However, the discontinuity observed for LSFTi2 and LSFTa1 is subject to discussion since the equilibrium around the discontinuity temperature is extremely slow. This was attributed to an order–disorder transition of oxygen vacancies forming a brownmillerite-type structure with immobile oxygen vacancies, therefore reducing the oxygen flux.
4 Conclusions
Mixed ionic-electronic conducting La0:5Sr0:5Fe1 xBxO3 δ (B: Al, Cr, Zr, Ga, Ti, Sn, Ta, V, Mg, and In withx=0, 0.1, 0.2) perovskite materials were produced via solid-state synthesis. The isothermal expansion behavior was studied
in air and Ar to study the effect of B-site substitution on the expansion behavior of these materials. Ti and Ta were found to be the most effective substitutions in suppressing the isothermal expansion. The isothermal expansion at 900°C from air to Ar was reduced by 50% by substitution of 20% Ti or 10% Ta. However, the total conductivity of La0:5Sr0:5FeO3 δ was decreased by more than an order of magnitude at low temperatures while the oxygen flux in air/Ar gradient at 900°C was reduced down to the third of the flux of LSF by addition of Ta and Ti.
Acknowledgements This work was supported by Swiss National Science Foundation (Project 200021-100674/1).
References
1. H.J.M. Bouwmeester, Catal. Today 82(1–4), 141 (2003) 2. U. Balachandran, B.H. Ma, J. Solid State Electrochem. 10(8), 617
(2006)
3. B.C.H. Steele, Curr. Opin. Solid State Mater. Sci. 1(5), 684 (1996) 4. P.V. Hendriksen, P.H. Larsen, M. Mogensen, F.W. Poulsen, K.
Wiik, Catal. Today 56(1–3), 283 (2000)
5. A. Atkinson, T. Ramos, Solid State Ion. 129(1–4), 259 (2000) 6. D.P. Fagg, V.V. Kharton, J.R. Frade, A.A.L. Ferreira, Solid State
Ion. 156(1–2), 45 (2003)
7. E.V. Tsipis, M.V. Patrakeev, V. Kharton, A.A. Yaremchenko, G.C. Mather, A.L. Shaula, I.A. Leonidov, V.L. Kozhevnikov, J.R. Frade, Solid State Sci. 7(4), 355 (2005)
8. V.V. Kharton, A.L. Shaulo, A.P. Viskup, M. Avdeev, A.A. Yaremchenko, M.V. Patrakeev, A.I. Kurbakov, E.N. Naumovich, F.M.B. Marques, Solid State Ion. 150(3–4), 229 (2002)
9. M.V. Patrakeev, J.A. Bahteeva, E.B. Mitberg, I.A. Leonidov, V.L. Kozhevnikov, K.R. Poeppelmeier, J. Solid State Chem. 172(1), 219 (2003)
10. B.H. Toby, J. Appl. Crystallogr. 38, 1040 (2005)
11. T.J.B. Holland, S.A.T. Redfern, Mineral Mag. 61, 65 (1997) 12. A. Fossdal, M. Menon, I. Waernhus, K. Wiik, M.A. Einarsrud, T.
Grande, J. Am. Ceram. Soc. 87(10), 1952 (2004)
13. V.V. Kharton, A.A. Yaremchenko, M.V. Patrakeev, E.N. Naumovich, F.M.B. Marques, J. Eur. Ceram. Soc. 23(9), 1417 (2003)
14. J.W. Stevenson, T.R. Armstrong, R.D. Carneim, L.R. Pederson, W.J. Weber, J. Electrochem. Soc. 143(9), 2722 (1996)
15. E.V. Bongio, H. Black, F.C. Raszewski, D. Edwards, C.J. McConville, V.R.W. Amarakoon, J. Electroceramics 14(3), 193 (2005)
16. D. Bayraktar, S. Diethelm, P. Holtappels, T. Graule, J. Van herle, J. Solid State Electrochem. 10(8), 589 (2006)