CASE REPORT
Analysis of the Implementation of Total Productive Maintenance,
Total Quality Management, and Just-In-Time in Pharmaceutical
Manufacturing
Thomas Friedli&Matthias Goetzfried&Prabir Basu
Published online: 27 October 2010
# Springer Science+Business Media, LLC 2010
Abstract In the pharmaceutical industry, systems for improving operational effectiveness and efficiency are becoming more and more popular. In this paper, develop-ments in the industry’s improvedevelop-ments in operational effectiveness and efficiency have been analyzed. A holistic model is presented which builds the basis for the presented study results. The study includes data gathered from pharmaceutical production sites in surveys in 2004 and 2009. The analysis is divided according to the four sub-systems: Total Productive Maintenance, Total Quality Management, Just-in-Time, and the Management System. For each sub-system, key performance indicators and associated elements (practices and instruments) from 2004 to 2009 are investigated. The data indicates that the industry did make continuous steps towards “Excellence in Operations” between 2004 and 2009. Pharmaceutical companies took control over their former low asset utilization and managed to improve the efficiency of their quality systems; however, they are still far away from having any kind of “continuous flow”, smooth production scheduling or make-to-order manufacturing. It can be said that most of the companies are still working on the effectiveness side rather than focusing on the efficiency side.
Keywords Pharmaceutical manufacturing . Operational excellence . Total quality management . Just-in-time . Effective management system . Total productive maintenance . Lean production
Background
The pharmaceutical industry is facing severe quality problems. The Food and Drug Administration (FDA) is reporting an increase by 309% from 426 drug recalls in 2008 to 1,742 drug recalls in 2009 [1]. Some of the recalls may be triggered by an increase of FDA inspections of production facilities. But, the large majority of the issues leading to the recalls of drugs on the global market can be traced back to shortcomings in supply and manufacturing such as poor quality of raw materials, incorrect packaging, and contamination of products. The incident with heparin that resulted in 484 deaths in 2007 and 2008, was the outcome of deviations from “current good manufacturing practices” (cGMP) in the production and quality control of the drug’s active pharmaceutical ingredient, manufactured by Chinese suppliers [2, 3]. Additionally, examples of issues with production sites of established pharmaceutical companies in the USA and Western Europe lead to the conclusion that poor quality is not only an issue for low-cost production countries. The cGMP and contamination issues with the Genzyme facility in Allston Landing, one of the largest cell-culture manufacturing plants in June 2009 resulted in an expenditure of $184.2 million for decontamination and fine and an estimated loss in revenue of $1 billion [4].
Due to the recent incidents, pharmaceutical companies either with in-house manufacturing or with external contract manufacturing are concerned with the capability T. Friedli
:
M. Goetzfried (*)Institute of Technology Management, University of St. Gallen, Dufourstr. 40a,
9000 St. Gallen, Switzerland e-mail: [email protected] P. Basu
The National Institute of Pharmaceutical Technology and Education (NIPTE),
1281 Win Hentschel Blvd,
West Lafayette, IN 47906-4182, USA e-mail: [email protected]
P. Basu (*)
of their processes to manufacture the drug according to specifications while keeping manufacturing costs within reasonable limits [5]. Although only few senior executives see manufacturing as a competitive advantage, it is understood that lacking high quality management and capability of pharmaceutical manufacturing can lead to disasters. Therefore, companies are forced to implement approaches such as lean manufacturing which has proven to be capable of improving effectiveness and efficiency of production in a number of industries [6]. The term “Operational Excellence” (OPEX) as a target state for lean manufacturing is used by the pharmaceutical industry to describe their efforts in improving effectiveness and efficiency in operations [7].
Objectives
The main objective of this study was to assess and analyze the implementation levels of “Operational Excellence” across the pharmaceutical industry. For this analysis, a research model is used showing an integrated“Operational Excellence” model. It includes the major principles of Total Productive Maintenance, Total Quality Management, and Just-in-Time as well as the “social principle” of the Effective Management System. The information from pharmaceutical companies gathered in surveys in 2004 and 2009 was used in the analysis. The main objective can be divided into the following sub-objectives:
– Gain a better understanding of the actual implementa-tion of Total Productive Maintenance, Total Quality Management, Just-in-Time, and Effective Management System in the industry.
– Study the link between the implementation of the named systems and key performance indicators (KPIs).
– Explore the trend of KPIs and implementation levels between 2004 and 2009 in the industry.
Methodology
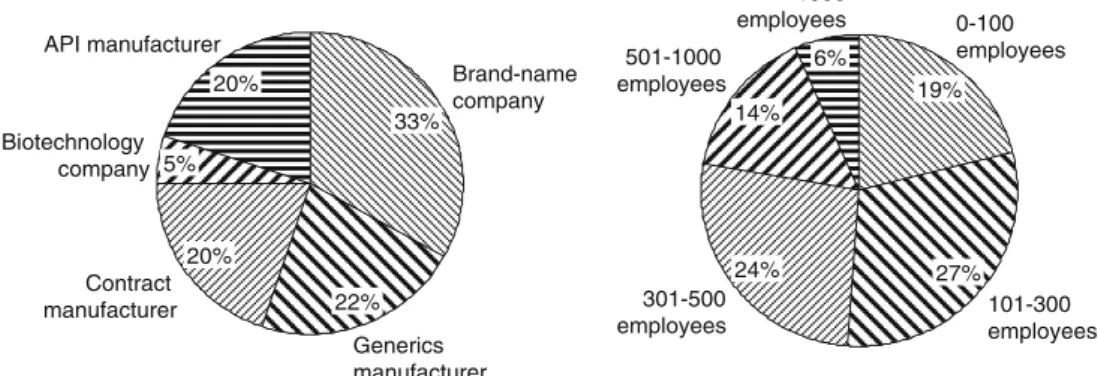
The data used in this work were extracted from surveys conducted in 2004 to 2009 by the University of St. Gallen, Switzerland. The participating companies were brand-name, generics, and contract manufacturer companies both from the pharmaceutical and the biologic businesses. The research sample includes companies ranging from small- to medium-sized to large corporations (Fig. 1). The survey was completed by the representatives of the companies’ production sites; therefore, the data received include figures for the entire production site.
Research Model
The survey’s questionnaire is derived from a model which was developed in 2004 [7]. The original non-industry-specific model [8] has been detailed in close cooperation with pharmaceutical companies to meet the requirements of pharmaceutical production. The research model is shown in Fig. 2.
In the model, a distinction is made between four sub-systems in OPEX: Total Productive Maintenance (TPM), Total Quality Management (TQM), Just-in-Time (JIT), and the Effective Management System (EMS). Each sub-system represents in itself an important part which contributes to the overall success. In fact, the included elements reinforce each other. According to this model, manufacturing is viewed as a system in which single elements or interven-tions have a direct and indirect impact on other sub-systems and elements.
TPM represents a system for the effective usage of process technology. TPM is designed to efficiently manage fixed assets such as machines, equipment, and property throughout their life cycle [9] and includes the following elements: – Preventive maintenance
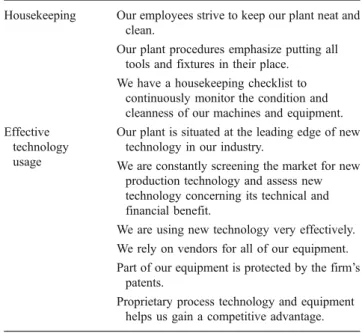
– Housekeeping
– Effective technology usage
It does not only focus on the technical aspects such as the reliability of existing equipment and a careful selection of new technologies, but also the engagement of all employees in the production environment, from manage-ment level to shop-floor employees in maintenance-related activities [10]. In OPEX programs, TPM is the basis for stable running machines and therefore forms the basis for further in-depth improvements in efficiency [7].
TQM describes a quality culture in companies that addresses all direct and indirect employees, rather than solely employees in Quality Control (QC) and Quality Assurance (QA) departments [11]. Consequently, TQM does not only affect manufacturing but several additional functions, e.g., research and development (R&D) and supplier management. It means people management, com-mitment from top to down, and strive for continuous improvement across the entire organization. Sustainably improving the quality of products, processes, and overall company quality is the objective of TQM. The following elements are part of TQM:
– Process management
– Cross-functional product development – Customer involvement
– Supplier quality management
JIT aims at continuously reducing all types of waste, especially by reducing inventory and unnecessary delays in
production flow [11,12]. JIT manufacturing has become a crucial element for most companies in the last years to increase flexibility without building up huge inventories. The elements of JIT in the OPEX model are:
– Set-up time reduction – Planning adherence – Pull system
– Layout optimization
The EMS is an essential requirement for achieving OPEX. Plant managers should provide the right framework for OPEX. Various actions by managers are contributing to the efficiency of operations [8]. The ultimate task of plant management is leveraging employee potential by clear direction setting, dedicated management commitment, and functional integration. Four elements of EMS were inves-tigated:
– Direction setting
– Management commitment and company culture – Employee involvement and continuous improvement – Functional integration and qualification
Data Analysis
For each of the elements, several statements were listed in the survey to be completed on a five-point Likert scale [13,
14] by the participating pharmaceutical sites. For assessing the performance, the definitions for the key performance indicators were given in the survey (seeAppendix).
To compare the data in the four sub-systems across the pharmaceutical companies in this survey, the median scores of the extracted data were calculated for the implementation levels and the key performance indicators. These median scores were used for the analysis.
Standardized replenishment Standardized equipment High continuous improvement rates Low absenteeism and fluctuation Flexible workforce Self-directed teams
Effective Management System Direction setting
Management commitment and company culture Employee involvement & continuous improvement
Functional integration & qualification
Operational
Performance
T I J M Q T M P T Preventive maintenance Effective technology usage Process management Customer integration Cross-funct. product development Supplier quality management Set-up time reductions Pull system Planning adherence Layout optimization House-keeping Stable running machines Stable processes Low inventory1
2
3
Standardized processesFig. 2 Integrated operational excellence model
20% Generics manufacturer 5% Contract manufacturer 20% Biotechnology company 22% API manufacturer 33% Brand-name company 6% >1000 employees 14% 501-1000 employees 24% 301-500 employees 27% 101-300 employees 19% 0-100 employees Fig. 1 Company type and size
Assumptions and Limitations
The authors are dependent on the data reported by the representatives of the pharmaceutical sites. It is possible that representatives answered more positively in order to achieve better results in the survey. As the survey was completed by representatives on management level, it could be the case that answers by them do not reflect the overall opinion of the employees of different hierarchical levels at the production site. For example, the elements of the sub-system EMS could be assessed more positively because it is completed by a manager as this does not represent the overall opinion of the workers.
The analysis includes pharmaceutical and biotechnological production sites. Although both types of production processes include different sub-processes, e.g., biotechnological pro-duction includes purification; it is assumed that the core procedure to produce a drug is comparable: (1) API production, (2) Formulation, and (3) Packaging. The analysis is limited to this“process level” and does not consider the differences between single process steps in pharmaceutical and biotechnological production.
Key Observations
Total Productive Maintenance
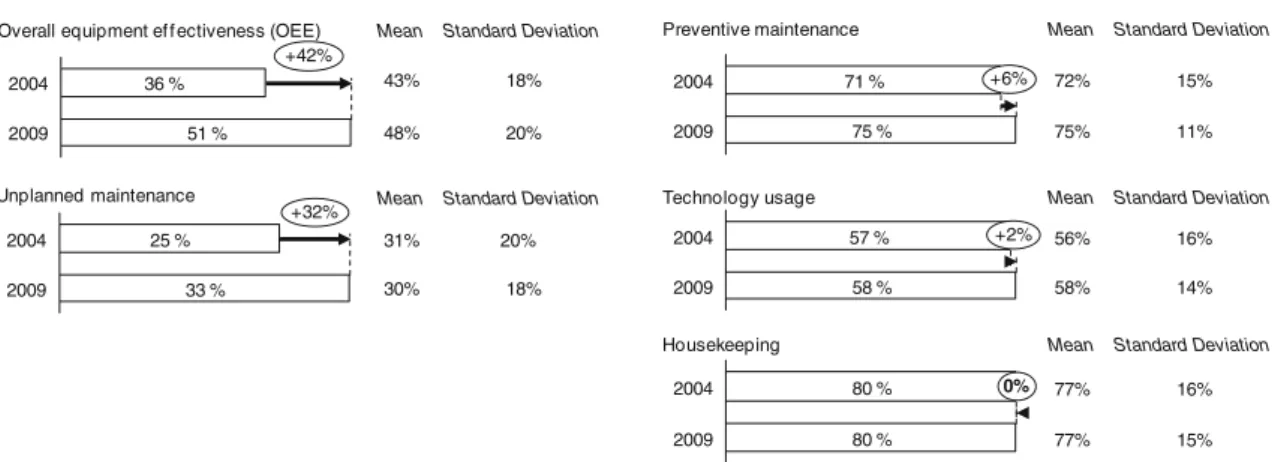
The trend of the KPIs “Overall equipment effectiveness” and“Unplanned maintenance” as well as of the implemen-tation of techniques of preventive maintenance, technology usage, and housekeeping is analyzed. The figures for 2004 and 2009 are illustrated in Fig.3.
An increase in overall equipment effectiveness (OEE) of 15% from 36% in 2004 to 51% in 2009 could be observed. However, even then, an OEE of 51% (median) measured in 2009 is not really outstanding when compared with other
process industries and their packaging processes. Various cross-industry studies show an OEE of 60% for an average production site in the food and beverages sector [15, 16]. This means that pharmaceutical companies still have potential with regard to higher utilization in scheduled time, prevention of downtimes, and avoidance of quality losses.
In fact, the non-availability of equipment and machines as a result of direct stoppages and breakdowns seems to be a problem for the industry. In 2004, the proportion of unplanned maintenance work as a percent-age of the overall time spent for maintenance work amounted to 25%. Five years later, the figure for unplanned maintenance increased by 8% to 33%. It can be argued that this may be one of the reasons why most pharmaceutical companies struggle with the establish-ment of stable running manufacturing processes.
Companies were able to slightly increase their level of “Preventive maintenance” from 2004 (industry median of 71%) to 2009 (75%). In practice, companies have installed formal programs on operational levels for maintaining their equipment and machines. Nonetheless, pharmaceutical companies still reveal shortcomings in TPM which they have not addressed during these years. Practices especially pointing to autonomous maintenance by empowering shop-floor employees are not very common. Maintenance tasks are still performed mainly by maintenance specialists rather than by machine operators. In summary, maintenance systems and processes in the pharmaceutical companies are still reactive rather than proactive such as planning maintenance programs based on failure analyses.
The 2004 analysis revealed that the pharmaceutical industry is very restrictive when it comes to the implemen-tation of new production technologies. This might be caused by the fact that every change in the production process, including the usage of new technologies, needed to be approved by the regulatory authorities. The element “Technology Usage” points to the screening of the market
2009 75 % 2004 71 % +6% Implementation levels Preventive maintenance 2009 51 % 2004 36 % +42% Key performance indicators
Overall equipment ef f ectiveness (OEE)
2009 33 % 2004 25 % +32% Unplanned maintenance 2009 58 % 2004 57 % +2% Technology usage 2009 80 % 2004 80 % 0% Housekeeping
Mean Standard Deviation
43% 18%
48% 20%
Mean Standard Deviation
31% 20%
30% 18%
Mean Standard Deviation
72% 15%
75% 11%
Mean Standard Deviation
56% 16%
58% 14%
Mean Standard Deviation
77% 16%
77% 15%
for new production technologies and the assessment of technical and financial benefit. Moreover, it includes the effective use of new technologies. With 58% in 2009 compared with 57% in 2004, this element has not undergone any essential change. The authors believe that this can only change with extensive implementation of Quality by Design where pharmaceutical companies will be pre-approved by the regulatory agencies to implement process changes within a specified range of critical process parameters also known as the“Design Space”.
A high score of 80% in 2004 could be re-observed in 2009 for the element “Housekeeping”. Pharmaceutical companies seem to do this well as good“Housekeeping” is seen as the first step getting regulatory approvals. The vast majority of pharmaceutical companies have beholden their employees to keep their plant “neat and clean” and provide tools such as housekeeping checklists.
Total Quality Management
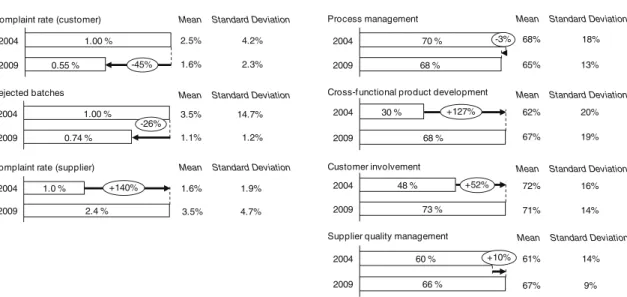
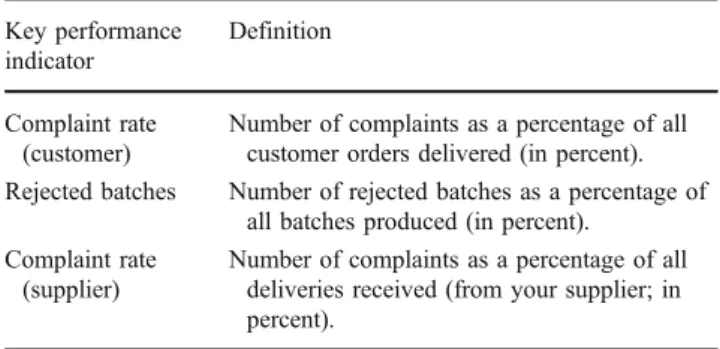
A comparison between the performance indicators, assess-ing upstream quality (complaint rate supplier), internal process quality (rejected batches) and for downstream quality (complaint rate customer), in 2004 and 2009 is done. Furthermore, the implementation levels of factors such as “Process management”, “Cross-functional product development”, “Customer involvement”, and “Supplier quality management” are investigated (Fig. 4).
Only six out of 1,000 customer orders delivered resulted in a complaint by the customer in 2009, compared with ten out of 1,000 in 2004. Rejected batches as a percentage of all batches produced, a core measure of the process quality, decreased from 1.00% in 2004 to 0.74% in 2009. More
transparent scale-up processes and teamwork of R&D, manufacturing, and QC/QA departments mainly caused this result.
Despite the fact that companies tried to build up stronger relationships with their suppliers, they were not able to reduce the upstream complaint rate. Supplier complaint rate increased from 1.0% in 2004 to 2.4% in 2009. One explanation is the increase of requirements concerning the quality of supplies on the manufacturers’ side. Another, more alarming interpretation, is the decrease in supplier quality due to increased outsourcing and increase in complexity of supply chains. It would be worthwhile to keep a close eye on this factor as outsourcing seems to be on rise and the complexities of managing quality of global supply chains is putting increased pressure on pharmaceu-tical companies’ quality departments.
The implementation element “Process Management” includes the documentation, measurement, and improve-ment of processes. Comparing the results from 2004 to 2009, a slight decrease from 70% to 68% in “Process Management” implementation can be seen among the participating companies. Documentation and standardiza-tion based on cGMP in pharmaceutical manufacturing is established since decades and, consequently, very high scores regarding these practices are found. Of greater concern is the fact that measurement methods using statistical process control or process analytical technology and assessment using root-cause analyses (e.g., DMAIC cycle) are implemented only in some very advanced brand-name companies’ manufacturing sites.
A remarkable development from 2004 to 2009 could be observed in the implementation of “Cross-functional prod-uct development”. Its value increased from 30% to 68%
Implementation levels Key performance indicators
Complaint rate (customer)
Rejected batches
Complaint rate (supplier) 2009 0.55 % 2004 1.00 % -45% 2009 0.74 % 2004 1.00 % -26% 2.4 % 2004 2009 1.0 % +140%
Cross-f unctional product development
Customer involvement
Supplier quality management Process management 30 % 2004 2009 68 % +127% 73 % 2004 2009 48 % +52% 66 % 2004 2009 60 % +10% 2004 68 % 2009 70 % -3%
Mean Standard Deviation
2.5% 4.2%
1.6% 2.3%
Mean Standard Deviation
3.5% 14.7%
1.1% 1.2%
Mean Standard Deviation
68% 18%
65% 13%
Mean Standard Deviation
62% 20%
67% 19%
Mean Standard Deviation
72% 16%
71% 14%
Mean Standard Deviation
1.6% 1.9%
3.5% 4.7%
Mean Standard Deviation
61% 14%
67% 9%
during these 5 years. Generally,“Cross-functional product development” aims at the translation of customer require-ments (external and internal customers) into high quality products. With focus on the manufacturing environment, it means the close link between development (product and process) and manufacturing. The increase in this category shows that pharmaceutical companies are concerned with the separation of development and manufacturing and has made significant improvements. By 2009, companies established a closer collaboration between the R&D and manufacturing departments with the ultimate objective to shorten the time for scale-ups by moving from“quality by inspection” to “quality by design”. In 2009, manufacturing engineers are more involved in the development of products and necessary production processes. It could also be a reflection of headcount reduction in pharmaceutical R&D’s necessitating engineers in development and manufacturing to assume multiple roles.
Another improvement reveals the widespread under-standing that it is essential to know what customers want in order to stay competitive by providing products that meet their requirements. Pharmaceutical companies were able to increase their implementation level in the category of “Customer Involvement” from 48% in 2004 to 73% in 2009. Customers now frequently give feedback on quality and delivery performance to pharmaceutical manufacturers leading to continuous improvement. Nonetheless, there is still room for improvement regarding the assessment of customer requirements and proactive management of key customers.
Starting with a higher median value of 60% in the category “Supplier Quality Management” compared with “Customer Involvement”, an increase to 66% could be observed. The category addresses the integration of suppliers into the internal quality system to ensure high quality levels. The vast majority of the companies mark quality as their number one criterion in selecting suppliers and not solely the product price. Furthermore, validation and qualification of suppliers play critical roles for pharmaceutical manufacturers. Yet, companies hesitate to deploy joint improvement programs with suppliers to increase overall process quality.
Just-In-Time
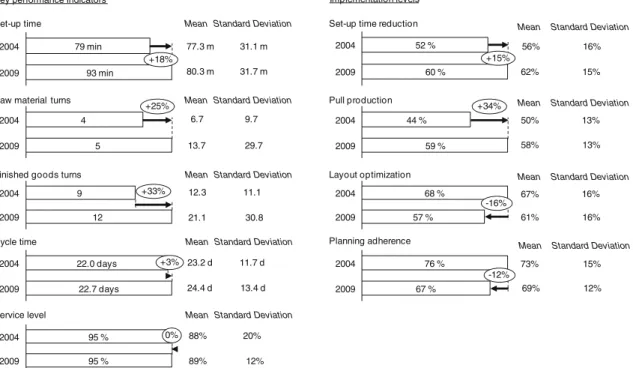
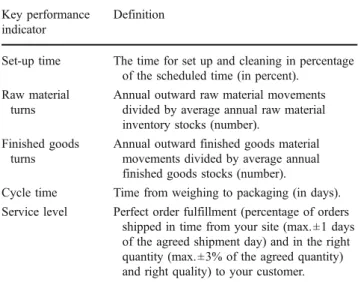
JIT performance indicators pointing to time-to-customer and working capital are compared in Fig.5. The level of JIT implementation is analyzed by observation of four critical elements: “Set-up time reduction”, “Pull produc-tion”, “Layout optimization”, and “Planning adherence” (Fig.5).
Times required for production process steps deteriorated between 2004 and 2009. Set-up times deteriorated from
79 min in 2004 to 93 min in 2009. This seems to be surprising due to the fact that pharmaceutical companies are looking for learnings in other industries, e.g., modules which can be maintained and set up without stopping the entire production process. However, as these approaches mainly focus on the packaging process, companies were not able to share such approaches across formulation and packaging leading to the industry’s shortcoming in set-up time reductions [17]. Similar to that, the trend for cycle times shows that pharmaceutical companies are struggling with process optimization and synchronization which leads to a negative impact on set up and cycle time. Time from weighting to packaging (cycle time) did increase from 22.0 days in 2004 to 22.7 days in 2009.
On the other hand, metrics concerning the management of working capital could be improved. Companies were able to increase raw material turns from four in 2004 to five in 2009. It can be argued that companies were able to link their production to suppliers with the objective of creating a “pull” instead of the traditional “push” system [18]. In addition, finished goods turns increased from nine in 2004 to 12 in 2009. After decades of building up huge inventories, companies are now concerned with having immense stocks of final products. A re-thinking towards “producing only what the customer demands” contributed to the improvement in finished goods turns. With 95% order fulfillment on time, in the right quantity and right quality, this figure stayed stable from 2004 to 2009.
With regard to practices and factors linked with“Set-up time reduction”, companies were able to increase it slightly from 52% in 2004 to 60% in 2009. Particularly, advance-ments are seen in the planning of set up and cleaning. In fact, companies managed to schedule a majority of their setups so that the regular uptime of machines and equipment is not affected. The corresponding documenta-tion and sharing of successful set up and cleaning procedures are other aspects which were improved across the pharmaceutical industry.
The low median score for the element“Pull production” of 44% in 2004 could be increased to 59% in 2009. Pharmaceutical companies built the basis for a pull system of the supply chain, e.g., with long-term relationships with suppliers. However, operational approaches such as a pull system for internal production processes (including Kanban containers and signals) and the demand-driven refill of supplies are still not very common in pharmaceutical production.
For the two elements “Layout optimization” and “Plan-ning adherence”, alarming results could be revealed. Clearly, layout optimization has been neglected because its value of 68% in 2004 decreased to 57% in 2009. While “technical” parts of the production layout are optimized, elements impacting flow and takt (takt is used to match the
pace of work to the average pace of customer demand) within production show a very low degree of implementa-tion. Processes and machines are located close together with the objective to minimize material handling and storage of parts. However, manufacturing processes are not synchronized or managed by the customer’s takt. Additionally, the core process from raw material to finished goods still involves a number of interruptions and can therefore not be described as a full continuous flow.
Another shortcoming can be seen in the category “Planning adherence”, showing a decrease from 76% (2004) to 67% (2009). As mentioned previously, pharma-ceutical companies did align the processes with suppliers but struggle with the deployment in daily operations. For instance, they know the root causes of variance in their production schedule and are trying to eliminate them. However, most companies do not share data continuously internally as well as with customers and suppliers based on a“rolling production plan” to increase planning adherence.
Effective Management System
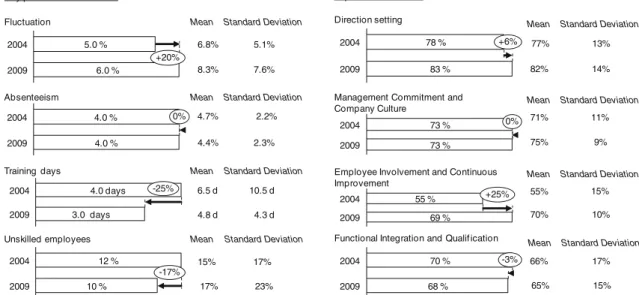
The performance indicators for EMS are pointing to the motivation and empowerment of employees working at the production site. Figure6shows that four elements and their corresponding management practices and instruments are considered:“Direction setting”, “Management commitment and company culture”, “Employee involvement and con-tinuous improvement”, and “Functional integration and qualification”.
While the total time of employees absent (e.g., sick leave) as a percentage of the total working time stayed constant for 2004 and 2009, fluctuation (employee turnover on site level) increased from 5.0% to 6.0%. The increase in fluctuation leads to a loss of knowledge at the production sites. This “brain-drain” hinders the site organization to build on existing experiences by staff and management. Regarding the qualification among staff, a decrease (12% to 10%) of the portion of “unskilled employees” as a percentage of the total employee on site level could be observed. However, companies reduced the number of training days (all kinds of training off and on the job) that were offered to its employees from 4.0 days in 2004 to 3.0 days in 2009.
In 2009, the overall objectives of the manufacturing units are closely linked to team or personal objectives of their shop-floor teams and employees. One explanation can be the clear breakdown of goals in the corporate strategy into team and personal objectives in the years between 2004 and 2009. Although the degree of satisfaction regarding communication of vision, mission, and strategy decreased, the industry was able to achieve a result in the 80% range. Companies achieved a median score of 83% in 2009 compared with 78% in 2004 for the element “Direction setting”.
The implementation of practices in the category “Management Commitment and Company Culture” stayed stable from 2004 to 2009 with a score of 73%. Companies still state an intensive involvement of plant management directly in improvement projects and indirectly by empowering
Implementation levels Key performance indicators
2009 93 min 79 min 2004 +18% Set-up time 2004 5 2009 4 +25% Raw material turns
2004
12 2009
9 +33%
Finished goods turns
2004 22.7 days 2009 22.0 days +3% Cycle time 2004 95 % 2009 95 % 0% Service level
Set-up time reduction
Pull production Layout optimization Planning adherence 2009 60 % 2004 52 % +15% 2009 59 % 2004 44 % +34% 57 % 2004 2009 68 % -16% 2009 76 % 2004 67 % -12%
Mean Standard Deviation
77.3 m 31.1 m 80.3 m 31.7 m
Mean Standard Deviation
6.7 9.7
13.7 29.7
Mean Standard Deviation
16%
62% 15%
Mean Standard Deviation
13%
58% 13%
Mean Standard Deviation
16%
61% 16%
Mean Standard Deviation
12.3 11.1
21.1 30.8
Mean Standard Deviation
15%
69% 12%
Mean Standard Deviation
23.2 d 11.7 d 24.4 d 13.4 d
Mean Standard Deviation
88% 20% 89% 12% 56% 50% 67% 73%
employees for it. The missing improvement concerning this element is mainly caused by a downward movement in communication from corporate to site level and information flow between departments and sites.
Starting at a very low level of 55% in 2004 for the element“Employee Involvement and Continuous Improve-ment”, companies were able to increase the value to 69% in 2009. In particular, support from plant management to corporate level enables staff to continuously solve prob-lems. Leveraging full potential of practices can be started with“transferring” authority from supervisors to line staff. Objective is to give employees the authority to solve problems on their own when they occur.
The element“Functional Integration and Qualification” experienced a slight decrease from 70% in 2004 to 68% in 2009. In general, the degree of cross-trained employees increased in the last years. However, feedback on existing trainings and job rotation is often not used to systematically adjust the qualification programs leading to this decrease.
Conclusions
The following conclusions can be drawn from the study: – As expected, due to the amount of personnel and
financial resources put into efficiency increase in operations, the industry did make continuous steps throughout the systems TPM, TQM, JIT, and the underlying EMS towards the desired state of “Opera-tional Excellence”, though there are no grand-scale developments. It can be said that most of the companies are still working on the effectiveness side (TPM and TQM) rather than focusing on the efficiency
side (JIT). Taking the model presented in Fig. 2, pharmaceutical companies are trying to build stable running machines and stable processes before targeting the objective of low inventory. It can be argued that the industry average is not that advanced to already set a new focus on efficiency. Pharmaceutical companies took control over their former low asset utilization, managed to improve the efficiency of their quality systems, but are still far away from having any kind of “continuous flow”, smooth production scheduling, or make-to-order manufacturing.
– For TPM, one could argue that the industry is in a state of stagnation concerning Total Productive Mainte-nance. The slight increase in implementing“Preventive maintenance” linked with a significant increase of Unplanned Maintenance (performance), leads to the difficulties in deploying the TPM strategy in the industry. For instance, a closer look at the element “Preventive Maintenance” showed that companies are setting the focus on technical aspects (e.g., checklists and documentation) rather than the empowerment of shop-floor employees (machine operators). The objec-tive of enabling the employees to solve problems occurred at their machines by themselves as well as understanding and working on the root causes of failures is yet to be achieved by the pharmaceutical industry.
– For TQM, companies were able to increase their implementation levels regarding Total Quality Man-agement significantly. The internal“process thinking” and the management of the downstream interface to customers were especially improved. The end-to-end consideration of the value-chain (suppliers –manufac-turer–customers) supports the steps to a higher quality
Implementation levels Key performance indicators
2009 6.0 % 2004 5.0 % +20% Fluctuation 4.0 % 2004 2009 4.0 % 0% Absenteeism 3.0 days 2004 2009 4.0 days -25% Training days 10 % 2004 2009 12 % -17% Unskilled employees 2009 83 % 2004 78 % +6% Direction setting 2009 73 % 2004 73 % 0%
Management Commitment and Company Culture
2009 69 %
2004 55 % +25%
Employee Involvement and Continuous Improvement
2009 68 %
2004 70 % -3%
Functional Integration and Qualif ication
Mean Standard Deviation
6.8% 5.1%
8.3% 7.6%
Mean Standard Deviation
4.7% 2.2%
4.4% 2.3%
Mean Standard Deviation
13%
82% 14%
Mean Standard Deviation
11%
75% 9%
Mean Standard Deviation
15%
70% 10%
Mean Standard Deviation
6.5 d 10.5 d 4.8 d 4.3 d
Mean Standard Deviation
17%
65% 15%
Mean Standard Deviation
15% 17% 17% 23% 77% 71% 55% 66%
level. It can be argued that the industry is moving from a cGMP-focused quality system towards a quality culture. – For JIT, improvements in the indicators for working
capital (e.g., finished goods turns) are mainly a result of intensified “Pull Production”. Unfortunately, the sec-ond core measure in JIT“times” increased as well. A threatening trend is the increase of times for set up and cleaning as well as for the production cycle from weighing to packaging. Setbacks in layout optimization and planning adherence could not be compensated by improved implementation of pull-system practices and caused the turn for the worse regarding the results of some performance indicators.
– For EMS, the decrease of training days from 2004 to 2009 shows that most pharmaceutical sites made one step backwards regarding the ultimate objective of “lean” to create a learning organization. This observa-tion is emphasized by the increase in fluctuaobserva-tion which leads to a loss of knowledge. The results for the performance indicators are confirmed by the analysis of the implementation. Besides “Employee involvement and continuous improvement”, which improved, all other categories in this system changed for the worse or stayed the same. Pharmaceutical companies were not able to re-design their existing management systems to facilitate the implementation of a learning organization with the objective to leverage the potential of high educational levels among employees.
Appendix A
Appendix B
Appendix C Table 1 Measurement of TPM implementation
Preventive maintenance
We have a formal program for maintaining our machines and equipment.
Maintenance plans and checklists are posted closely to our machines, and maintenance jobs are documented.
We emphasize good maintenance as a strategy for increasing quality and planning for compliance.
All potential bottleneck machines are identified and supplied with additional spare parts. We continuously optimize our maintenance
program based on a dedicated failure analysis. Our maintenance department focuses on
assisting machine operators perform their own preventive maintenance.
Our machine operators are actively involved into the decision-making process when we decide to buy new machines.
Our machines are mainly maintained internally. We try to avoid external maintenance service as far as possible.
Housekeeping Our employees strive to keep our plant neat and clean.
Our plant procedures emphasize putting all tools and fixtures in their place. We have a housekeeping checklist to
continuously monitor the condition and cleanness of our machines and equipment. Effective
technology usage
Our plant is situated at the leading edge of new technology in our industry.
We are constantly screening the market for new production technology and assess new technology concerning its technical and financial benefit.
We are using new technology very effectively. We rely on vendors for all of our equipment. Part of our equipment is protected by the firm’s
patents.
Proprietary process technology and equipment helps us gain a competitive advantage.
Table 2 Measurement of TPM performance Key performance indicator Definition Overall equipment effectiveness (OEE) OEE=(OEE) Availability×(OEE) Performance ×(OEE) Quality (OEE) Availability=(Scheduled Time–
Downtime)/Scheduled Time
(OEE) Performance =(Amount Produced× Ideal Cycle Time)/Available time (OEE) Quality=(Input-Defects)/Input Unplanned maintenance Proportion of unplanned maintenance
work as a percentage of the overall time spent for maintenance (in percent).
Table 3 Measurement of TQM implementation
Process management In our company direct and indirect processes are well documented. We continuously measure the quality of
our processes by using process measures (e.g., On-time-in-full delivery rate). Our process measures are directly linked to
our plant objectives.
In our company, there are dedicated process owners who are responsible for planning, management, and improvement of their processes.
Appendix D
Appendix E A large percentage of equipment on the
shop floor is currently under statistical process control.
We make use of statistical process control to reduce variances in processes. For root cause analysis, we have
standardized tools to get a deeper understanding of the influencing factors. We operate with a high level of process
analytical technology implementation for real time process monitoring and controlling.
Cross-functional product development
Manufacturing engineers are involved to a great extent in the development of a new drug formulation and the development of the necessary production processes. In our company product and process
development are closely linked to each other.
Due to close collaboration between the R&D and the manufacturing department, we could significantly shorten our time for product launches (“scale-ups”) in our plant. For the last couple of years, we have not had any delays in product launches at our plant. For product and process transfers between
different units or sites standardized procedures exist, which ensure a fast, stable, and complied knowledge transfer. Customer involvement We are frequently in close contact with our
customers.
Our customers frequently give us feedback on quality and delivery performance. We regularly survey our customer’s
requirements.
We regularly conduct customer satisfaction surveys.
On-time delivery is our philosophy. We jointly have improvement programs
with our customers to increase our performance.
Supplier quality management
Quality is our number one criterion in selecting suppliers.
We rank our suppliers; therefore, we conduct supplier qualification and audits. We use mostly suppliers that we have
validated.
For a large percentage of suppliers, we do not perform any inspections of the incoming parts/materials.
Inspections of incoming materials are usually performed in proportion to the past quality performance or type of supplier. Basically, we inspect 100% of our
incoming shipments.
We jointly have improvement programs with our suppliers to increase our performance.
Table 3 (continued)
Table 4 Measurement of TQM performance Key performance
indicator
Definition
Complaint rate (customer)
Number of complaints as a percentage of all customer orders delivered (in percent). Rejected batches Number of rejected batches as a percentage of
all batches produced (in percent). Complaint rate
(supplier)
Number of complaints as a percentage of all deliveries received (from your supplier; in percent).
Table 5 Measurement of JIT implementation Set-up time
reduction
We are continuously working to lower set-up and cleaning times in our plant.
We have low set-up times for equipment in our plant. Our crews practice setups regularly to reduce the
time required.
To increase the flexibility, we put high priority on reducing batch sizes in our plant.
We have managed to schedule a big portion of our setups so that the regular up-time of our machines is usually not affected.
Optimized set-up and cleaning procedures are documented as best-practice process and rolled-out throughrolled-out the whole plant.
Pull production Our production schedule is designed to allow for catching up, due to production stoppings because of problems (e.g., quality problems).
We use a pull system (kanban squares, containers, or signals) for production control.
We mainly produce according to forecasts. Suppliers are integrated and vendors fill our
kanban containers, rather than filling our purchasing orders.
We value long-term associations with suppliers more than frequent changes in suppliers. We depend on on-time delivery from our suppliers. We deliver to our customers in a demand-oriented
JIT way instead of a stock-oriented approach. We mainly produce one unit when the customer
orders one. We normally do not produce to stock. Layout
optimization
Our processes are located close together so that material handling and part storage are minimized. Products are classified into groups with similar
processing requirements to reduce set-up times. Products are classified into groups with similar
routing requirements to reduce transportation time.
The layout of the shop floor facilitates low inventories and fast throughput.
Appendix F
Appendix G As we have classified our products based on their
specific requirements our shop floor layout can be characterized as separated into “mini-plants”.
Currently, our manufacturing processes are highly synchronized over all steps by one takt. Currently, our manufacturing processes from raw
material to finished goods involve almost no interruptions and can be described as a full continuous flow.
At the moment, we are strongly working to reach the status of a full continuous flow with no interruption between raw material to finished goods.
We use“Value Stream Mapping” as a methodology to visualize and optimize processes.
Planning adherence
We usually meet our production plans every day. We know the root causes of variance in our
production schedule and are continuously trying to eliminate them.
To increase our planning adherence we share data with customers and suppliers based on a rolling production plan.
We have smoothly leveled our production capacity throughout the whole production process. Our plant has flexible working shift models so that
we can easily adjust our production capacity according to current demand changes. A smoothly leveled production schedule is
preferred to a high level of capacity utilization.
Table 5 (continued)
Table 6 Measurement of JIT performance Key performance
indicator
Definition
Set-up time The time for set up and cleaning in percentage of the scheduled time (in percent).
Raw material turns
Annual outward raw material movements divided by average annual raw material inventory stocks (number).
Finished goods turns
Annual outward finished goods material movements divided by average annual finished goods stocks (number).
Cycle time Time from weighing to packaging (in days). Service level Perfect order fulfillment (percentage of orders
shipped in time from your site (max.±1 days of the agreed shipment day) and in the right quantity (max. ±3% of the agreed quantity) and right quality) to your customer.
Table 7 Measurement of EMS implementation
Direction setting Our production site has an exposed site vision and strategy that is closely related to our corporate mission statement.
Our vision, mission, and strategy is broadly communicated and lived by our employees.
Goals and objectives of the manufacturing unit are closely linked and consistent with corporate objectives. The production site has a clear focus.
The overall objectives of the production site are closely linked to the team or personal objectives of our shop-floor teams and employees. Our manufacturing managers (head of
manufacturing, site leader, etc.) have a good understanding of how the corporate/divisional strategy is formed.
Our manufacturing managers know exactly what the most important criteria for manufacturing jobs are (i.e., low costs, delivery, quality, etc.). Management commitment
and company culture
Plant management empowers employees to continuously improve the processes and to reduce failure and scrap rates.
Plant management is personally involved in improvement projects. There is too much competition and
too little cooperation between the departments.
The communication is made via official channels.
The company has an open communication culture. There is a good flow of information between the departments and the different management levels.
About innovations we are informed early enough.
Problems (e.g., reclamations, etc.) are always traced back to their origin to identify root causes and to prevent doing the same mistakes twice. The achievement of high quality standards is primarily the task of our QA/QC departments.
Our employees continuously strive to reduce any kind of waste in every process (e.g., waste of time, waste of production space, etc.). Command and control is seen as the
most effective leadership style rather than open culture.
Appendix H
References
1. Kavilanz P. Drug recalls surge. CNNMoney 2010
2. Bogdanich W. Heparin find may point to Chinese counterfeiting. New York Times 2008
3. Food and Drug Association. Information on heparin. October 2009.
http://www.fda.gov/drugs/drugsafety/postmarketdrugsafetyinformation forpatientsandproviders/ucm112597.htm
4. Rockhoff JD. Drug manufacturing mending after questions of quality. The Wall Street Journal. 2010
5. Van Arnum P. Big pharma tightens its global manufacturing belt. Pharm Technol. 2009;8:49–53.
6. Schonberger R. World class manufacturing: the lessons of simplicity applied. New York: Free; 1986.
7. Friedli T et al. Operational excellence in the pharmaceutical industry. Aulendorf: Editio Cantor Verlag; 2006.
8. Cua KO, McKone KE, Schroeder RG. Relationships between implementation of TQM, JIT, and TPM and manufacturing performance. J Oper Manage. 2001;19(2):675–94.
9. McKone KE, Weiss EN. Total productive maintenance: bridging the gap between practice and research. Prod Oper Manage. 1999;7 (4):335–51.
10. Shah R, Ward PT. Lean manufacturing: context, practice bundles, and performance. J Oper Manage. 2003;21(2):129–49.
11. Flynn BB, Sakakibara S, Schroeder RG. Relationship between JIT and TQM: practices and performance. Acad Manage J. 1995;38(5):1325–60. 12. Sakakibara S, Flynn BB, Schroeder RG. A framework and measurement instrument for just-in-time manufacturing. Prod Oper Manage. 1993;2(3):177–94.
13. Likert R. A technique for the measurement of attitude. Arch Psychol. 1932;140:1–55.
14. Cox III EP. The optimal number of response alternatives for a scale: a review. J Mark Res. 1980;17(4):407–22.
15. Tsarouhas P. Implementation of total productive maintenance in food industry: a case study. J Qual Maint Eng. 2007;13(1):5–18. 16. Pendrous R. Effective choices. Food Manuf. 2002;77(1):30. 17. Connolly C. MediSeal GmbH improves pharmaceutical packaging
efficiency for small batch sizes. Assembly Automation. 2007;27 (2):118–22.
18. Greb E. Is JIT manufacturing the right prescription? Pharm Technol. 2009;3:72–8.
Employee involvement and continuous improvement
We have implemented tools and methods to deploy a continuous improvement process.
Our employees are involved in writing policies and procedures (concerning site vision down to standard operating procedures).
Shop-floor employees actively drive suggestion programs.
Our work teams cannot take significant actions without supervisors or middle managers approval.
Our employees have the authority to correct problems when they occur.
Occurring problems should be solved by supervisors.
Supervisors include their employees in solving problems.
Our plant forms cross-functional project teams to solve problems. The company takes care of the
employees.
We have organized production employees into teams in production areas. For each team there is one dedicated team member that is responsible for supervisory tasks.
We have organized production employees into teams in production areas. For team leadership we have an additional supervisory level in our organization.
Functional integration and qualification
Each of our employees within our work teams (in case workers are organized as teams) is cross-trained so that they can fill-in for others when necessary.
At our plant, we have implemented a formal program to increase the flexibility of our production workers. Employees rotate to maintain their qualification. In our company there are monthly
open feedback meetings. The information of these official
feedback meetings is used systematically in further training. We continuously invest in
training and qualification of our workers. We have a dedicated development and qualification program for our production workers. Table 7 (continued)
Table 8 Measurement of EMS performance Key performance
indicator
Definition
Fluctuation Employee turnover at your site (includes all kinds of fluctuations of employees: terminations, expired work contracts, retirements, etc.; in percent).
Absenteeism Total time of employees absent (e.g., sick leave) as a percentage of the total working time (in percent).
Training days Number of training days per employee (all kinds of training off- and on the job; in days of the year).
Unskilled employees
Number of unskilled employees as a percentage of the total number of employees at your site (in percent).