ARTICLE
Peroxisome proliferator-activated receptor
α (PPARα)
protects against oleate-induced INS-1E beta cell dysfunction
by preserving carbohydrate metabolism
F. Frigerio&T. Brun&C. Bartley&A. Usardi&D. Bosco& K. Ravnskjær&S. Mandrup&P. Maechler
Received: 27 August 2009 / Accepted: 18 September 2009 / Published online: 12 November 2009
# Springer-Verlag 2009
Abstract
Aims/hypothesis Pancreatic beta cells chronically exposed to fatty acids may lose specific functions and even undergo apoptosis. Generally, lipotoxicity is triggered by saturated fatty acids, whereas unsaturated fatty acids induce lipo-dysfunction, the latter being characterised by elevated basal insulin release and impaired glucose responses. The peroxisome proliferator-activated receptor α (PPARα) has been proposed to play a protective role in this process, although the cellular mechanisms involved are unclear. Methods We modulated PPARα production in INS-1E beta cells and investigated key metabolic pathways and genes responsible for metabolism–secretion coupling during a culture period of 3 days in the presence of 0.4 mmol/l oleate.
Results In INS-1E cells, the secretory dysfunction primarily induced by oleate was aggravated by silencing of PPARα. Conversely, PPARα upregulation preserved
glucose-stimulated insulin secretion, essentially by increasing the response at a stimulatory concentration of glucose (15 mmol/l), a protection we also observed in human islets. The protective effect was associated with restored glucose oxidation rate and upregulation of the anaplerotic enzyme pyruvate carboxylase. PPARα overproduction increased both β-oxidation and fatty acid storage in the form of neutral triacylglycerol, revealing overall induction of lipid metabolism. These observations were substantiated by expression levels of associated genes.
Conclusions/interpretation PPARα protected INS-1E beta cells from oleate-induced dysfunction, promoting both preservation of glucose metabolic pathways and fatty acid turnover.
Keywords Beta cells . Fatty acids . Insulin secretion . PPARα
Abbreviations
ACC Acetyl-CoA carboxylase
CPT1 Carnitine palmitoyl transferase 1 FAT Fatty acid translocase
PPARα Peroxisome proliferator-activated receptor α
RXR Retinoid X receptor
shRNA Short hairpin RNA
Introduction
During the last few decades, an abundant energy supply and reduced physical activity have resulted in a dramatic increase in the incidence of obesity-associated diseases such as type 2 diabetes [1]. Adipose tissue and circulating non-esterified fatty acids (NEFA) play a central role in the
Electronic supplementary material The online version of this article (doi:10.1007/s00125-009-1590-6) contains supplementary material, which is available to authorised users.
F. Frigerio
:
T. Brun:
C. Bartley:
A. Usardi:
P. Maechler (*) Department of Cell Physiology and Metabolism,University of Geneva Medical Center, 1 rue Michel-Servet,
1211 Geneva 4, Switzerland e-mail: [email protected] D. Bosco
Department of Surgery, University Medical School and Geneva University Hospitals,
Geneva, Switzerland K. Ravnskjær
:
S. MandrupDepartment of Biochemistry and Molecular Biology, University of Southern Denmark,
pathogenesis of the insulin resistance associated with obesity [2]. Excessive lipid accumulation in adipose tissues causes fatty acid spillover towards peripheral organs. These include the liver, skeletal muscles and the endocrine pancreas, providing a lipid environment that could interfere with their normal physiology and function [3,4]. Numerous studies have shown that insulin resistance precedes the development of hyperglycaemia in people who will eventually develop beta cell dysfunction and, consequently, type 2 diabetes [5]. In particular, chronic exposure of pancreatic beta cells to NEFA can induce desensitisation of glucose-stimulated insulin secretion [6]. These associated pathologies call for better understanding of the links between physiological nutrient states and molecular meta-bolic sensors in the beta cell.
The peroxisome proliferator-activated receptor α (PPA Rα) is a nuclear receptor commonly considered to be a lipid sensor controlling the expression of genes involved in fat metabolism [7]. PPARα is the molecular target of the fibrate class of lipid-lowering drugs and is involved in metabolic adaptations to fasting and high-fat diets in the liver [8–10]. In Pparα (also known as Ppara)-null mice, the fasting state induces hyperinsulinaemic hypoglycaemia
[11, 12]. Pancreatic islets isolated from Pparα-null mice
exhibit normal glucose oxidation and enhanced glucose-induced insulin secretion [13], an effect that might be the direct consequence of PPARα abrogation or an adaptation secondary to hepatic changes [11]. PPARα action is not limited to hepatic tissue and, along with adipose tissue and muscles, pancreatic beta cells also produce PPARα [14]. In insulinoma INS-1E cells, PPARα activation increases fatty acid uptake and mitochondrial oxidation capacity, in association with enhanced glucose-stimulated insulin secretion [15].
It is now well established that fatty acids can be toxic to beta cells. Such lipotoxicity is typically induced by saturated fatty acids, resulting in apoptosis [16–18]. A less severe effect of fatty acids on beta cells leads to elevated basal insulin release accompanied by impaired glucose-stimulated insulin secretion, a phenomenon we refer to as lipodysfunction [19,20]. Recent studies indicate a new role for PPARα in beta cells, that of protecting against fatty acid-induced dysfunction [20–22]. In rats, it was observed that activation of PPARα for 24 h can reverse the insulin hypersecretion induced by high-fat feeding [23]. In ob/ob mice, glucose intolerance is aggravated by the absence of PPARα, correlating with reduced glucose-stimulated insu-lin secretion in isolated islets [21]. The same study reported that PPARα agonists protected human islets from palmitate-induced lipotoxicity [21]. In pregnant rats fed a high-fat diet, in vivo administration of a PPARα agonist has been shown to prevent loss of glucose-stimulated insulin secretion [24]. In another in vivo study, chronic treatment
with a PPARα agonist inhibited the development of diabetes in the Zucker Diabetic Fatty rat, essentially by improving the pancreatic insulin response [22]. These recent reports indicate a direct role for PPARα in the protection of beta cells against lipid-induced dysfunction. However, the molecular mechanisms responsible for such effects have not yet been elucidated.
Current knowledge suggests interactions between the lipid sensor action of PPARα and the maintenance of beta cell function, which is primarily glucose-dependent. Here, PPARα production was genetically modulated (either induced or repressed) and we investigated changes over a 3-day period in a model of fatty acid-induced beta cell dysfunction using the monounsaturated fatty acid oleate at a concentration mimicking pathophysiological situations.
Methods
Cell culture and treatments Clonal insulin-secreting INS-1E cells (used between passages 50 and 100) were cultured in a humidified atmosphere containing 5% CO2in RPMI 1640 supplemented with 10 mmol/l HEPES, 5% (vol./vol.) FCS, 2 mmol/l glutamine, 100 U/ml penicillin, 100 g/ml streptomycin, 1 mmol/l sodium pyruvate and 50 µmol/l 2-mercaptoethanol [25]. Where indicated, cells were trans-duced with the following adenoviruses: empty construct, retinoid X receptor α (RXRα) and PPARα for overpro-duction, and short hairpin RNA (shRNA)-PPARα for knockdown. Adenoviruses were generated and used as described previously [15]. INS-1E cells were transduced with the respective adenoviruses (about 40 plaque-forming units/cell) for 1 h and further cultured for 1–3 days before experiments. In the 1 day protocol, cells were additionally treated with the PPARα-specific ligand WY14643 (30 µmol/l; Sigma-Aldrich, St Louis, MO, USA). Where indicated, cells were treated with 0.4 mmol/l oleate or palmitate complexed to BSA.
Preparation of NEFA Stock solutions of fatty acids (oleate and palmitate; Sigma-Aldrich) bound to BSA were prepared as follows. The corresponding sodium salt NEFA was solubilised at 37°C for 16 h under a nitrogen atmosphere in Krebs–Ringer bicarbonate buffer containing 10 mmol/l HEPES (pH 7.4) and 12.5% (wt/vol.) fatty acid-free BSA (Sigma-Aldrich). Solutions were adjusted to pH 7.4 and then filtered through a 0.2 µm filter. BSA-bound fatty acids were quantified using a commercial kit and stock solutions were finally adjusted to 10 mmol/l fatty acids using 1.8 mmol/l fatty acid-free BSA before storage at−20°C under nitrogen. In our experiments, the molar ratio of total NEFA to BSA was 5.6:1. The calculated concentrations of non-albumin-bound (un-bound) fatty acids in the medium were derived from this
molar ratio using the stepwise equilibrium model [26,27]. On the basis of a final concentration of NEFA of 0.4 mmol/l, unbound concentrations of oleic and palmitic acids were about 0.5 µmol/l and 0.1 µmol/l, respectively. The presence of 5% FCS in the medium increased total fatty acid concentration by less than 4% and this contribution was considered negligible. Overall, the level of 0.5 µmol/l of unbound oleate was about 50 times higher than physiological levels of NEFA in human serum [28], i.e. it provided a model mimicking pathophysiological situations.
Apoptosis measurements INS-1E cells were treated for 1 and 3 days as described above, before fixation in 4% paraformaldehyde. Cell death was quantified using the terminal deoxynucleotidyl transferase (TdT)-mediated dUTP nick end labelling (TUNEL) assay kit according to the manufacturer’s instructions (Roche Diagnostics, Basel, Switzerland). Nuclei were stained with 10 µg/ml DAPI (Sigma-Aldrich). Cells were counted using a Zeiss Axio-phot microscope and the results are presented as TUNEL-positive cells as percentages of total INS-1E cells.
Control of PPARα production by immunoblotting PPARα-downregulated cells were treated for nuclear protein extraction. In brief, cells were harvested in buffer A (10 mmol/l HEPES, pH 7.9, 10 mmol/l KCl, 0.1 mmol/l EDTA) and centrifuged at 4°C, 15,000 g. The pellet was disrupted into buffer B (20 mmol/l HEPES, pH 7.9, 0.4 mol/l NaCl, 1 mmol/l EDTA, 10% glycerol). INS-1E cells transduced with Pparα/Rxrα-expressing adenoviruses were harvested in RIPA lysis buffer (50 mmol/l Tris pH 7.2, 150 mmol/l NaCl, 1% Triton X, 0.1% SDS, 1 mmol/l EDTA, 1% deoxycholic acid, 50 mmol/l NaF, 0.2 mmol/l Na3VO4, 10 µg/ml aprotinin, 10 µg/ml leupeptin, 10 µg/ml pepstatin A, and 1 mmol/ l phenylmethylsulphonyl fluoride). Protein extracts were separated by SDS-PAGE. Proteins were blotted onto nitrocel-lulose membrane Hybond-ECL (Amersham Bioscience, Piscataway, NJ, USA) and probed with antibodies against PPAR-α (H98 sc9000, Santa Cruz Biotechnology, Santa Cruz, CA, USA), nucleolin (Santa Cruz) and actin (Chem-icon-Millipore, Zug, Switzerland). Secondary horseradish peroxidase-coupled antibody anti-mouse IgG and anti-rabbit IgG were purchased from Amersham Bioscience. The target proteins were visualised by chemiluminescence (ECL Super-Signal West Pico Chemiluminescent; Pierce, Rockford, IL, USA) and by analysing the blot with the ChemiDoc XRS System (Bio-Rad, Hercules, CA, USA). Protein-related bands were quantified with Scion Image for Windows (Scion, Frederick, MD, USA).
Glucose-stimulated insulin secretion and ATP generation INS-1E cells were cultured in 24-well plates, transduced with the indicated adenoviruses and cultured for 1 and 3 days as
described above in the absence or presence of 0.4 mmol/l oleate. The insulin secretory assay was performed as described above in KRBH medium [25]. Cellular ATP concentrations were determined in INS-1E cells treated as described above. Following 2 h in glucose free culture medium and 30 min incubation in glucose-free KRBH buffer, cells were exposed to basal (2.5 mmol/l) and stimulating (15 mmol/l) glucose concentrations. After 10 min of stimulation, cellular ATP concentrations were determined using the ATP Bioluminescence Assay Kit (Roche Diagnostics).
Measurement of β-oxidation rate The lipid oxidation capacity of INS-1E cells was measured as detailed previously [15]. Cells were incubated for 4 h in the presence of 0.1 mmol/l oleate and 3.70 kBq/ml radio-labelled [14C]oleate (American Radiolabeled Chemicals, MO, USA). The reaction was stopped with 0.6 mol/l HCl. After 1 h, the radioactivity absorbed by 3MM filter paper was measured using scintillation fluid (Lumagel Plus; Lumac, Groningen, The Netherlands) in a LKB-Wallac 1217 Rackbeta counter (PerkinElmer; Wallac Oy, Turku, Finland). The β-oxidation rate was expressed as nmol oxidised oleate (mg protein)−1h−1.
Quantitative RT-PCR INS-1E cells were cultured in 10 cm dishes and treated as described in the Results section. Total RNA was extracted using the NucleoSpin RNA II Kit (Macherey-Nagel, Düren, Germany) and 2 µg was con-verted into cDNA [20]. Fatty acid translocase (FAT [also known as CD36]), carnitine palmitoyl transferase 1 (CPT1), citrate lyase, malonyl-CoA decarboxylase, and the house-keeping genesβ-actin, transcription initiation factor IIb and α-tubulin primers were designed using Primer Express software (Applera Europe, Rotkreuz, Switzerland). Primer sequences are listed in Table 1 in the Electronic Supple-mentary Material (ESM). Quantitative real-time PCR was performed at the Genomics Platform of the NCCR Frontiers in Genetics (University of Geneva, Geneva, Switzerland). Cellular triacylglycerol quantification Cells were plated in 10 cm dishes and cultured as described above. After 3 days of treatment, cells were harvested and lipids were extracted using the method of Folch et al. [29]. Triacylglycerol was quantified by measuring glycerol release using a commer-cial kit (Roche Diagnostics) and normalised to protein content.
Lipid staining Cells were treated as described above for a 3-day period. In order to visualise the lipid content, cells were fixed in 4% paraformaldehyde and stained with Oil Red O (stock solution, 5 g/l dissolved in 60% triethyl phosphate; working solution, 60:40 Oil Red O stock,
distilled water) for 1 h. Images were acquired with an Axiovert 25 microscope (Carl Zeiss, Gottingen, Germany). Phosphoacetyl-CoA carboxylase INS-1E cells were cul-tured and treated with PPARα/RXRα-overproducing ade-novirus and oleate as described above. After 1 day of treatment, cells were harvested in RIPA buffer. SDS-PAGEs were run on gradient polyacrylamide gels. Nitrocellulose membranes were probed with antibodies against total and phosphoacetyl-CoA carboxylase (pACC) (Cell Signaling Technology, Danvers, MA, USA) or actin (Chemicon-Millipore). Target proteins were visualised by chemilumi-nescence using secondary horseradish peroxidase-coupled antibodies.
Glucose oxidation After the culture period, cells were preincubated for 2 h in glucose-free RPMI medium and for 30 min in 0.1% BSA–KRBH buffer before exposure to a stimulatory glucose concentration of 15 mmol/l. The rate of glucose oxidation over a period of 1 h was measured as described [30]. Radiolabelled CO2released from cells was measured using [U-14C]glucose as substrate and 14CO2 production was measured with an LKB-Wallac 1217 Rackbeta counter.
Pyruvate carboxylase levels Expression of pyruvate carboxylase was assessed by immunoblotting using the biotin–streptavidin system as described previously [31]. INS-1E cells were transduced with Pparα/Rxrα-expressing adenoviruses and subsequently cultured as described above. Mitochondrial protein extracts were separated by SDS-PAGE on a 10% bis-acrylamide gel. Pyruvate carboxylase was detected by means of streptavidin horseradish peroxidase-conjugated antibody (Invitrogen). Biotin peroxidase-conjugated to pyruvate carboxylase was visualised by chemiluminescence. Statistical analysis Insulin secretion, glucose oxidation, triacylglycerol quantification and gene expression were analysed using the SPSS 15.0 statistical package (SPSS, Chicago, IL, USA). Specifically, statistical tests were performed using one-way ANOVA. Pairwise testing with a post hoc multiple comparison procedure (Fisher’s least significant difference method) was used. Results were considered statistically significant at p<0.05.
Results
Effects of fatty acids on cell viability The aim of the present study was to investigate the role of PPARα in fatty acid-induced dysfunction, dissociated from potential cytotoxic effects that promote cell death. Lipotoxicity resulting in
Adenovirus Control shPPARα 0.0 0.2 0.4 0.6 0.8 1.0 1.2 Contr o l shP P A R α PPAR α protein levels (normalised to nucleolin) 0.0 1.0 2.0 3.0 4.0 5.0 6.0
Control shPPARα Oleate shPPARα+
oleate
Insulin secretion (% content)
** * TUNEL-positive cells (%) 1 day 3 days 0 2 4 6 8 10 12 14 16 * ** † † †
a
b
d
c
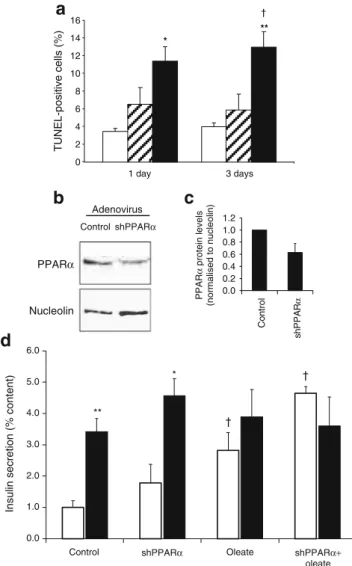
PPARα NucleolinFig. 1 Effects of fatty acid exposure and downregulation of PPARα in INS-1E cells. a Quantification of cell death in INS-1E cells after exposure to oleate and palmitate. INS-1E cells were cultured for 1 and 3 days in the absence of fatty acids (control, white bars) or with 0.4 mmol/l oleate (shaded bars), or 0.4 mmol/l palmitate (black bars). Apoptosis was measured by the TUNEL assay. Values are mean ± SE. *p<0.05, **p<0.01 vs control. †p<0.01 vs oleate condition; n=3 independent experiments. b INS-1E cells were transduced with shRNA-Pparα-expressing adenovirus (shPPARα) or empty virus (control) and subsequently cultured for 3 days. Levels of PPARα protein were assessed by immunoblotting on INS-1E nuclear extracts. PPARα protein production was normalised to nucleolin. The immunoblot is representative of three independent experiments and quantified bands are averaged in the accompanying bar graph (c). d INS-1E cells were transduced with shPPARα or empty (control) adenoviruses and subsequently cultured for 3 days in the absence or presence of 0.4 mmol/l oleate. Glucose-stimulated insulin secretion was measured in INS-1E cells by PPARα knockdown 3 days after adenoviral transduction. Insulin release was measured at basal (2.5 mmol/l, white bars) and stimulatory (15 mmol/l, black bars) glucose concentrations during a 30 min incubation period. Values are mean ± SE; n=4 independent experiments. *p<0.05, **p<0.01 vs corresponding basal 2.5 mmol/l glucose; †p < 0.05 vs control 2.5 mmol/l glucose
apoptosis is typically induced by saturated fatty acids [17, 18], whereas unsaturated fatty acids trigger impairment of glucose-stimulated insulin secretion [20]. To test cell viability during a 3-day culture protocol, INS-1E cells were exposed to either monounsaturated oleic acid or saturated palmitic acid (both at 0.4 mmol/l) and cell death was quantified with the TUNEL assay. In the absence of exogenous fatty acids, cells showed minimal (<5%) apoptosis (Fig. 1a). Oleate did not induce significant changes in apoptotic rate. On the contrary, palmitate induced rapid and sustained apoptosis, which reached 11.4±1.6% after 1 day (3.3-fold vs control, p<0.05) and 13.0±1.7% after 3 days (3.3-fold vs control, p<0.01). In accordance with a previous report [16], our data show that, over a 3-day exposure period, oleate, unlike palmitate, does not alter cell viability. Accordingly, oleate was used for the rest of the study.
Downregulation of PPARα and lipid-induced dysfunction Potential protective effects of PPARα were tested by evaluating the secretory capacity of INS-1E cells in which
PPARα had been knocked down. Figure 1b, c shows
PPARα protein quantification in control cells transduced with empty adenovirus and cells transduced with shRNA-Pparα-expressing adenovirus 3 days before analysis. The immunoblots revealed reduced PPARα levels (−37% on average, n=3) in the shRNA-PPARα group compared with the control and normalised to housekeeping gene nucleolin (NCL) expression. Specificity was confirmed by RT-PCR with primers targeting different PPAR isoforms (data not shown). The apoptotic rate was not modified by PPARα knockdown, either in cells cultured in standard media or in cells exposed to oleate (ESM Fig.1).
For secretion experiments, cells were treated with the adenoviruses mentioned above and cultured in normal medium supplemented or not with 0.4 mmol/l oleate. On stimulation with 15 mmol/l glucose, control INS-1E cells increased their insulin secretion 3.4-fold vs basal release at 2.5 mmol/l glucose (p<0.01; Fig. 1d). Downregulation of PPARα did not modify the secretory response in cells cultured in standard medium (2.6-fold vs basal, p<0.05). As expected, oleate treatment induced an increase in basal insulin release (+82% vs control, p<0.05) associated with a blunted secretory response to stimulatory glucose (1.4-fold vs basal, not significant). Insulin contents were not modified by the 3 day oleate treatment, as reported previously [20]. Oleate-treated INS-1E cells in which PPARα was downregulated totally lost their glucose-induced secretory response. PPARα downregulation did not change cellular insulin content either in normal culture conditions (control, 1.10±0.13 µg/well; shPPARα, 0.82± 0.35 µg/well; not significant) or in oleate-treated cells (control oleate, 1.20±0.53 µg/well; shPPARα oleate, 0.82±
0.13 µg/well). This set of data shows that endogenous production of PPARα confers at least partial protection against oleate-induced INS-1E cell dysfunction.
Upregulation of PPARα and fatty acid oxidation Next, PPARα was overproduced in association with its hetero-dimerising receptor, RXR, in INS-1E cells by transduction with adenoviruses expressing PPARα/RXRα or an empty construct as a control. The immunoblot (Fig. 2a, b) shows
a
b
c
d
PPARα Nucleolin Adenovirus Control PPARα 0.0 0.4 0.8 1.2 1.6 2.0 2.4 2.8 Control PPAR α PPAR α protein levels (normalised to nucleolin) 0.0 1.0 2.0 3.0 4.0 5.0 6.0 7.0 8.0Control PPARα Oleate PPARα+
oleate
Insulin secretion (% content)
** ** ** ** ** 0.4 0.6 0.8 1.0 1.2 1.4 Cellular ATP (µ mol/mg protein) ** * *
Control PPARα Oleate PPARα+
oleate ††
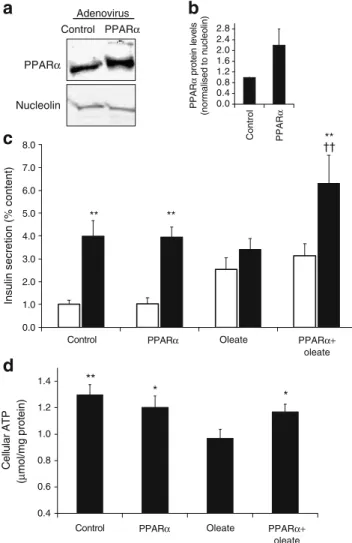
Fig. 2 Upregulation of PPARα and effects on glucose response in INS-1E cells. INS-1E cells were transduced with empty (control) or Pparα/Rxrα-expressing (PPARα) adenoviruses and, where indicated, subsequently cultured for 3 days in the presence of 0.4 mmol/l oleate before analysis. a PPARα protein levels were assessed by immuno-blotting and normalised to nucleolin. The immunoblot is representa-tive of four independent experiments and quantified bands are averaged in the accompanying bar graph (b). c Insulin release was measured at basal (2.5 mmol/l, white bars) and stimulatory (15 mmol/ l, black bars) glucose concentrations during a 30 min incubation period. Values are mean ± SE of six independent experiments. **p< 0.01 vs corresponding basal glucose (2.5 mmol/l);††p<0.01 vs oleate group at 15 mmol/l glucose. d At the end of the culture period, cellular ATP levels were measured after 10 min of incubation at a stimulatory glucose concentration (15 mmol/l). Values are mean ± SE of 10 independent experiments; *p<0.05, **p<0.01 vs oleate group
an adenovirus-mediated increase in PPARα levels com-pared with the control (2.2-fold on average, n=4). The apoptotic rate was not modified in cells overproducing PPARα, whether cultured in standard medium or in medium supplemented with fatty acids (ESM Fig. 1). To verify the functional effects of PPARα overproduction, we first quantified the β-oxidation rate in cells at day 3 after transduction. As expected, PPARα overproduction increased fatty acid oxidation by 32% compared with non-transduced control cells (12.0±2.9 vs 9.1±2.2 nmol oleate/mg protein, respectively; p<0.05; n=6). This observation was correlated with the early change (day 1) induced by PPARα upregu-lation in the abundance of CPT1, a rate-limiting enzyme for fatty acid oxidation. Specifically, PPARα overproduction increased the level of CPT1 transcript 3.7-fold compared with the control (p<0.02, n=4), demonstrating functional overproduction of PPARα.
Upregulation of PPARα and lipid-induced dysfunction Glucose-stimulated insulin secretion was then tested in cells overexpressing Pparα/Rxrα after 3 days of culture in the presence of 0.4 mmol/l oleate. Control and PPARα/ RXRα-overproducing cells responded to high glucose (15 mmol/l) stimulation by increasing insulin secretion above the basal rate by 4.0-fold (p<0.01) and 3.9-fold (p< 0.01), respectively (Fig. 2c). Oleate treatment blunted glucose-induced insulin secretion to a non-significant 1.3-fold response. The secretory response was partially restored by Pparα/Rxrα overexpression (2.0-fold vs basal, p<0.01). In particular, insulin release from Pparα/Rxrα-overexpress-ing cells stimulated with 15 mmol/l glucose was increased by 85% (p<0.001) compared with the respective oleate controls (Fig.2c). Cellular insulin content was not modified by overexpression of Pparα/Rxrα after 3 days of culture in the absence or presence of oleate (control, 2.72±0.95 µg/ well; PPARα/RXRα, 2.80±0.66 µg/well; control-oleate, 2.97±0.87 µg/well; PPARα/RXRα-oleate, 2.58±1.5 µg/ well). These data show protective effects of PPARα against beta cell dysfunction induced by oleate.
Human islets were also used in the same 3 day protocol and tested for glucose-stimulated insulin secretion (ESM Fig.2). The secretory response of control islets to 16.7 mmol/l glucose was 1.9-fold (p<0.05 vs basal release). Human islets exposed for 3 days to 0.4 mmol/l oleate exhibited increased basal insulin release (+99% vs basal control, p<0.05) and did not respond to stimulatory glucose. Upregulation of PPARα in oleate-treated islets partially preserved glucose-stimulated insulin secretion (1.4-fold vs basal release, p<0.05).
ATP is the primary mitochondrial factor linking glucose metabolism to insulin exocytosis. Cellular ATP levels were measured at the end of the 3 day culture period after stimulation with 15 mmol/l glucose (Fig. 2d). In control cells, PPARα overproduction did not modify cellular ATP
concentrations. In cells previously exposed to oleate for 3 days, ATP levels were reduced by 25% compared with control (p<0.01). Upregulation of PPARα restored cellular ATP levels in oleate-treated cells (+21% vs oleate group, p< 0.05), reaching values similar to those in control cells cultured in media not supplemented with oleate (Fig.2d).
Glucose responses were also tested as early as 1 day after oleate exposure plus PPARα upregulation (ESM
Fig. 3). At this early time point, PPARα overproduction
was combined with addition of synthetic PPARα ligand
e
0.0 0.5 1.0 1.5 2.0 2.5 3.0 3.5 4.0Control PPARα Control+
oleate PPARα+ oleate Cellular triacylglycerol (µ g/mg protein) * ** †† †
a
b
d
c
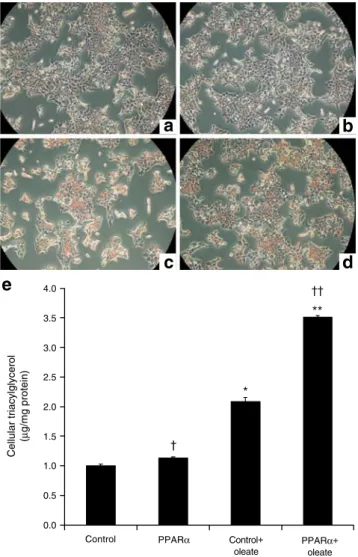
Fig. 3 Cellular lipid quantification in INS-1E cells treated with PPARα and oleate. INS-1E cells were transduced with empty (control) or Pparα/Rxrα-expressing (PPARα) adenoviruses and subsequently cultured for 3 days in the absence or presence of 0.4 mmol/l oleate before lipid quantification. a–d At the end of the 3 day culture period, INS-1E cells were fixed and stained with Oil Red O to reveal lipids by red staining. INS-1E cells were transduced with control (a, c) or PPARα (b, d) adenoviruses and cultured in the absence (a, b) or presence (c, d) of 0.4 mmol/l oleate. Images are representative of three independent preparations. e Cellular triacylglycerol was quantified and normalised to control. Values are mean ± SE; n=4 independent experiments. *p<0.05, **p<0.01 vs control; †p<0.05, ††p<0.01 vs oleate group
(30 µmol/l WY14643). In oleate-treated INS-1E cells, the secretory response to 15 mmol/l glucose was nearly abolished, in good agreement with previous observations [20]. Cells treated with oleate and overproducing PPARα exhibited a restored secretory response evoked by 15 mmol/l glucose (2.0-fold, p<0.01 vs basal). This correlated with elevated cellular ATP levels in oleate-treated cells overproducing PPARα (+42%, p<0.05 vs oleate group).
Cellular lipid quantification Next, we estimated triacylgly-cerol accumulation in INS-1E cells treated for 3 days. Staining with Oil Red O (Fig.3a–d) revealed accumulation of lipids in cells exposed to oleate. Surprisingly, INS-1E cells treated with oleate and concomitantly overexpressing Pparα/Rxrα exhibited stronger lipid staining (Fig. 3d).
The lipid storage shown in Fig.3a–d was substantiated by quantitative analysis, as shown in Fig. 3e. Cellular triacylglycerol concentrations were augmented, as expected, in oleate treated cells compared with controls (2.9-fold, p<0.05). PPARα/RXRα overproduction further increased the storage of cellular triacylglycerol after culture in the presence of oleate (+70%, p<0.01, PPARα+oleate vs oleate group).
Expression of cellular fatty acid regulators To investigate the molecular mechanisms by which oleate and PPARα induced lipid accumulation over the 3 day period, we analysed cells at the beginning of the culture period. Expression of key regulators of fatty acid pathways were measured at day 1 in cells exposed to 0.4 mmol/l oleate and
with upregulation of PPARα/RXRα combined with
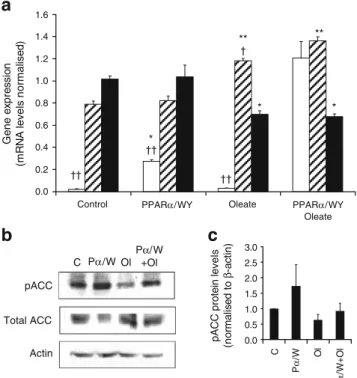
30 µmol/l WY14643 (PPARα/WY), as described above. Simultaneous treatment with PPARα/WY and oleate dramatically increased the expression of FAT (57-fold for PPARα/WY+oleate vs control, p<0.01; 40-fold vs oleate group, p<0.01), suggesting that oleate, or a metabolite of oleate, acts as an agonist of PPARα and that activation of PPARα may lead to substantial enhancement of FAT-mediated fatty acid uptake (Fig.4a).
Expression of citrate lyase, the enzyme that initiates fatty acid synthesis, was reduced by oleate treatment (−31% vs control group, p<0.05) and unchanged by PPARα upregu-lation (Fig.4a). Malonyl-CoA decarboxylase is a regulatory enzyme that decreases malonyl-CoA levels, thereby reliev-ing CPT1 inhibition and resultreliev-ing in activation of fatty acid oxidation. Oleate exposure increased malonyl-CoA decar-boxylase abundance (+49% vs control group, p<0.01), which was further enhanced by PPARα/WY (+15% vs oleate group, p<0.05).
Potential early modifications of the key step controlling the de novo synthesis of fatty acids were then tested by measuring the phosphorylation state of acetyl-CoA carbox-ylase (ACC). ACC activity is tightly regulated according to
the state of phosphorylation, phosphorylated ACC being the less active form. As shown in Fig.4b, c, upregulation of PPARα markedly increased ACC phosphorylation. Cells cultured in the presence of oleate exhibited reduced ACC phosphorylation. Simultaneous PPARα overproduction and oleate exposure partially restored the ACC phosphorylation state, indicating reduced potential for de novo synthesis of fatty acids upon production of PPARα.
These data show that oleate exposure and PPARα upregulation promote early modifications of fatty acid pathway regulators, resulting in modification of lipid partitioning. In particular, PPARα repressed the fatty acid synthesis pathway, whereas it induced both fatty acid oxidation and fatty acid storage in the form of neutral lipids, i.e. triacylglycerols. Of note, elevated levels of the
Actin pACC Total ACC C Pα/W OlP+Olα/W 0.0 0.2 0.4 0.6 0.8 1.0 1.2 1.4 1.6
Control PPARα/WY Oleate PPARα/WY
Oleate Gene e x pre s s io n (m R N A lev e ls n o rm a lise d ) †† †† †† † ** ** * * * 0.0 0.5 1.0 1.5 2.0 2.5 3.0 C P α /W Ol P α /W + O l
pACC protein lev
e ls (n ormal is e d t o β -a c tin)
Fig. 4 Effects of oleate and PPARα on expression of cellular fatty acid regulators. INS-1E cells were transduced with empty (control) or Pparα/Rxrα-expressing (PPARα or Pα) adenoviruses and subse-quently cultured for 1 day in the absence or presence of PPARα ligand (30 µmol/l WY14643, WY) and 0.4 mmol/l oleate (Ol) before analysis. a Effects of PPARα and oleate on expression of FAT (white bars), malonyl-CoA decarboxylase (shaded bars) and citrate lyase (black bars). At the end of the culture period, mRNA was extracted and gene expression quantified by qRT-PCR, normalised to average expression of three housekeeping genes (β-actin, transcription initiation factor IIb and α-tubulin). Values (arbitrary units) are mean ± SE; n=3 independent experiments. *p<0.05, **p<0.01 vs control group; †p < 0.05, ††p < 0.01 vs PPARα/WY+oleate group. b Levels of phosphoacetyl-CoA carboxylase (pACC) and total ACC (Tot ACC) protein were analysed by immunoblotting at the end of the culture period and normalised to actin. The immunoblot is representative of three independent experiments and quantified bands of pACC are averaged in the accompanying bar graph (c)
FAT favoured lipid load in PPARα-overproducing cells, thereby compensating for increased ACC phosphorylation. Glucose metabolism pathways Preservation of glucose-stimulated insulin secretion by PPARα suggested the maintenance of glucose metabolism in conditions of lipid exposure. Accordingly, we measured glucose oxidation in INS-1E cells cultured for 1 day with oleate and PPARα/ WY as described above. When cells were cultured in normal media in the absence of oleate, PPARα overpro-duction did not modify glucose oxidation (Fig. 5a). As expected, INS-1E cells treated with oleate exhibited a reduced glucose oxidation rate compared with control cells (−33%, p<0.01). PPARα overproduction rescued glucose catabolism to CO2 in cells cultured with oleate (+33%, PPARα/WY+oleate vs oleate group, p<0.05), reaching levels similar to those measured in cells cultured in the absence of the fatty acids.
Catabolism of glucose to the end-product CO2requires efficient coupling between glycolysis and tricarboxylic acid
cycle activity. Pyruvate carboxylase plays a major role in beta cells [32], ensuring an anaplerotic supply of substrates for oxidation into the tricarboxylic acid cycle. Oleate exposure did not modify pyruvate carboxylase levels. On the contrary, in both control and oleate groups, PPARα upregulation increased levels of pyruvate carboxylase (Fig. 5b, c).
Discussion
Several studies have addressed the role of PPARα in insulin-secreting cells in lipid-induced toxicity and dys-function, with the emerging message that PPARα may play a protective role. This consensus lacks any delineation of the molecular mechanisms induced by PPARα activation in cells exposed to fatty acids. Here, we investigated key pathways and genes responsible for metabolism–secretion coupling in insulin-secreting cells treated with the fatty acid oleate and subjected to either up- or downregulation of PPARα. Oleate is not cytotoxic per se as opposed to the saturated fatty acid palmitate, which triggers apoptosis, qualifying its action as lipotoxicity (present study and [16, 33]).Therefore, the unsaturated fatty acid oleate induces beta cell dysfunction, here referred to as lipodysfunction.
Exposure of INS-1E cells to oleate in the culture medium over a 3-day period impaired normal insulin secretion, i.e. it increased basal release and blunted the glucose response. Such oleate-induced dysfunction was worsened by downregulation of PPARα. Among the different subtypes belonging to the PPAR nuclear receptor family, PPARα is relatively abundant in beta cells [34] and is similarly produced in primary rat islet beta cells and insulinoma INS-1 cells [35]. Our results indicate that endogenous PPARα levels exert some protective effects, although it might not be sufficient when there is a pathophysiological concentrations of oleate. Therefore, we tested whether upregulation through ectopic production of PPARα would improve the protection. We measured the early changes (1 day) associated with PPARα overproduc-tion and oleate exposure, leading to chronic modificaoverproduc-tions (3 days) characterised by prolonged impairment of the functions of insulin-secreting cells. PPARα overproduction restored glucose-stimulated insulin secretion in oleate-treated cells, an effect correlating with preservation of glucose metabolism.
Interestingly, previous observations in rat islets described protective effects of bezafibrate that disappeared after 48 h of treatment, an effect referred to as‘excessive stimulation’ by the authors and possibly related to desensitisation [36]. Altogether, these results illustrate the complex equilibrium between PPARα levels, ligand activity and the duration of
a
b
c
PC PC PC Actin 0.4 0.5 0.6 0.7 0.8 0.9 1.0 1.1Control PPARα/WY Oleate PPARα/WY+
oleate
Glucose oxidation rate nmol [mg protein]
–1 h –1 * ** ** 0.0 0.5 1.0 1.5 2.0 2.5 PC protein levels (normalised to β -actin) C P α /W Ol P α /W +Ol C Pα/W Ol Pα/W+Ol
Fig. 5 Glucose oxidation rate and levels of pyruvate carboxylase. INS-1E cells were transduced with empty (control) or Ppar α/Rxrα-expressing (PPARα or Pα) adenoviruses and subsequently cultured for 1 day in the absence or presence of PPARα ligand (30 µmol/l WY14643, WY) and 0.4 mmol/l oleate (Ol) before analysis. a At the end of the culture period, cells were incubated in buffer containing 15 mmol/l [14C] glucose and14CO
2released over 1 h was trapped and quantified. Values normalised to control are mean ± SE of four independent experiments. *p<0.05, **p<0.01 vs oleate control. b After the culture period, pyruvate carboxylase (PC) levels were analysed by immunoblotting of INS-1E mitochondrial extracts and normalised to actin. The immunoblot is representative of three independent experiments and quantified bands are averaged in the accompanying bar graph (c)
fatty acid exposure. Such complexity integrating metabolic pathways and the regulation of gene expression explains some controversial findings [37]. Indeed, the correlation between PPARα production and beta cell function has been found to be either negative [38] or positive [14,15].
The present study reports a protective effect of PPARα on glucose-stimulated ATP levels and glucose oxidation in oleate-treated cells, suggesting a role for the nuclear receptor on glucose metabolism in the presence of fatty acids. This model was substantiated by the observed upregulation of pyruvate carboxylase associated with PPARα overproduction. Pyruvate carboxylase is a key mitochondrial enzyme, driving carbohydrate metabolites into the tricarboxylic acid cycle by catalysing the anapler-otic conversion of pyruvate to oxaloacetate [39]. PPARα overproduction restored pyruvate carboxylase levels that had been reduced by oleate treatment. This is in agreement with previous work showing that rat islets treated with the PPARα activator bezafibrate for 8 h increased both glucose-stimulated insulin secretion and pyruvate carbox-ylase [36,40].
The cataplerotic pathway linking citrate export to long-chain acyl-CoA was investigated through the regulatory phosphorylation state of acetyl-CoA carboxylase. Surpris-ingly, oleate treatment lowered acetyl-CoA carboxylase phosphorylation, thereby favouring de novo fatty acid synthesis. This might compensate for the downregulation of ACC secondary to fatty acid exposure, as reported previously in INS-1 cells [19]. PPARα inhibited the potential activity of acetyl-CoA carboxylase by inducing its phosphorylation, both in normal and oleate-treated cells. A link between PPARα and acetyl-CoA carboxylase has been reported previously in rat hepatocytes, where the PPARα ligand gemfibrozil induces phosphorylation of acetyl-CoA carboxylase via AMP-activated protein kinase (AMPK) [41]. In INS-1 cells, a recent study showed that the PPARα agonist fenofibrate can rescue palmitate-induced lipotoxicity through AMPK, although a direct link between PPARα and acetyl-CoA carboxylase phosphory-lation was not established [42]. The present data substan-tiate the previously suspected link between PPARα and acetyl-CoA carboxylase regulation.
It is interesting to note that PPARα overproduction favoured both triacylglycerol synthesis and β-oxidation, along with increased gene expression of FAT. Of note, these effects on fatty acid transport could secondarily affect glucose and fatty acid metabolism. Taken as a whole, the results show that PPARα promoted overall fatty acid turnover, i.e. transport through the plasma membrane, esterification to triacylglycerols, and consumption via β-oxidation. This model is substantiated by the observed decreased expression of citrate lyase and increased expres-sion of malonyl-CoA decarboxylase in oleate-treated cells
overproducing PPARα. Triacylglycerol synthesis is a way to neutralise cellular fatty acids in a storage form and might have contributed to the protective effects conferred by PPARα overproduction. This is in agreement with studies in non-beta cells [43,44] as well as beta cells [26] showing that promotion of triacylglycerol accumulation protects against lipotoxicity.
The insulin secretory response is altered in cells exposed to oleate. Such beta cell dysfunction induced by fatty acids correlates with impairment of glucose metabolism, which normally controls insulin exocytosis. PPARα activation in oleate-treated INS-1E cells restored glucose-stimulated insulin secretion by promoting glucose metabolic pathways and fatty acid storage in the form of neutral lipids. Therefore, PPARα participates in the balanced control of both glucose and fatty acid homeostasis. This suggests interactions with additional regulators, such as transcription factors, that remain to be identified.
Acknowledgements This study was supported by the Swiss Na-tional Science Foundation (P.M.), the State of Geneva, and the Danish Health Science Research Council (S.M.). For fresh human islets we thank the European Consortium for Islet Transplantation ‘islet for research’ distribution programme sponsored by the Juvenile Diabetes Research Foundation. This study was part of the Geneva Programme for Metabolic Disorders (GeMet).
Duality of interest The authors declare that there is no duality of interest associated with this manuscript.
References
1. Kadowaki T, Hara K, Yamauchi T, Terauchi Y, Tobe K, Nagai R (2003) Molecular mechanism of insulin resistance and obesity. Exp Biol Med (Maywood) 228:1111–1117
2. Kasuga M (2006) Insulin resistance and pancreatic beta cell failure. J Clin Invest 116:1756–1760
3. Unger RH, Zhou YT (2001) Lipotoxicity of beta-cells in obesity and in other causes of fatty acid spillover. Diabetes 50(Suppl 1): S118–S121
4. Maassen JA,’t Hart LM, Janssen GM, Reiling E, Romijn JA, Lemkes HH (2006) Mitochondrial diabetes and its lessons for common type 2 diabetes. Biochem Soc Trans 34:819–823 5. Prentki M, Nolan CJ (2006) Islet beta cell failure in type 2
diabetes. J Clin Invest 116:1802–1812
6. Zhou YP, Grill VE (1994) Long-term exposure of rat pancreatic islets to fatty acids inhibits glucose-induced insulin secretion and biosynthesis through a glucose fatty acid cycle. J Clin Invest 93:870–876
7. Evans RM, Barish GD, Wang YX (2004) PPARs and the complex journey to obesity. Nat Med 10:355–361
8. Leone TC, Weinheimer CJ, Kelly DP (1999) A critical role for the peroxisome proliferator-activated receptor alpha (PPARalpha) in the cellular fasting response: the PPARalpha-null mouse as a model of fatty acid oxidation disorders. Proc Natl Acad Sci U S A 96:7473–7478
9. Patsouris D, Reddy JK, Muller M, Kersten S (2006) Peroxisome proliferator-activated receptor alpha mediates the effects of
high-fat diet on hepatic gene expression. Endocrinology 147:1508– 1516
10. Chakravarthy MV, Pan Z, Zhu Y et al (2005)‘New’ hepatic fat activates PPARalpha to maintain glucose, lipid, and cholesterol homeostasis. Cell Metab 1:309–322
11. Kersten S, Seydoux J, Peters JM, Gonzalez FJ, Desvergne B, Wahli W (1999) Peroxisome proliferator-activated receptor alpha mediates the adaptive response to fasting. J Clin Invest 103:1489– 1498
12. Sugden MC, Holness MJ (2008) Role of nuclear receptors in the modulation of insulin secretion in lipid-induced insulin resistance. Biochem Soc Trans 36:891–900
13. Gremlich S, Nolan C, Roduit R et al (2005) Pancreatic islet adaptation to fasting is dependent on peroxisome proliferator-activated receptor alpha transcriptional up-regulation of fatty acid oxidation. Endocrinology 146:375–382
14. Zhou YT, Shimabukuro M, Wang MY et al (1998) Role of peroxisome proliferator-activated receptor alpha in disease of pancreatic beta cells. Proc Natl Acad Sci U S A 95:8898–8903 15. Ravnskjaer K, Boergesen M, Rubi B et al (2005) Peroxisome
proliferator-activated receptor alpha (PPARalpha) potentiates, whereas PPARgamma attenuates, glucostimulated insulin se-cretion in pancreatic beta-cells. Endocrinology 146:3266–3276 16. El-Assaad W, Buteau J, Peyot ML et al (2003) Saturated fatty
acids synergize with elevated glucose to cause pancreatic beta-cell death. Endocrinology 144:4154–4163
17. Roche E, Buteau J, Aniento I, Reig JA, Soria B, Prentki M (1999) Palmitate and oleate induce the immediate-early response genes c-fos and nur-77 in the pancreatic beta-cell line INS-1. Diabetes 48:2007–2014
18. Maedler K, Spinas GA, Dyntar D, Moritz W, Kaiser N, Donath MY (2001) Distinct effects of saturated and monounsaturated fatty acids on beta-cell turnover and function. Diabetes 50:69–76 19. Brun T, Assimacopoulos-Jeannet F, Corkey BE, Prentki M (1997)
Long-chain fatty acids inhibit acetyl-CoA carboxylase gene expression in the pancreatic beta-cell line INS-1. Diabetes 46:393–400
20. Frigerio F, Chaffard G, Berwaer M, Maechler P (2006) The antiepileptic drug topiramate preserves metabolism-secretion coupling in insulin secreting cells chronically exposed to the fatty acid oleate. Biochem Pharmacol 72:965–973
21. Lalloyer F, Vandewalle B, Percevault F et al (2006) Peroxisome proliferator-activated receptor alpha improves pancreatic adapta-tion to insulin resistance in obese mice and reduces lipotoxicity in human islets. Diabetes 55:1605–1613
22. Bergeron R, Yao J, Woods JW et al (2006) Peroxisome proliferator-activated receptor (PPAR)-alpha agonism prevents the onset of type 2 diabetes in Zucker diabetic fatty rats: a comparison with PPAR gamma agonism. Endocrinology 147:4252–4262
23. Holness MJ, Smith ND, Greenwood GK, Sugden MC (2003) Acute (24 h) activation of peroxisome proliferator-activated receptor-alpha (PPARalpha) reverses high-fat feeding-induced insulin hypersecretion in vivo and in perifused pancreatic islets. J Endocrinol 177:197–205
24. Holness MJ, Smith ND, Greenwood GK, Sugden MC (2007) PPARalpha activation reverses adverse effects induced by high-saturated-fat feeding on pancreatic beta-cell function in late pregnancy. Am J Physiol Endocrinol Metab 292:E1087–E1094 25. Merglen A, Theander S, Rubi B, Chaffard G, Wollheim CB,
Maechler P (2004) Glucose sensitivity and metabolism–secretion coupling studied during two-year continuous culture in INS-1E insulinoma cells. Endocrinology 145:667–678
26. Cnop M, Hannaert JC, Hoorens A, Eizirik DL, Pipeleers DG (2001) Inverse relationship between cytotoxicity of free fatty acids in pancreatic islet cells and cellular triglyceride accumulation. Diabetes 50:1771–1777
27. Spector AA, Fletcher JE, Ashbrook JD (1971) Analysis of long-chain free fatty acid binding to bovine serum albumin by determination of stepwise equilibrium constants. Biochemistry 10:3229–3232
28. Richieri GV, Kleinfeld AM (1995) Unbound free fatty acid levels in human serum. J Lipid Res 36:229–240
29. Folch J, Lees M, Sloane Stanley GH (1957) A simple method for the isolation and purification of total lipids from animal tissues. J Biol Chem 226:497–509
30. de Andrade PB, Rubi B, Frigerio F, van den Ouweland JM, Maassen JA, Maechler P (2006) Diabetes-associated mitochon-drial DNA mutation A3243G impairs cellular metabolic pathways necessary for beta cell function. Diabetologia 49:1816–1826 31. Praul CA, Brubaker KD, Leach RM, Gay CV (1998) Detection of
endogenous biotin-containing proteins in bone and cartilage cells with streptavidin systems. Biochem Biophys Res Commun 247:312–314
32. Schuit F, de Vos A, Farfari S et al (1997) Metabolic fate of glucose in purified islet cells. Glucose-regulated anaplerosis in beta cells. J Biol Chem 272:18572–18579
33. Maedler K, Oberholzer J, Bucher P, Spinas GA, Donath MY (2003) Monounsaturated fatty acids prevent the deleterious effects of palmitate and high glucose on human pancreatic beta-cell turnover and function. Diabetes 52:726–733
34. Laybutt DR, Sharma A, Sgroi DC, Gaudet J, Bonner-Weir S, Weir GC (2002) Genetic regulation of metabolic pathways in beta-cells disrupted by hyperglycemia. J Biol Chem 277:10912–10921 35. Dillon JS, Yaney GC, Zhou Y et al (2000)
Dehydroepiandroster-one sulfate and beta-cell function: enhanced glucose-induced insulin secretion and altered gene expression in rodent pancreatic beta-cells. Diabetes 49:2012–2020
36. Yoshikawa H, Tajiri Y, Sako Y, Hashimoto T, Umeda F, Nawata H (2001) Effects of bezafibrate on beta-cell function of rat pancreatic islets. Eur J Pharmacol 426:201–206
37. Terauchi Y, Kadowaki T (2005) Peroxisome proliferator-activated receptors and insulin secretion. Endocrinology 146:3263–3265 38. Tordjman K, Standley KN, Bernal-Mizrachi C et al (2002)
PPARalpha suppresses insulin secretion and induces UCP2 in insulinoma cells. J Lipid Res 43:936–943
39. Renner ED, Bernlohr RW (1972) Characterization and regulation of pyruvate carboxylase of Bacillus licheniformis. J Bacteriol 109:764–772
40. Satapati S, He T, Inagaki T et al (2008) Partial resistance to peroxisome proliferator-activated receptor-alpha agonists in ZDF rats is associated with defective hepatic mitochondrial metabo-lism. Diabetes 57:2012–2021
41. Munday MR, Hemingway CJ (1999) The regulation of acetyl-CoA carboxylase—a potential target for the action of hypolipi-demic agents. Adv Enzyme Regul 39:205–234
42. Sun Y, Ren M, Gao GQ et al (2008) Chronic palmitate exposure inhibits AMPKalpha and decreases glucose-stimulated insulin secretion from beta-cells: modulation by fenofibrate. Acta Pharmacol Sin 29:443–450
43. Listenberger LL, Han X, Lewis SE et al (2003) Triglyceride accumulation protects against fatty acid-induced lipotoxicity. Proc Natl Acad Sci U S A 100:3077–3082
44. Coll T, Eyre E, Rodriguez-Calvo R et al (2008) Oleate reverses palmitate-induced insulin resistance and inflammation in skeletal muscle cells. J Biol Chem 283:11107–11116