HAL Id: hal-01427205
https://hal.sorbonne-universite.fr/hal-01427205
Submitted on 5 Jan 2017HAL is a multi-disciplinary open access archive for the deposit and dissemination of sci-entific research documents, whether they are pub-lished or not. The documents may come from teaching and research institutions in France or abroad, or from public or private research centers.
L’archive ouverte pluridisciplinaire HAL, est destinée au dépôt et à la diffusion de documents scientifiques de niveau recherche, publiés ou non, émanant des établissements d’enseignement et de recherche français ou étrangers, des laboratoires publics ou privés.
Nicolas Sisourat, Sévan Kazandjian, Tsveta Miteva
To cite this version:
Nicolas Sisourat, Sévan Kazandjian, Tsveta Miteva. Probing Conformers of Benzene Dimer with Intermolecular Coulombic Decay Spectroscopy. Journal of Physical Chemistry A, American Chemical Society, 2016, �10.1021/acs.jpca.6b09501�. �hal-01427205�
Probing Conformers of Benzene Dimer with
Intermolecular Coulombic Decay Spectroscopy
Nicolas Sisourat,
∗Sévan Kazandjian, and Tsveta Miteva
Sorbonne Universités, UPMC Univ Paris 06, CNRS, Laboratoire de Chimie Physique Matière et Rayonnement, F-75005, Paris, France
E-mail: Nicolas.Sisourat@upmc.fr
∗To whom correspondence should be addressed
3 4 5 6 7 8 9 10 11 12 13 14 15 16 17 18 19 20 21 22 23 24 25 26 27 28 29 30 31 32 33 34 35 36 37 38 39 40 41 42 43 44 45 46 47 48 49 50 51 52 53 54 55 56 57 58 59
Abstract
Benzene dimer is a prototype to study intermolecular interactions between aromatic systems. Owing to the weak interactions between the molecules within the dimer, several conformational geometries are nearly isoenergetic and thus coexist even at low temperatures. Furthermore, standard spectroscopies are unable to distinguish between them. In this work, we study the electronic relaxation processes following inner-valence ionization of benzene and the lowest conformers of benzene dimer. We show that the kinetic energy distributions of the secondary electrons emitted via two autoionization mechanisms, namely the Auger and the Intermolecular Coulombic Decay (ICD) effects, provide a means to probe the conformers of benzene dimer. The proposed spectroscopy opens the way to a better characterization of weakly-bound molecular clusters.
3 4 5 6 7 8 9 10 11 12 13 14 15 16 17 18 19 20 21 22 23 24 25 26 27 28 29 30 31 32 33 34 35 36 37 38 39 40 41 42 43 44 45 46 47 48 49 50 51 52 53 54 55 56 57
Introduction
Aromatic π-π interactions are ubiquitous in chemistry, biology and engineering: these non-covalent interactions play a vital role in molecular recognition processes,1 in the tertiary and
quaternary structures of proteins and DNA2,3 as well as in organic crystal growth.4
Benzene dimer is the simplest prototype to study intermolecular interactions between aromatic systems. As such it has been intensively investigated for decades (see5 for a recent
review). Owing to the small binding energy between the two molecules (≈ 2.8 kcal/mol, i.e. 120 meV), the dimer may exist in different conformational geometries, even at low temper-atures. An accurate description of such large weakly-bound systems is a challenging task for quantum chemists and advanced ab initio methods must be employed to provide reliable energies.6–8 Theory predicts three low and nearly isoenergetic conformers, namely the
T-shaped (T), the tilted T-T-shaped (TT) and the parallel-displaced (PD) geometries (see Fig. 1). Among the other conformers lying above these lowest configurations the sandwich (S) geometry has been widely investigated since it represents a model for stacked structures. The two T-shaped conformers have been observed experimentally using microwave spectroscopy.9
However, the other conformers are more challenging to identify because they lack permanent dipole moments. Furthermore, photoelectron and photoion spectroscopies, which are power-ful analytical tools, cannot resolve the different conformers owing to the small chemical shift between the latter.10–12
In this work, we propose a spectroscopic method based on the Intermolecular Coulombic Decay (ICD) effect13–16 which can help to identify the different conformers. ICD is an
efficient and ultrafast energy transfer process: after inner-valence ionization of a molecule embedded in a chemical environment this molecular ion transfers its excess energy to a neighboring molecule which is then ionized. The energy transfer can take place over huge distances: for example, in the giant helium dimer,17,18 it was demonstrated that energy
transfer can be achieved via ICD over up to 14 Å. Furthermore, the timescale for the energy transfer and the kinetic energy distribution of the secondary electron (so-called ICD electron)
3 4 5 6 7 8 9 10 11 12 13 14 15 16 17 18 19 20 21 22 23 24 25 26 27 28 29 30 31 32 33 34 35 36 37 38 39 40 41 42 43 44 45 46 47 48 49 50 51 52 53 54 55 56 57 58 59
3 4 5 6 7 8 9 10 11 12 13 14 15 16 17 18 19 20 21 22 23 24 25 26 27 28 29 30 31 32 33 34 35 36 37 38 39 40 41 42 43 44 45 46 47 48 49 50 51 52 53 54 55 56 57
than 100 fs which rules out the possibility for molecules in each conformer to rotate before emitting the secondary electron. The electron-electron coincidence spectra reflect therefore the initial geometry of the dimers.
Computational Methods
The ground state equilibrium geometry of the isolated benzene molecule was obtained by energy minimization at the Moller-Plesset 2nd order (MP2) level using the MOLPRO
pack-age.20,21The geometries of the conformers of the benzene dimer considered in this work were
taken from Ref.22 (see Fig. 1).
The single (IP) and double (DIP) ionization potentials were computed with Algebraic Di-agrammatic Construction (ADC) methods (see23 for a recent review). The single ionization
potentials for the five systems were computed using the non-Dyson extended second-order ADC(2)x scheme for the one-particle Green’s function.24,25Such a method provides accurate
spectroscopic amplitudes and binding energies for outer-valence and inner-valence ionized states of fairly large systems. The ADC(2) method for the two-particle propagator26–28 was
used to compute the double ionization potentials of all species. ADC(2) has been successfully used for the study of dense double ionization spectra of molecules and clusters (see27 and
references therein).
The Hartree-Fock energies, molecular orbitals and the integrals needed for the ADC calculations were computed with a split-valence triple-zeta basis set29 using the
GAMESS-US package.30 Convergence of the results with respect to the basis set was checked.
The kinetic energy distributions of the photoelectrons coming from inner-valence ion-ization of a monomer reported in coincidence with that of the secondary electrons were estimated with the following model:
- A two-hole population analysis27 is used to determine the type of decay. ICD final
states are characterized by the presence of one hole on each molecule while after the Auger
3 4 5 6 7 8 9 10 11 12 13 14 15 16 17 18 19 20 21 22 23 24 25 26 27 28 29 30 31 32 33 34 35 36 37 38 39 40 41 42 43 44 45 46 47 48 49 50 51 52 53 54 55 56 57 58 59
decay the two holes are localized on the same molecule which is initially ionized. Electron-Transfer-Mediated-Decay (ETMD)31,32 is another decay process in which one electron from
the neighboring benzene molecule is transferred to the ionized monomer and the excess energy is used to eject a second electron. In this case, the two holes in the final states are therefore localized on the molecule which is not initially ionized.
- For each singly-ionized state computed with the ADC method the energy distribution of the secondary electron (if any decay channels are open) is given by the difference between the energy of the singly-ionized states and the energies of the accessible doubly-ionized states.
- We assume that the branching ratio for Auger decay (when this channel is open) is ten times larger than ICD. This approximation is justified because Auger decaytime is usually below 10 fs while ICD takes place within 100 fs.33 ETMD is completely neglected since it is
efficient only at short intermolecular distances.31 Furthermore, for the Auger channels the
singlet final states contribute more to the Auger spectra than the triplet ones34,35 whereas
in ICD the triplet states contribute three times more than the singlet states.36 Thus we
multiply by 3 the corresponding contributions. Finally, for a given decay process (Auger or ICD) and a given spin symmetry all weights are set equal.
- Denoting the weight for a given channel (decaying state i and final state j) as ωi,j, the
spectroscopic amplitudes as pi and the binding energy and the secondary electron energy as
BE and E respectively, the electron-electron concidence spectrum is given by
σ(BE, E) = NIP X i=1 NXDIP j=1 piωi,je−α[(BE−BEi) 2+(E−Ej)2] (1) where NIP and NDIP are the number of ADC singly- and doubly-ionized states, respectively.
We assume that each peak has a Gaussian shape, with a full width at half maximum set to 0.5 eV, in order to approximately include vibrational broadening. We use binding energy instead of photoelectron kinetic energy since the former does not depend on the photon energy. 3 4 5 6 7 8 9 10 11 12 13 14 15 16 17 18 19 20 21 22 23 24 25 26 27 28 29 30 31 32 33 34 35 36 37 38 39 40 41 42 43 44 45 46 47 48 49 50 51 52 53 54 55 56 57
Results and Discussion
Isolated benzene molecule
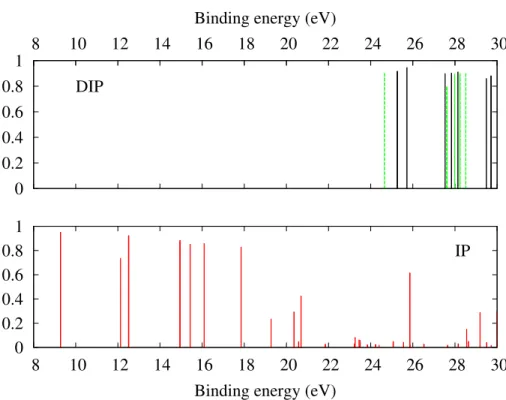
The kinetic energy distributions of the photoelectron are obtained directly from the sin-gle ionization potentials, whereas the kinetic energy distributions of the secondary electron can be estimated from the IP and the DIP (see section Computational Methods). We first discuss the IP and DIP of isolated benzene. The experimental and theoretical valence pho-toelectron spectra of isolated benzene molecule are known (see37,38 and references therein).
The spectrum of the benzene dication has also been measured and computed (see35,39 and
references therein). These previous data are used to benchmark our calculations (see Table I). The computed single and double ionization potentials of isolated benzene are shown in Fig. 2. The spectra were shifted such that the lowest line of each spectrum matches the experimental lines: we used +0.48 eV for the single ionization potentials, −0.20 and +0.40 eV for the singlet and triplet double ionization potentials, respectively. The relatively small values of these shifts demonstrate the accuracy of the methods used in this work.
Table 1: Lowest ADC single and double ionization potentials (in eV) of isolated benzene molecule compared to experimental values. The ionization potentials shown in Figs. 2-5 are shifted such that these lowest ADC ionization potentials match the experimental ones.
IP (ADC(2)x) IP (Expt.)38 DIP (ADC(2)) DIP (Expt.)39
- - Triplet Singlet Triplet Singlet Benzene 8.77 9.25 24.25 25.45 24.65 25.25
The ground state equilibrium geometry of benzene is planar with D6h symmetry and
electronic valence configuration (2a1g)2 (2e1u)4 (2e2g)4 (3a1g)2 (2b1u)2 (1b2u)2 (3e1u)4 (1a2u)2
(3e2g)4 (1e1g)4. The lowest single ionization potentials correspond to the ionization of the
outer valence electrons. The inner-valence region is located above 18-20 eV where many lines with small spectroscopic amplitudes are seen. This is characteristic of the breakdown of the molecular orbital picture40reflecting strong electronic correlation: in this energy range,
3 4 5 6 7 8 9 10 11 12 13 14 15 16 17 18 19 20 21 22 23 24 25 26 27 28 29 30 31 32 33 34 35 36 37 38 39 40 41 42 43 44 45 46 47 48 49 50 51 52 53 54 55 56 57 58 59
the singly-ionized states cannot be described as ionization from a single molecular orbital. Instead electronic configurations corresponding to ionization of one electron and excitation of another electron into an unoccupied orbital contribute significantly to each electronic state. However, the fairly intense peaks just below 26 eV may still be approximately associated with the ionization of (2e1u) orbitals which are mostly built on carbon 2s atomic orbitals.
As shown below, the inner-valence region is around the double ionization threshold of the molecule and is of particular interest for this study.
The lowest DIPs appear at 24.65 eV for the triplet and 25.25 eV for the singlet states. These peaks correspond to double ionization from the highest occupied molecular orbital (HOMO) (1e1g). Higher energy peaks are associated with ionization of an electron from
the HOMO and of successively deeper outer-valence electrons. Few lines are seen at binding energy below 26 eV. Higher-lying states are then grouped around 28 eV and then 30 eV. Each line in the spectra corresponds to the energy threshold for which the Auger decay channels open.
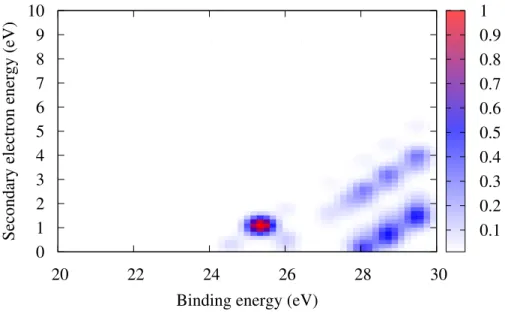
Using the IP and DIP as well as the model presented in section Computational Methods, we computed the binding energy-Auger electron energy coincidence spectrum, which is shown in Fig 3. The Auger decay channel is energetically closed for the lowest states of the singly-ionized molecule. Therefore, the first band in the coincidence spectrum appears only at around 26 eV binding energy. The corresponding Auger electron energy distribution is below 1 eV since the first inner-valence ionized states lie just above the double ionization threshold. For higher binding energies, more Auger channels open which is seen in the broader energy distribution of the secondary electron.
Conformers of benzene dimer
We now consider the IP of the four conformers of benzene dimer (see lower panels of Fig. 4). Only the inner-valence region is shown. Compared to the spectrum of the isolated molecule, the binding energy spectra are richer for all conformers. Furthermore, the peaks are
red-3 4 5 6 7 8 9 10 11 12 13 14 15 16 17 18 19 20 21 22 23 24 25 26 27 28 29 30 31 32 33 34 35 36 37 38 39 40 41 42 43 44 45 46 47 48 49 50 51 52 53 54 55 56 57
0 0.2 0.4 0.6 0.8 1 8 10 12 14 16 18 20 22 24 26 28 30 Binding energy (eV)
IP 0 0.2 0.4 0.6 0.8 1 8 10 12 14 16 18 20 22 24 26 28 30 Binding energy (eV)
DIP
Figure 2: Single (lower panel) and double ionization (upper panel) potentials of isolated benzene molecule. Singlet and triplet doubly-ionized states are indicated as black and green lines, respectively.
shifted due to the polarization effect of the neighboring molecule. The most intense peaks corresponding to the ionization from the (2e1u) orbitals are then located around 25 eV.
The difference in the spectra between the conformers is rather small such that the most intense peaks of the different conformers strongly overlap. However, it should be noted that for the sandwich geometry numerous states with small spectroscopic amplitudes are grouped together at around 22 eV while for the other geometries the states are more evenly distributed at higher energies. As discussed below, these peaks are characterisic of the sandwich conformer and may be used to spectroscopically distinguish it from the other conformers.
The DIP of the dimers, shown in the upper panels of Fig. 4, are even more different from that of the isolated molecule. In particular, several states appear around 20 eV which correspond to single ionization of both molecules within the dimer and are thus attributed to ICD final states. Furthermore, the double ionization potentials are more sensitive to the
3 4 5 6 7 8 9 10 11 12 13 14 15 16 17 18 19 20 21 22 23 24 25 26 27 28 29 30 31 32 33 34 35 36 37 38 39 40 41 42 43 44 45 46 47 48 49 50 51 52 53 54 55 56 57 58 59
’noshift_spect2d_benzene_tot.txt’
20 22 24 26 28 30
Binding energy (eV) 0 1 2 3 4 5 6 7 8 9 10
Secondary electron energy (eV) 0.1
0.2 0.3 0.4 0.5 0.6 0.7 0.8 0.9 1
Figure 3: Electron-electron coincidence spectrum of isolated benzene molecule. geometry of the conformers than the single ionization potentials. Indeed, the lowest peaks of the T-shaped and TT-shaped conformers are red-shifted by +0.3 eV with respect to that of the PD and sandwich dimers. This energy difference can be rationalized with a simple electrostatic model: assuming the charge on each molecule is evenly distributed between the carbon atoms, the Coulombic repulsion energies are around 2.9 eV for the T-shaped and TT-shaped dimers and 3.4 eV for the PD and sandwich geometries. Another strong difference between the two kinds of conformers is seen in the energy region between 25 and 26 eV: there are no states for the PD and sandwich conformers while the states of the T-shaped and TT-shaped dimers cover this region. However, the DIP of the two T-shaped conformers on one hand and that of the PD and sandwich geometries on the other hand are similar.
The electron-electron coincidence spectra of all geometries are shown in Fig. 5. Compared to the isolated molecule, the spectra exhibit an additional diagonal structure (indicated by a dashed-dotted line) which corresponds to ICD channels. The lower right parts comprise peaks corresponding to both Auger and ICD channels. The spectra show characteristic
3 4 5 6 7 8 9 10 11 12 13 14 15 16 17 18 19 20 21 22 23 24 25 26 27 28 29 30 31 32 33 34 35 36 37 38 39 40 41 42 43 44 45 46 47 48 49 50 51 52 53 54 55 56 57
peaks of each species. First, the upper diagonal allows to distinguish between the isolated molecule and the dimers. Furthermore, this line is shifted by +0.3 eV for the T-shaped and TT-shaped conformers with respect to the PD and sandwich conformers, as expected from the DIP discussed above. Because of this energy shift, a rather intense ICD peak is seen at BE = 20 − 21 eV and E = 0 − 1 eV for the T-shaped and TT-shaped conformers while this peak is three times weaker for the PD and even absent for the sandwich conformer. An appearance of a peak in this energy region can thus be unambiguously assigned to the former conformers. Another strong signature of the T-shaped and TT-shaped conformers is seen in the Auger peak at BE = 25 − 26 eV and E = 0 − 1 eV (indicated by a red dashed arrow) which is only present for these two geometries. Finally, the two parallel geometries can also be separated since the spectrum for the sandwich geometry exhibits an intense peak at around BE = 22 eV and E = 2 eV (indicated by a black arrow) which is absent in the PD spectrum. The spectra of the T-shaped and TT-shaped dimers are however too similar to distinguish both conformers.
Conclusions
In conclusion, we have investigated the relaxation pathways after inner-valence ionization of the benzene molecule and the lowest conformers of the benzene dimer. For the molecule, Auger decay opens for states of binding energy above 24.65 eV while for the dimers another decay channel (ICD) opens already at energies above 20 eV. Despite the weak interactions between the molecules and the small energy differences between the different conformers, the kinetic energy distributions of the secondary electrons emitted during the electronic decay processes are characteristic of the conformational isomers of benzene dimer. It should be noted that the differences in the coincidence spectra of the conformers can readily be used to experimentally identify the structures since current electron spectrometers and light sources allow to achieve energy resolution below these differences (see for example41,42 and
3 4 5 6 7 8 9 10 11 12 13 14 15 16 17 18 19 20 21 22 23 24 25 26 27 28 29 30 31 32 33 34 35 36 37 38 39 40 41 42 43 44 45 46 47 48 49 50 51 52 53 54 55 56 57 58 59
3 4 5 6 7 8 9 10 11 12 13 14 15 16 17 18 19 20 21 22 23 24 25 26 27 28 29 30 31 32 33 34 35 36 37 38 39 40 41 42 43 44 45 46 47 48 49 50 51 52 53 54 55 56 57
3 4 5 6 7 8 9 10 11 12 13 14 15 16 17 18 19 20 21 22 23 24 25 26 27 28 29 30 31 32 33 34 35 36 37 38 39 40 41 42 43 44 45 46 47 48 49 50 51 52 53 54 55 56 57 58 59
(5) Gadre, S. R.; Yeole, S. D.; Sahu, N. Quantum Chemical Investigations on Molecular Clusters. Chem. Rev. 2014, 114, 12132–12173.
(6) Sinnokrot, M. O.; Sherrill, C. D. Highly Accurate Coupled Cluster Potential Energy Curves for the Benzene Dimer: Sandwich, T-Shaped, and Parallel-Displaced Configu-rations. J. Phys. Chem. A 2004, 108, 10200–10207.
(7) Park, Y. C.; Lee, J. S. Accurate ab Initio Binding Energies of the Benzene Dimer. J. Phys. Chem. A 2006, 110, 5091–5095.
(8) Miliordos, E.; Aprà, E.; Xantheas, S. S. Benchmark Theoretical Study of the π − π Binding Energy in the Benzene Dimer. J. Phys. Chem. A 2014, 118, 7568–7578. (9) Arunan, E.; Gutowsky, H. S. The Rotational Spectrum, Structure and Dynamics of a
Benzene Dimer. J. Chem. Phys. 1993, 98, 4294–4296.
(10) Baumgartel, H.; Brutschy, B.; Ruhl, E. Photoionization of Molecular Aggregates. Phys. Scr. 1990, 1990, 78.
(11) Bradeanu, I. L.; Flesch, R.; Kosugi, N.; Pavlychev, A. A.; Ruhl, E. C 1s → π* Excitation in Variable Size Benzene Clusters. Phys. Chem. Chem. Phys. 2006, 8, 1906–1913. (12) Flesch, R.; Serdaroglu, E.; Blobner, F.; Feulner, P.; Brykalova, X. O.; Pavlychev, A. A.;
Kosugi, N.; Ruhl, E. Gas-to-solid Shift of C 1s-excited Benzene. Phys. Chem. Chem. Phys. 2012, 14, 9397–9402.
(13) Cederbaum, L. S.; Zobeley, J.; Tarantelli, F. Giant Intermolecular Decay and Fragmen-tation of Clusters. Phys. Rev. Lett. 1997, 79, 4778–4781.
(14) Marburger, S.; Kugeler, O.; Hergenhahn, U.; Möller, T. Experimental Evidence for Interatomic Coulombic Decay in Ne Clusters. Phys. Rev. Lett. 2003, 90, 203401.
3 4 5 6 7 8 9 10 11 12 13 14 15 16 17 18 19 20 21 22 23 24 25 26 27 28 29 30 31 32 33 34 35 36 37 38 39 40 41 42 43 44 45 46 47 48 49 50 51 52 53 54 55 56 57
(15) Jahnke, T.; Czasch, A.; Schöffler, M. S.; Schössler, S.; Knapp, A.; Käsz, M.; Titze, J.; Wimmer, C.; Kreidi, K.; Grisenti, R. E. et al. Experimental Observation of Interatomic Coulombic Decay in Neon Dimers. Phys. Rev. Lett. 2004, 93, 163401.
(16) See http://www.pci.uni-heidelberg.de/tc/usr/icd/ICD.refbase.html for the complete list of ICD papers.
(17) Sisourat, N.; Kryzhevoi, N. V.; Kolorenč, P.; Scheit, S.; Jahnke, T.; Cederbaum, L. S. Ultralong-range Energy Transfer by Interatomic Coulombic Decay in an Extreme Quan-tum System. Nat. Phys. 2010, 6, 508–511.
(18) Havermeier, T.; Jahnke, T.; Kreidi, K.; Wallauer, R.; Voss, S.; Schöffler, M.; Schössler, S.; Foucar, L.; Neumann, N.; Titze, J. et al. Interatomic Coulombic Decay following Photoionization of the Helium Dimer: Observation of Vibrational Structure. Phys. Rev. Lett. 2010, 104, 133401.
(19) Fasshauer, E.; Förstel, M.; Pallmann, S.; Pernpointner, M.; Hergenhahn, U. Using ICD for Structural Analysis of Clusters: a Case Study on NeAr clusters. New J. Phys. 2014, 16, 103026.
(20) Werner, H.-J.; Knowles, P. J.; Knizia, G.; Manby, F. R.; Schütz, M. Molpro: a General-purpose Quantum Chemistry Program Package. WIREs Comput. Mol. Sci. 2012, 2, 242–253.
(21) Werner, H.-J.; Knowles, P. J.; Knizia, G.; Manby, F. R.; Schütz, M.; Celani, P.; Györffy, W.; Kats, D.; Korona, T.; Lindh, R. et al. MOLPRO, version 2015.1, a package of ab initio programs.
(22) Pitoňák, M.; Neogrády, P.; Řezáč, J.; Jurečka, P.; Urban, M.; Hobza, P. Benzene Dimer: High-Level Wave Function and Density Functional Theory Calculations. J. Chem. Th. Comput. 2008, 4, 1829–1834. 3 4 5 6 7 8 9 10 11 12 13 14 15 16 17 18 19 20 21 22 23 24 25 26 27 28 29 30 31 32 33 34 35 36 37 38 39 40 41 42 43 44 45 46 47 48 49 50 51 52 53 54 55 56 57 58 59
(23) Danovich, D. Green’s Function Methods for Calculating Ionization Potentials, Electron Affinities, and Excitation Energies. WIREs Comput. Mol. Sci. 2011, 1, 377-387. (24) Schirmer, J.; Trofimov, A. B.; Stelter, G. A Non-Dyson Third-order Approximation
Scheme for the Electron Propagator. J. Chem. Phys. 1998, 109, 4734–4744.
(25) Trofimov, A. B.; Schirmer, J. Molecular Ionization Energies and Ground- and Ionic-state Properties using a Non-Dyson Electron Propagator Approach. J. Chem. Phys. 2005, 123, 144115.
(26) Schirmer, J.; Barth, A. Higher-order Approximations for the Particle-Particle Propa-gator. Z. Phys. A 1984, 317, 267–279.
(27) Tarantelli, F. The Calculation of Molecular Double Ionization Spectra by Green’s Func-tions. Chem. Phys. 2006, 329, 11–21, Electron Correlation and Multimode Dynamics in Molecules (in honour of Lorenz S. Cederbaum).
(28) Velkov, Y.; Miteva, T.; Sisourat, N.; Schirmer, J. Intermediate State Representation Approach to Physical Properties of Dicationic States. J. Chem. Phys. 2011, 135, 154113. (29) Krishnan, R.; Binkley, J. S.; Seeger, R.; Pople, J. A. Self-consistent Molecular Orbital Methods. XX. A Basis Set for Correlated Wave Functions. J. Chem. Phys. 1980, 72, 650–654.
(30) Schmidt, M. W.; Baldridge, K. K.; Boatz, J. A.; Elbert, S. T.; Gordon, M. S.; Jensen, J. H.; Koseki, S.; Matsunaga, N.; Nguyen, K. A.; Su, S. et al. General Atomic and Molecular Electronic Structure System. J. Comput. Chem. 1993, 14, 1347–1363. (31) Zobeley, J.; Santra, R.; Cederbaum, L. S. Electronic Decay in Weakly Bound
Hetero-clusters: Energy Transfer versus Electron Transfer. J. Chem. Phys. 2001, 115, 5076– 5088. 3 4 5 6 7 8 9 10 11 12 13 14 15 16 17 18 19 20 21 22 23 24 25 26 27 28 29 30 31 32 33 34 35 36 37 38 39 40 41 42 43 44 45 46 47 48 49 50 51 52 53 54 55 56 57
(32) Sakai, K.; Stoychev, S.; Ouchi, T.; Higuchi, I.; Schöffler, M.; Mazza, T.; Fukuzawa, H.; Nagaya, K.; Yao, M.; Tamenori, Y. et al. Electron-Transfer-Mediated Decay and Inter-atomic Coulombic Decay from the Triply Ionized States in Argon Dimers. Phys. Rev. Lett. 2011, 106, 033401.
(33) Santra, R.; Cederbaum, L. S.; Meyer, H.-D. Electronic Decay of Molecular Clusters: Non-Stationary States Computed by Standard Quantum Chemistry Methods. Chem. Phys. Lett. 1999, 303, 413–419.
(34) Ågren, H. On the Interpretation of Molecular Valence Auger Spectra. J. Chem. Phys. 1981, 75, 1267–1283.
(35) Tarantelli, F.; Sgamellotti, A.; Cederbaum, L. S.; Schirmer, J. Theoretical Investigation of Many Dicationic States and the Auger Spectrum of Benzene. J. Chem. Phys. 1987, 86, 2201–2206.
(36) Averbukh, V.; Müller, I. B.; Cederbaum, L. S. Mechanism of Interatomic Coulombic Decay in Clusters. Phys. Rev. Lett. 2004, 93, 263002.
(37) Baltzer, P.; Karlsson, L.; Wannberg, B.; Ohrwall, G.; Holland, D.; MacDonald, M.; Hayes, M.; von Niessen, W. An Experimental and Theoretical Study of the Valence Shell Photoelectron Spectrum of the Benzene Molecule. Chem. Phys. 1997, 224, 95– 119.
(38) Yencha, A. J.; Hall, R. I.; Avaldi, L.; Dawber, G.; McConkey, A. G.; MacDonald, M. A.; King, G. C. Threshold Photoelectron Spectroscopy of Benzene up to 26.5 eV. Canad. J. Chem. 2004, 82, 1061–1066.
(39) Eland, J. H. Spectra of the Dications of Benzene, Naphthalene and Azulene. Chem. Phys. 2008, 345, 82–86. 3 4 5 6 7 8 9 10 11 12 13 14 15 16 17 18 19 20 21 22 23 24 25 26 27 28 29 30 31 32 33 34 35 36 37 38 39 40 41 42 43 44 45 46 47 48 49 50 51 52 53 54 55 56 57 58 59
3 4 5 6 7 8 9 10 11 12 13 14 15 16 17 18 19 20 21 22 23 24 25 26 27 28 29 30 31 32 33 34 35 36 37 38 39 40 41 42 43 44 45 46 47 48 49 50 51 52 53 54 55 56 57
ACS Paragon Plus Environment 3 4 5 6 7 8 9 10 11 12 13 14 15 16 17 18 19 20 21 22 23 24 25 26 27 28 29 30 31 32 33 34 35 36 37 38 39 40 41 42 43 44 45 46 47 48 49 50 51 52 53 54 55 56 57
0 0.2 0.4 0.6 0.8 1 8 10 12 14 16 18 20 22 24 26 28 30 Binding energy (eV)
IP 0
0.2 0.4 0.6
ACS Paragon Plus Environment
2 3 4 5 6 7 8 9 10 11 12 13 14 15 16 17 18 19 20 21 22 23 24 25 26 27 28 29 30 31 32 33 34 35 36 37 38 39 40 41 42 43 44 45 46 47 48 49 50 51 52 53 54 55 56
’noshift_spect2d_benzene_tot.txt’
20 22 24 26 28 30
Binding energy (eV) 0 1 2 3 4 5 6 7 8
Secondary electron energy (eV) 0.1
0.2 0.3 0.4 0.5 0.6 0.7 0.8
ACS Paragon Plus Environment
3 4 5 6 7 8 9 10 11 12 13 14 15 16 17 18 19 20 21 22 23 24 25 26 27 28 29 30 31 32 33 34 35 36 37 38 39 40 41 42 43 44 45 46 47 48 49 50 51 52 53 54 55 56 57
ACS Paragon Plus Environment 3 4 5 6 7 8 9 10 11 12 13 14 15 16 17 18 19 20 21 22 23 24 25 26 27 28 29 30 31 32 33 34 35 36 37 38 39 40 41 42 43 44 45 46 47 48 49 50 51 52 53 54 55 56
ACS Paragon Plus Environment 3 4 5 6 7 8 9 10 11 12 13 14 15 16 17 18 19 20 21 22 23 24 25 26 27 28 29 30 31 32 33 34 35 36 37 38 39 40 41 42 43 44 45 46 47 48 49 50 51 52 53 54 55 56 57
ACS Paragon Plus Environment 3 4 5 6 7 8 9 10 11 12 13 14 15 16 17 18 19 20 21 22 23 24 25 26 27 28 29 30 31 32 33 34 35 36 37 38 39 40 41 42 43 44 45 46 47 48 49 50 51 52 53 54 55 56