Forstw. Cbl. 122 (2003), 273⫺286 Eingereicht am 8. 4. 2003
©2003, Springer-Verlag Akzeptiert am 21. 8. 2003
ISSN 0015-8003
Predicting Understorey Vegetation Cover from Overstorey
Attributes in Two Temperate Mountain Forests
Beziehungen zwischen Bodenvegetation und Bestandeseigenschaften in zwei Gebirgswäldern der gemässigten Zone
By P. J. WEISBERG, C. HADORNand H. BUGMANN
Summary
It is important to develop a predictive understanding for the environmental controls on understorey vegetation, which harbor most of the plant biodiversity and are the source of food and cover for wildlife. Forest succession models (i.e. gap models) representing overstorey dynamics are not commonly linked to mathematical models of understorey dynamics. This is surprising, given that understorey vegetation clearly responds to changes in the overstorey that result in changing light availability. One difficulty may lie in the coarse representation of light regime captured by most gap models. Linkage of overstorey-understorey models might be facilitated if the diameter structure of simulated stands could be used to drive understorey change, as a proxy for light and other influences.
The objective of this study was to determine whether understorey vegetation cover can be adequately predicted by variables derived from overstorey diameter structure alone, or if canopy cover and light availability are important, from additional predictors. Field sampling was conducted at a montane and a subalpine study area in the Swiss Alps. We used regression analysis to assess the relative importance of various overstorey predictors for understorey cover and composition.
In the subalpine study area, the relative dominance of graminoids increased with increasing light availability, at the expense of forbs. In the montane study area, forb cover increased sharply with increasing light, while graminoid cover remained at low levels. As a result, the relative dominance of graminoid species declined with increasing light levels. This difference is attributed to the presence of
Adenostyles alliariae, a tall, large-leaved forb. The effects of changes in the physical environment on plant
community composition were thus mediated by interspecific interactions. This makes it difficult to predict overstorey-induced changes in understorey species composition at the level of functional groups. At both study sites, diameter structure variables were found to provide a reasonable approximation of total understorey cover, cover of the more common species, and species richness. Models of under-storey community composition often improved (0⫺31% increased predictive ability) with inclusion of variables representing the light environment. In the context of gap model development, the great complexity associated with improved representation of light availability must be weighed against the relatively low gain in predictive power that is likely to result. We recommend that efforts to include forest understorey dynamics in gap models begin by considering empirical relationships between under-storey patterns and overunder-storey diameter structure.
Keywords: Overstorey-understorey interactions, forest succession models, forest structure, light avail-ability, canopy, plant community composition.
Zusammenfassung
In Waldökosystemen enthält die Bodenvegetation oft einen wesentlichen Teil der Biodiversität, zudem stellt sie eine wichtige Nahrungsgrundlage für Wildtiere dar. Es ist deshalb wichtig, ein Verständnis der abiotischen und biotischen Faktoren zu gewinnen, welche die Eigenschaften der Bodenvegetation in Waldökosystemen bestimmen. Modelle der Walddynamik (z. B. Gap-Modelle) beschreiben die Entwick-lung des Baumbestandes, wurden aber nur selten mit mathematischen Modellen für die EntwickEntwick-lung der Bodenvegetation verknüpft. Dies ist erstaunlich angesichts der deutlichen Reaktion der Bodenvege-tation auf Veränderungen in der Bestandesstruktur, welche zu einem anderen Lichtregime führen. Ein Grund mag darin liegen, dass die Modellierung der Lichtverhältnisse in den meisten Gap-Modellen nur mit groben Annahmen erfolgt. Ein möglicher Ausweg könnte darin bestehen, die Eigenschaften der Bodenvegetation nicht direkt (über die Lichtverhältnisse), sondern indirekt anhand von Bestandes-Kenngrößen (wie z. B. der Durchmesserstruktur) zu modellieren.
Das Ziel der vorliegenden Arbeit war deshalb, zu bestimmen, ob sich die Zusammensetzung der Bodenvegetation durch die Bestandesstruktur alleine erklären lässt, oder der Deckungsgrad des
des und die Lichtverfügbarkeit als zusätzliche Variablen nötig sind. In zwei Waldbeständen der monta-nen und subalpimonta-nen Stufe in den Schweizer Alpen wurden Feldaufnahmen durchgeführt. Mittels Regres-sionsanalyse wurde die relative Bedeutung von verschiedenen erklärenden Variablen der Waldstruktur für die Zusammensetzung und den Deckungsgrad der Bodenvegetation untersucht.
In der subalpinen Untersuchungsfläche nahm die relative Dominanz der Gräser mit zunehmender Lichtverfügbarkeit auf Kosten der übrigen Blütenpflanzen zu. Am montanen Standort hingegen stieg der Deckungsgrad der krautigen Arten stark mit der Lichtverfügbarkeit an, während der Deckungsgrad der Gräser auf tiefem Niveau verblieb. Als Folge davon nahm die relative Dominanz der Gräser mit zunehmender Lichtverfügbarkeit an jenem Standort ab. Dieser Unterschied zwischen der montanen und der subalpinen Untersuchungsfläche liegt vor allem an der Anwesenheit der grossblättrigen Hoch-staudenart Adenostyles alliariae. Der Einfluss von Veränderungen der physikalischen Umwelt auf die Bodenvegetation wird somit durch die Interaktionen zwischen einzelnen Arten überlagert. Dies macht es schwierig, Veränderungen der Bodenvegetation auf der Ebene von funktionellen Gruppen (oder gar einzelnen Arten) vorherzusagen.
In beiden Untersuchungsgebieten erwiesen sich die Bestandesstruktur-Variablen als geeignete Grö-ßen für die Erklärung des Deckungsgrades der gesamten Bodenvegetation, des Deckungsgrades der dominierenden Pflanzenarten und der Artenzahl. Die statistischen Modelle für die Artenzusammenset-zung der Bodenvegetation wurden oft aber etwas verbessert (0⫺31% höhere erklärte Varianz), wenn Variablen der Lichtverfügbarkeit mitberücksichtigt wurden. Verglichen mit dem zusätzlichen Aufwand, der für eine bessere Wiedergabe der Lichtverhältnisse in Gap-Modellen nötig wäre, ist die dadurch erreichte Zunahme an Vorhersagekraft dieser Modelle recht klein. Deshalb empfehlen wir, dass die Bodenvegetation in Gap-Modellen mindestens in einem ersten Schritt über die statistischen Zusammen-hänge zwischen Bodenvegetation und Bestandesstruktur modelliert werden sollte.
Schlüsselwörter: Bodenvegetation, Bestandeseigenschaften, Waldsukzessionsmodelle, Waldstruktur, Lichtverfügbarkeit, Pflanzensoziologie.
Nomenklatur: HESSet al. 1991
1 Introduction
Numerous models predict forest overstorey growth and tree population responses to silvicultural activities and natural disturbances (e. g. ZELIG:MILLERand URBAN2000, SILVA: PRETZSCHet al. 2002). However, our ability to predict the response of forest understorey vegetation to such perturbations, within the context of forest succession models, remains limited. A predictive understanding of environmental controls on understorey vegetation is vitally important, since most of the plant biodiversity in temperate forest ecosystems is contained within the understorey, which also comprises the forage and cover environment for many wildlife species. Many wildlife habitat models depend largely on the attributes of understorey vegetation (e. g. MARZLUFFet al. 2002).
Understorey vegetation clearly responds to changes in the overstorey that result in changing light availability (ZAVITKOVSKI 1976, ALABACKand HERMAN1988, LIEFFERS et al. 1999, MCKENZIEet al. 2000). It is therefore surprising that forest succession models (i.e. gap models) representing overstorey dynamics have seldom been linked to mathematical models of understorey dynamics. One reason may be the coarse representation of the light environment captured by most gap models. With few exceptions (e. g. PACALAet al. 1993), gap models assume horizontal homogeneity of crown coverage, often resulting in unrealistic estimates of light availability for lower vertical strata (reviewed in BUGMANN 2001). More complex models of the relationship between canopy structure and below-canopy irradiance have been developed in the context of spatially-explicit forest stand models (e. g. BRUNNER1998), but are not widely applied.
Most forest overstorey models, whether individual-based or cohort-based, track diame-ter distributions of overstorey tree species (e. g. BUGMANN1996). They generally also derive estimates of leaf area, and may calculate canopy cover and/or light availability, but these variables are often calculated secondarily using the diameter distributions and general relationships describing crown form for trees of different species and sizes. For prediction of understorey vegetation structure, sources of error would be reduced if the diameter
structure itself could be used, and not the more derived variables. Also, the models need to be developed using field data, and diameter structure is more rapidly and efficiently measured than light environment, at the scale of a whole stand.
Early studies of overstorey-understorey interactions focused on diameter structure and crown cover variables as predictors of understorey community patterns and dynamics (e. g. EHRENREICHand CROSBY1960, JAMESON1967, ALABACK1982). As newer technologies have been developed for estimating photosynthetically active radiation (i.e. PAR) either directly or through digital analysis of hemispherical photography of the canopy, light availability itself has emerged as the more commonly used predictor. Yet, it remains unclear whether, for purposes of coupling overstorey-understorey dynamics in simulation models, it is sufficient to use diameter structure as a proxy for PAR and other more direct influences on forest understorey cover, such as canopy cover (influencing throughfall as well as light), and root competition. Few studies have examined the relative efficacy of forest overstorey variables for predicting understorey structure, compared to variables that more directly describe light or nutrient availability (NAUMBURGand DEWALD1999).
The primary objective of this research was to determine whether understorey vegeta-tion cover can be adequately predicted by variables derived from overstorey diameter structure alone, or if canopy cover and light availability are important, additional predic-tors. A secondary, related objective was to describe the overstorey influences on total understorey vegetation cover, on species richness of the understorey strata, on the relative cover of different functional groups (graminoids, forbs, ferns, shrubs), and on the cover of selected understorey species. In two study areas representing different forest types in the Swiss Alps, a number of variables were measured or derived that describe diameter structure, canopy cover, and light availability. A regression model approach was then employed to test whether the influence of canopy cover (or light availability) was signifi-cant after accounting for the influence of diameter structure, and whether the influence of light availability was significant after accounting for the joint influence of canopy cover and diameter structure.
2 Methods 2.1 Study Areas
Two sites, 2.3 km apart and located on the same extensive north-facing slope in the Werdenberg region of Canton Saint-Gallen (Swiss pre-Alps), were selected for investiga-tion because they represent typical condiinvestiga-tions for their forest types and include an area of contiguous forest extensive enough to allow the systematic sampling scheme described below. These sites were also selected on the basis of having not been perturbed by forest management activities or large-scale natural disturbances within the past 10 years. Both sites were affected by a severe windstorm (Sturm “Vivian”) in 1990, and many of the more open plots sampled resulted from treefalls associated with this event.
Site A (9.3816 E longitude, 47.1918 N latitude), located at an elevation of approximately 1100 m, is a conifer-dominated stand with a fairly even representation of Norway spruce (Picea abies) and European silver fir (Abies alba) in the upper canopy, and broad-leaved tree species (mainly Fagus sylvatica) in the subcanopy. This site represents a typical Tall Forb-Fir-Beech community, widespread among montane forests of the region (OTTet al. 1997, forest type no. 20). The understorey can be quite dense and multi-layered and is dominated by tall forb species such as Adenostyles alliariae, Petasites albus, Saxifraga rotundifolia and Ranunculus lanuginosus. A shrub layer of Rubus spp. may dominate in larger canopy gaps, but generally shrub cover is minimal. Additional important understorey species include Galium odoratum, Lamium montanum, Mercurialis perennis, and various fern species including Athyrium filix-femina. Graminoid species of importance include Carex silvatica
and C. remota. However, on shadier microsites there is very little understorey and Oxalis acetosella may be the dominant species.
Site B (9.3589 E longitude, 47.1782 N latitude), located at an elevation of approximately 1500 m, is a pure P. abies stand, representing a typical subalpine Calamagrostis-spruce forest (OTT et al. 1997, forest type no. 60*). This site has a more patchy, subalpine character than site A, and important understorey species include the graminoid Luzula silvatica, the low shrub Vaccinium myrtillus, the forbs Hieracium murorum and Homogyne alpina, and Lycopo-dium annotinum. On the shadiest patches, the Picea overstorey may cast such dense shade that no vascular plants occur, except for scattered pockets of Oxalis acetosella, Viola biflora, or Calamagrostis villosa.
The study area experiences a typical Northern Alps climate with strong oceanic influen-ces, with an interpolated mean annual precipitation of 2000 mm at site A and 2400 mm at site B (SPREAFICOand WEINGARTNER 1992). The geology of the two sites differs, with site A situated on loosely structured diamictite (“Wildflysch”), and site B on hard Middle Cretaceous limestone (“Schrattenkalk”). Soils at site A are very clayey. Soil pH values are quite variable, ranging from 4.7⫺7.4 at site A, and from 4.7⫺6.2 at site B. Site B is characterized by limestone outcrops and a karst topography, and so soil characteristics are strongly dependent on the position relative to the bedrock.
2.2 Data Collection
In July 2001, 15 and 16 plots (at sites A and B, respectively) were sampled within the study areas at 50 m intervals along a systematic grid. Each 0.04 ha, circular plot was sampled according to a nested design modified from MCKENZIEet al. (2000) (Fig. 1). All trees > 5 cm diameter at breast height (DBH) were tallied by species and measured for diameter. Saplings of > 5 cm height, which were rare in our plots, were tallied by species in four 1×6 m quadrates, arranged along perpendicular radii within the 0.04 ha tree plot. Shrub cover was estimated using the line-intercept method along the center lines of the sapling quadrates. Cover of all species in the herb layer (excluding mosses and lichens) was visually estimated for twenty 0.10- m2subplots per 0.04 ha tree plot. The herb layer subplots were evenly spaced along the center lines of the sapling quadrates.
At the center point of each plot, a single hemispherical photograph was taken using a digital camera (Nikon Coolpix 990 camera with an FC-E8 fisheye lens, focal length 8.2 mm) set at a height of approximately 1.3 m on a self-levelling mount, oriented to magnetic north. To ensure uniform lighting conditions, photographs were taken in the early morning or evening on overcast days. Key parameters of the light regime for each plot were estimated from image analysis of the photographs (as in CANHAM1988, CANHAM et al. 1994), using Gap Light Analyzer software (GLA; FRAZER et al. 1999). The light indices used for this study were the estimated fluxes of direct, diffuse, and total light transmitted (mol m−2 day−1). For certain graphical analyses we report the relative light availability as the percentage of extraterrestrial radiation that is incident upon the under-storey. We used ArcView GIS software and a 25-m resolution digital elevation model to calculate a “topographic mask” that the GLA software used to account for topographic shading effects of nearby ridgelines. An estimate of percentage of open sky was also provided by GLA, and we used this as our canopy cover variable (Table 1).
2.3 Data Analysis
We used a series of linear regression analyses to assess the relative importance of various overstorey predictors for selected understorey response variables. Plot-level means were calculated for each of the diameter structure, canopy cover, and light availability variables (Table 1). Understorey variables were total vegetation cover, the relative dominance (pro-portional cover) of each plant functional group (forbs, graminoids, ferns and shrubs), the
Fig. 1. Sampling design, showing microplots for understory cover, line transects for shrub cover,
rectan-gular quadrates for sapling density, and the location of the hemispherical photo taken at the center of each 0.04 ha plot.
Abb. 1. Layout einer Stichprobenfläche mit kleinen Quadraten für Deckung der Bodenvegetation,
Tran-sekte für Deckung der Strauchvegetation, rechteckige Flächen für Dichte der Ansamung, sowie Standort des Stativs für die Aufnahme eines hemisphärischen Fotos im Zentrum des 0.04 ha großen Kreises.
cover of each of the two most abundant species at each site, and species richness. We applied logarithmic transformations to normalize variable distributions as needed.
For each response variable, a maximum of six separate regression models were fit: (1) diameter structure variables only; (2) canopy cover variables only; (3) light availability variables only; (4) residuals of the diameter structure model against canopy cover; (5) residuals of the diameter structure model against light availability variables; (6) residuals of a combined diameter structure⫺canopy cover model against light availability variables.
Table 1. Explanatory variables used to predict vegetation cover, including their abbreviations and units.
In the text and tables 3 and 4, “L” may precede one of the abbreviations given below to indicate that the variable has been transformed using the natural logarithm. Equations are given below the table, where relevant.
Tabelle 1. Erklärende Variablen für den Deckungsgrad der Bodenvegetation mit Angabe der
Abkürzun-gen und Einheiten. Ein der Variable vorangestelltes „L“ im Text und in den Tabellen 2 und 3 bedeutet, dass die Variable mit dem natürlichen Logarithmus transformiert wurde. Die zugehörigen Gleichungen sind unterhalb der Tabelle angegeben.
Variable Class Variable Abbreviation Units
Diameter Structure Basal Area BA m2
ha−1
Tree Density N stems ha−1
Stand Density Index1 SDI unitless
Mean Diameter2
DM cm
Quadratic Mean Diameter3 QMD cm
Canopy Cover Site Openness PSO %
Light Direct Light Transmitted DIR mol m−2
d−1 Diffuse Light Transmitted DIF mol m−2d−1 Total Light Transmitted TOT mol m−2d−1 Equations.
1. SDI = (BA · N )0.5 2. DM =25/
N· (
兺
DBH), where DBH = diameter at breast height (cm) 3. QMD = (25/N·
兺
(DBH2))0.5Since the variables within each variable class (Table 1) are highly correlated, only the single predictor variable with the highest Pearson’s correlation with the response was used to fit a particular model. The variables are also highly correlated between classes, particularly canopy cover with total and diffuse light (Table 2). The first three models allow compari-son of how well each overstorey variable class predicts a particular understorey response variable, which was evaluated using standardized B and R2coefficients. Adjusted R2 coeffi-cients were not necessary since only one variable was used in each model. The fourth and fifth models indicate whether the effects of canopy cover and light are statistically signifi-cant after diameter structure has been taken into account, and provide a partial R2value that estimates the additional proportion of the variance explained by canopy cover or light. The sixth model indicates whether light availability was an important predictor even after the effects of diameter structure and canopy cover were accounted for. If the model with diameter structure as the predictor was not significant, models 4, 5, and 6 were
Table 2. Correlation of variables describing diameter structure and canopy cover with variables
describ-ing light transmittance. * = p < 0.05; ** = p < 0.01; *** = p < 0.001.
Tabelle 2. Korrelationen zwischen Variablen, welche die Durchmesserstruktur und den
Kronen-Deckungsgrad beschreiben, und Variablen zur Charakterisierung der Lichtverfuegbarkeit. Die Sterne bezeichnen das Signifikanzniveau α, *: p < 0.05; **: p < 0.01; ***: p < 0.001.
Variable Direct Light Diffuse Light Total Light
Basal Area ⫺0.239 ⫺0.714** ⫺0.702**
Tree Density ⫺0.542* ⫺0.805*** ⫺0.869***
Stand Density Index ⫺0.440 ⫺0.817*** ⫺0.851***
Mean Diameter 0.626* 0.210 0.385
Quadratic Mean Diameter 0.578* 0.230 0.378
not estimated. For all statistical analyses, we considered α < 0.10 to represent marginal significance, and α < 0.05 to represent significance.
3 Results
3.1 Overstorey Influences on Plant Community Composition
Total vegetation cover and the cover of any individual plant species always increased with decreasing stand density and/or increasing light availability (Tables 3 and 4). This rela-tionship was rather strong for total vegetation cover (R2from .62 to .87), but was weaker for the cover of individual species (R2 from .39 to .80) (Tables 3 and 4). However, the relative understorey dominance of any given functional group tended to be more weakly associated with overstorey structure (R2 from .23 to .41), regardless of which predictor variables were considered.
Forb cover at site A increased sharply with increasing light availability, while graminoid cover remained at low levels (Fig. 2a). As a result, the relative dominance of graminoid species declined with increasing light levels (Table 3). The light response of cover for A. alliariae, the most common forb species, paralleled that for all forb species taken together. At site B, graminoid cover increased steadily with increasing light availability, while forb cover showed a threshold response where, above relative light availability values of about 20 %, forb cover remained variable but stable, within 16⫺32 % of total vegetation cover (Fig. 2b). As a result, the relative dominance of graminoids increased with increasing light availability at the expense of forbs (Table 4).
The relative dominance of fern species was not significantly associated with any of the overstorey variables at either of the sites (Tables 3 and 4). Shrub dominance increased with increasing light or canopy openness at site B, but was not associated with any of the overstorey variables at site A.
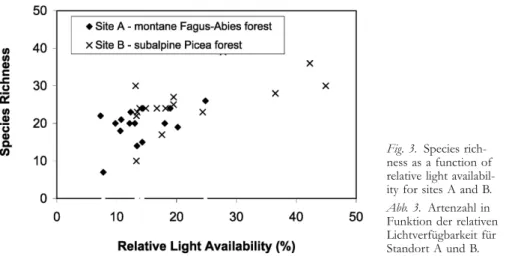
Species richness in the forest understorey appears to be greater in more open stands. Species richness at site A was negatively associated with stand density index, but not significantly associated with canopy cover or light (Table 3). At site B, species richness was greater for less dense, more open, lighter sites (Table 4). The relationship between species richness and relative light availability appears to be similar at sites A and B over the range of light availability sampled in the A plots (Fig. 3). This suggests that species richness at site A might also have been positively associated with light availability, had plots been sampled at relative light availability greater than 25 %.
3.2 Predictive Models of Understorey Vegetation
The ability of diameter structure to predict understorey vegetation cover and species richness varied with site and response variable (Tables 3 and 4). At site A, diameter structure variables were significant predictors of total vegetation cover, cover of the two individual species tested (A. alliariae and O. acetosella), and species richness (Table 3). Stand density index was the variable chosen for all cases except O. acetosella cover, where the quadratic mean diameter was the better predictor. However, diameter structure failed to predict the relative dominance of any of the four functional groups. Canopy cover and light availability (LDIF) successfully predicted the relative dominance of graminoids, albeit weakly (R2= .25, .23, respectively), but failed to predict species richness. For total vegeta-tion and A. alliariae cover, the proporvegeta-tions of variance explained by canopy cover and diameter structure were comparable, while models using light availability explained greater proportions of the variance. The cover of O. acetosella was explained about equally well by any of the three groups of predictor variables.
Ta bl e 3 . R esults of simple linear reg ression models of the effects of variables re presenting stand diameter str ucture , canopy co ve r, and light en vironment o n ve g etation co ve r, for the montane F agus-Abies site (site A). T h e “V AR” column refers to the variable in eac h explanator y variable g roup used to fit the model (this w as the variable with the highest cor relation to the response variable). Standardized beta coefficients (βstand ) are sho wn so effects are comparable across variables and models . F or par tial reg ression models (the 2 sets of columns on the right), both par tial R 2 and m ultiple R 2 coefficients are gi ven. T h e for mer describes the propor tion of variance explained b y the predictor variable after taking the variance already explained b y the reduced model into accou nt. T h e latter describes the propor tion of the variance explained b y the full model. Only models with p < 0.10 are sho wn, and those with p > 0.05 are italicized. F o r a description of variable abbreviations , see T able 1. T abelle 3. R esultate der einfac hen linearen R eg ressionsmodelle bezüglic h der Einf lüsse vo n Indices der Durc hmesserstr uktur , des Kronen-Dec kungsg rads und der Lic htv erfügbark eit auf die Dec kung und Zusammensetzung der Boden ve g etation für den montanen T annen-Buc hen-Standor t (Standor t A). Die Spalte „V AR“ gibt an, w elc he erklärende V ariable im Modell verw endet wurde (diejenig e mit der stärksten K o rrelation mit der Zielv ariablen). Damit die Einf lüsse über alle V ariablen und Modelle vergleic hbar sind, w erden die standardisier ten Beta-K oeffizienten ang eg eben. Für die par tiellen R eg ressionsmodelle („Ca nopy Co ver“ resp . „Light gi ve n Diameter Str ucture“) w erden so w ohl das par tielle R 2und das m ultiple R 2ang eg eben. Ersteres besc hreibt den Anteil der V arianz, w elc he nac h Ber üc ksic htigung der ersten V ariable zusätzlic h durc h die zw eite V ariable erklär t wird. Letzteres besc hreibt den Anteil der V arianz, w elc her durc h das g esamte Modell erklär t wird. Es w erden n u r Modelle ang eg eben, w elc he ein p < 0.10 er reic hen. Jene mit p > 0.05 sind kursi v g edr uc kt. Für eine Erklär ung der Abkür zun-g en vgl. T abelle 1. R e sp ons e D ia m ete r S tr u ct u re Ca no p y C o ver Li gh t C a n o p y C o ver g iven Li gh t giv e n Va ri ab le Di am ete r S tr u ct u re Di am ete r S tr u ct u re VA R βstand R 2 pV A R βstand R 2 pV A R βstand R 2 pV A R βstand pR 2 pV A R βstand pR 2 p (R 2)( R 2) T o ta l V eg e-SD I − 0. 78 .6 2 < .0 01 L P S O 0. 74 .5 5 .00 2 L TO T 0 .8 4 .70 < .0 0 1 −− − − − − − − ta ti on C o ver Pr op or ti o n − − − − −− − − − − − − −− − − − − − − F o rb Co ver Pr op or ti o n −− − − LP SO − 0. 50 .2 5 .05 9 LD IF − 0. 48 .2 3 .0 7 3 LP SO − 0. 50 .2 5 .05 9 LD IF − 0. 48 .2 3 .07 3 Gr as s Cov e r (. 25 ) (. 23 ) Pr op or ti o n − − − − −− − − − − − − −− − − − − − − F e rn Co ver Pr op or ti o n − − − − −− − − − − − − −− − − − − − − Sh ru b Cov e r Ad en ost yl es SD I − 0. 62 .3 9 .0 1 4 L PS O 0 .7 5 .56 .0 01 L T O T 0. 87 .7 5 < .0 01 −− − − LT O T 0. 34 .1 9 .09 9 al li ari ae (. 80 ) Ox al is Q M D 0 .6 0 .59 .0 05 L P S O 0. 86 .4 3 .01 1 L TO T 0 .8 5 .54 .0 03 −− − − − − − − ac et ose ll a QM D ∧ 20 .2 5 Sp ec ies SD I − 0. 50 .2 5 .0 5 5 −− − − − − − − −− − − − − − − Ri ch nes s
Ta bl e 4 . R esults of simple linear reg ression models of the effects of variables re presenting stand diameter str ucture , canopy co ve r, and light en vironment o n ve g etation co ve r, for the subalpine Picea site (site B). T h e “V AR” column refers to the variable in eac h explanator y variable g roup used to fit the model (this w as the variable with the highest cor relation to the response variable). Standardized beta coefficients (β stand ) are sho wn so effects are comparable across variables and models . F or par tial reg ression models (the 2 sets of columns on the right), both par tial R 2and m ultiple R 2coefficients are gi ven. T h e for mer describes the propor tion of variance explained b y the predictor variable after taking into account the variance already explained b y the reduced model. T h e latter describes the propor tion of the variance explained b y the full model. Only models with p < 0.10 are sho wn, and those with p > 0.05 are italicized. F o r a description o f variable abbreviations , see T able 1. T abelle 4. R esultate der einfac hen linearen R eg ressionsmodelle bezüglic h der Einf lüsse vo n Indices der Durc hmesserstr uktur , des Kronen-Dec kungsg rads und der Lic htv erfügbark eit auf die Dec kung und Zusammensetzung der Boden ve g etation für den subalpinen Fic hten-Standor t (Standor t B). Die Spalte „V AR “ gibt an, w elc he erklärende V ariable im Modell verw endet wurde (diejenig e mit der stärksten K o rrelation mit der Zielv ariablen). Damit die Einf lüsse über alle V ariablen und Modelle vergleic hbar sind, w erden die standardisier ten Beta-K oeffizienten ang eg eben. Für die par tiellen R eg ressionsmodelle („Canopy Co ve r“ resp . „Light gi ve n Diameter Str ucture“) w erden so w ohl das par tielle R 2und das m ultiple R 2ang eg eben. Ersteres besc hreibt den Anteil der V arianz, w elc he nac h Ber üc ksic hti-gung der ersten V ariable zusätzlic h durc h die zw eite V ariable erklär t wird. Letzteres besc hreibt den Anteil der V arianz, w elc her durc h das g esamte M odell erklär t wird. Es w erden n u r Modelle ang eg eben, w elc he ein p < 0.10 er reic hen. Jene mit p > 0.05 sind kursi v g edr uc kt. Für eine Erklär ung der Abkürzung en vgl. T ab elle 1. R e sp ons e D ia m ete r S tr u ct u re Ca no p y C o ver Li gh t C a n o p y C o ver g iven Li gh t giv e n Va ri ab le Di am ete r S tr u ct u re Di am ete r S tr u ct u re VA R βstand R 2 pV A R βstand R 2 pV A R βstand R 2 pV A R βstand pR 2 pV A R βstand pR 2 p (R 2)( R 2) T o ta l V eg e-LS DI − 0. 86 .7 4 < .0 01 L P S O 0. 82 .6 7 < .0 01 L D IF 0. 87 .7 5 < .0 01 L P S O 0. 28 .3 0 .02 9 L DI F 0 .2 6 .2 6 .0 44 ta ti on C o ver (. 87 ) (. 87 ) Pr op or ti o n −− − − LP SO − 0. 57 .3 3 .0 2 0 L DI F − 0. 56 .3 1 .0 2 5 L PS O − 0. 57 .3 3 .02 0 L DI F − 0. 56 .3 1 .02 5 F o rb Co ver (. 33 ) (. 31 ) Pr op or ti o n BA − 0. 60 .3 6 .0 1 4 L PS O 0 .6 4 .41 .0 10 L D IF 0. 63 .4 0 .0 0 9 − − −− − − −− Gr as s Cov e r Pr op or ti o n − − −− − − −− − − −− − − − − − − − − F e rn Co ver Pr op or ti o n −− − − LP SO 0. 45 .2 0 .0 8 1 LD IF 0. 48 .2 3 .0 5 8 LP SO 0. 45 .2 0 .08 1 LD IF 0. 48 .2 3 .05 8 Sh ru b Cov e r (. 20 ) (. 23 ) V a cc ini um LS DI − 0. 70 .4 9 .0 0 3 L PS O 0 .6 4 .40 .0 08 L D IF 0. 69 .4 8 .0 0 3 − − −− − − −− m yr till us Lu zu la LS DI − 0. 71 .5 1 .0 0 2 L PS O 0 .6 5 .43 .0 06 L D IF 0. 69 .4 8 .0 0 3 − − −− − − −− si lvat ic a Sp ec ies LS DI − 0. 81 .6 4 < .0 01 L P S O 0. 60 .3 6 .0 1 4 L DI F 0 .6 5 .42 .0 07 −− − − L D IR 0. 30 .2 6 .04 4 Ri ch nes s (. 74 )
Where diameter structure yielded a significant model at site A, inclusion of the canopy cover predictor variable generally failed to significantly improve the relationship after taking the effects of diameter structure into account (Table 3). Inclusion of a light availabi-lity variable (LTOT) improved model fit only for A. alliariae cover, explaining 19 % of the variance not explained by diameter structure. In no case, for either of the sites, was inclusion of a light availability variable significant after the effects of both diameter struc-ture and canopy cover had been included in the models (not shown in Tables 3 and 4).
Site B resembled site A in that, of all the diameter structure variables, stand density index was the best predictor for nearly all response variables tested (Table 4). Another similarity to site A was that diameter structure predicted species richness, total vegetation cover, and the cover of individual species reasonably well, but was not as useful for predicting the relative dominance of functional groups with the sole exception of grami-noids, where the R2value (.36) was comparatively low. As for site A, canopy cover and light were marginally successful at predicting those of the relative dominance variables (proportion forb cover, proportion shrub cover) that were not significantly associated with diameter structure. Unlike site A, the ability of canopy cover and light availability to predict understorey cover and species richness was approximately equal. Light and canopy cover variables were significantly associated with two of the response variables (i.e. total vegetation cover, species richness) even after the effects of diameter structure had been accounted for. For both cases, 26 % of the remaining variance was explained by light availability (Table 4).
4 Discussion
4.1 Overstorey Influences on Understorey Structure: the Importance of Interspecific Interactions
It is well known that graminoid species are often at a competitive advantage under condi-tions of high resource availability (TILMAN 1988, KULL and AAN1997). A test of three hypotheses explaining this relationship (higher crowns; more optimal distribution of foliar nitrogen; improved nitrogen use efficiency), for understorey communities in deciduous forests of western Estonia, suggested that the competitive advantage is due mainly to a superior nitrogen use efficiency (KULLand AAN1997). In any case, previous studies have shown that more open forest canopies are likely to be associated with relatively high cover values for understorey graminoid species (e. g. LEACH and GIVNISH 1999, THOMAS et al. 1999, GRIFFISet al. 2001, ROBERTSand ZHU2002). Therefore, we expected to find a greater proportion of graminoid cover under conditions of high light or low canopy cover, but greater proportions of forb and fern cover under low light conditions.
This expected relationship was observed at site B, but not at site A (Tables 3 and 4, Fig. 1). In fact, at site A there was a weakly significant negative association between light availability and relative graminoid cover (Table 3). This can be explained by the presence of A. alliariae in site A. This species has large leaves (up to 40 cm diameter), can attain heights of > 1 m, and so is a strong competitor for light. At site A, A. alliariae cover increased sharply with increasing light availability (Fig. 2a), shading out graminoid species and all but the most shade-tolerant forb and fern species. At site B, A. alliariae was not present and the dominant forbs were Hieracium murorum, Homogyne alpina, and Viola biflora, all small-leaved species of relatively low stature. As a result, graminoid species (especially the rush, Luzula silvatica) were able to respond strongly to increased light availability and outcompete forb species on site B, but not on site A.
The effects of changes in the physical environment on plant community composition were thus mediated by interspecific interactions (e. g. competition for light) among the species present. It is possible that overstorey-induced changes in species composition of understorey vegetation in Swiss (and perhaps other) mountain forests cannot be predicted
Fig. 2. Percent cover of forbs and graminoids as a function of relative light availability (i.e. the
propor-tion of extraterrestrial radiapropor-tion reaching the forest understory at a particular site, considering both diffuse and direct components), shown for (A) the montane site A; and, (B) the subalpine site B. For site A, the percent cover of the tall forb A. alliariae is also shown, and the percent cover for all forbs includes this value.
Abb. 2. Deckungsprozent von krautige Pflanzen und Gräsern in Funktion der relativen
Lichtverfügbar-keit (Anteil der totalen Einstrahlung, welcher den Waldboden erreicht) für (A) den montanen Standort A und (B) den subalpinen Standort B.
at the level of functional groups, without detailed knowledge of the species present at a given site. A fuller understanding of overstorey effects on understorey plant community composition may need to consider species-specific differences in requirements for light and edaphic resources, as has been observed also for a thinning experiment in the north-western United States (THOMASet al. 1999).
Fig. 3. Species
rich-ness as a function of relative light availabil-ity for sites A and B.
Abb. 3. Artenzahl in
Funktion der relativen Lichtverfügbarkeit für Standort A und B.
Species richness tended to increase with decreasing stand density and increasing light availability, particularly at site B, where a wider range of light conditions was sampled (Fig. 3). This monotonic increase is similar to results obtained for vascular plants in thinning studies conducted for other forest types (ALABACKand HERMAN1988, THOMASet al. 1999), and is consistent with the field observation that only a few, especially shade-tolerant species (e. g. O. acetosella) occur under a dense canopy. When new species are introduced in more open settings, the shade-tolerant species do not disappear and often persist as a lower structural layer below a layer of more light-demanding, taller species (e. g. A. alliariae). These results do not support the intermediate disturbance hypothesis for understorey species richness (READERet al. 1991), where species richness should again begin to decline with decreasing forest cover after an optimal level of forest cover has been reached. However, we sampled few sites at the highest levels of light availability (Fig. 3), and it is possible that a unimodal relationship would have been found had we sampled more plots in relatively open areas.
Is Diameter Structure Adequate for Predicting Understorey Vegetation Cover and Species Richness?
Diameter structure adequately predicts certain understorey variables, but not others (Ta-bles 3 and 4). There is no advantage to including light varia(Ta-bles for 6 of 9 (67 %) response variables on site A, but for 4 of 9 (44 %) response variables on site B. Light availability variables increased the predictive power (R2) of regression models by 10 %⫺31 % on site B. However, diameter structure provides a reasonably good fit for all those response variables that can be predicted by light availability, excluding variables related to shifts in species composition (i.e. relative dominance). Only for the cover of A. alliariae does the inclusion of light in a regression model already including diameter structure yield a sub-stantial improvement in the overall proportion of model variance explained. Canopy cover variables are similar to light variables in their ability to predict understorey vegetation, which is sensible since there are high correlations among the two variable sets (Table 2). For species richness on both sites, diameter structure predicts understorey vegetation better than light variables (Tables 3 and 4). This situation may arise because overstorey structure also influences the structure and composition of understorey vegetation as me-diated through environmental influences other than light, including soil moisture and nutrient availability. The cooler microclimates beneath dense understories may result in reduced evapotranspiration and hence increased soil water availability, although denser
canopies may also create drier conditions due to reduced throughfall inputs and increased water uptake by overstorey trees (MCLAUGHLIN1978, BRESHEARSet al. 1997). “Root gaps” may create localized patches of increased water and nutrient availability (e. g. PARSONS et al. 1994). Canopy litter inputs and microclimatic effects may influence local nutrient cy-cling in ways that either facilitate or hinder the availability of plant nutrients and water.
Our conclusions about the relative influences of light and diameter structure on under-storey vegetation are similar to those of the only other study we are aware of which directly made this comparison, a study of graminoid species under a Pinus ponderosa canopy in the southwestern United States (NAUMBURG and DEWALD 1999). In that study, as in ours, species presence (i.e. species richness in our study) was most strongly associated with diameter structure (mean diameter), while species cover and plant density were more strongly associated with light availability.
The mechanisms for overstorey influences on understorey composition are complex and multivariate, including light availability, plant nutrients, evapotranspiration, and soil water availability. Unfortunately, most forest succession models do not include such me-chanisms with an appropriate level of detail for representing overstorey-understorey inter-actions. There are trade-offs between adding more complexity to the forest succession models (i.e. improving representation of light availability, overstorey-understorey competi-tion for nutrients and moisture, spatial heterogeneity) or simulating understorey dynamics using simpler relationships with tree diameter structures. Studies such as this one quantify how much relative error may be introduced by using simpler model formulations of overstorey-understorey interactions. There is a need for future studies that apply multiva-riate and nonlinear statistical approaches to the investigation of overstorey-understorey in-teractions.
Diameter structure variables allow a reasonable approximation of total understorey cover, cover of some of the more common species, and species richness. However, our results suggest that empirical models which seek to predict understorey community com-position would benefit from inclusion of variables representing the light environment. In most cases, canopy cover may be used as a surrogate for the light environment variable.
5 Acknowledgements
P. ALABACK provided constructive comments on an earlier draft. This work was made possible through the logistical support of A. EGGENBERGER and J. TRÜMPLER, and was funded through the Swiss Agency for the Environment, Forests and Landscape (BUWAL), project no. WT-03/00.
6 References
ALABACK, P.B., 1982: Dynamics of understorey biomass in Sitka Spruce- Western Hemlock forests of southeast Alaska. Ecology 63: 1932⫺1948.
ALABACK, P.B., HERMAN, F.R., 1988: Long-term response of understorey vegetation to stand density in Picea-Tsuga forests. Can. J. For. Res. 18: 1522⫺1530.
BRESHEARS, D.D., RICH, P.M., BARNES, F.J., CAMPBELL, K., 1997: Overstorey-imposed heterogeneity in solar radiation and soil moisture in a semiarid woodland. Ecol. Appl. 7: 1201⫺1215.
BRUNNER, A., 1998: A light model for spatially explicit forest stand models. For. Ecol. Manage. 107: 19⫺46.
BUGMANN, H., 1996: A simplified forest model to study species composition along climate gradients. Ecology 77: 2055⫺2074.
BUGMANN, H., 2001: A review of forest gap models. Clim. Change 51: 259⫺305.
CANHAM, C.D., 1988: An index for understory light levels in and around canopy gaps. Ecology 69: 1634⫺1638.
CANHAM, C.D., FINZI, A.C., PACALA, S.W., BURBANK, D.H., 1994: Causes and consequences of resource heterogeneity in forests: interspecific variation in light transmission by canopy trees. Can. J. For. Res. 24: 337⫺349.
EHRENREICH, J.H., CROSBY, J.S., 1960: Herbage production is related to hardwood crown cover. J. For. 58: 564⫺565.
FRAZER, G.W., CANHAM, C.D., LERTZMAN, K.P., 1999: Gap Light Analyzer (GLA), Version 2.0: Imaging software to extract canopy structure and gap light transmission indices from true-colour fisheye photographs, users manual and program documentation. Simon Fraser University, B.C. and the Institute of Ecosystem Studies, N.Y.
GRIFFIS, K.L., CRAWFORD, J.A., WAGNER, M.R., MOIR, W.H., 2001: Understorey response to management treatments in northern Arizona ponderosa pine forests. For. Ecol. Manage. 146: 239⫺245. HESS, H.E., LANDOLT, E., HIRZEL, R., 1991: Bestimmungsschlüssel zur Flora der Schweiz und
angrenzen-der Gebiete, 3. Edition, Birkhauser, Basel.
JAMESON, D.A., 1967: The relationship of tree overstorey and herbaceous understorey vegetation. J. Range Manage. 20: 247⫺249.
KULL, O., AAN, A., 1997: The relative share of graminoid and forb life-forms in a natural gradient of herb layer productivity. Ecography 20: 146⫺164.
LEACH, M.K., GIVNISH, T.J., 1999: The ecology of oak savanna ground layers. Ecol. Mon. 69: 353⫺374. LIEFFERS, V.J., MESSIER, C., STADT, K.J., GENDRON, F., COMEAU, P.G., 1999: Predicting and managing light
in the understorey of boreal forests. Can. J. For. Res. 29: 796⫺811.
MARZLUFF, J.M., MILLSPAUGH, J.J., CEDER, K.R., OLIVER, C.D., WITHEY, J., MCCARTER, J.B., MASON, C.L., COMNICK, J., 2002: Modeling changes in wildlife habitat and timber revenues in response to forest management. For. Sci. 48: 191⫺202.
MCKENZIE, D., HALPERN, C.B., NELSON, C.R., 2000: Overstorey influences on herb and shrub communi-ties in mature forests of western Washington, U.S.A. Can. J. For. Res. 30: 1655⫺1666.
MCLAUGHLIN, S.P., 1978: Overstorey attributes, light, throughfall, and the interpretation of overstorey-understorey relationships. For. Sci. 24: 550⫺553.
MILLER, C., URBAN, D., 2000: Modeling the effects of fire management alternatives on Sierra Nevada mixed-conifer forests. Ecol. Appl. 10: 85⫺94.
NAUMBURG, E., DEWALD, L.W., 1999: Relationships between Pinus ponderosa forest structure, light cha-racteristics, and understorey graminoid species presence and abundance. For. Ecol. Manage. 124: 205⫺215.
OTT, E., FREHNER, M., FREY, H-U., LÜSCHER, P., 1997: Gebirgsnadelwälder. Ein praxisorientierter Leitfa-den für eine standortsgerechte Waldbehandlung, Haupt-Verlag, Bern, Switzerland.
PACALA, S.W., CANHAM, C.D., SILANDER, Jr., J.A., 1993: Forest models defined by measurements: I. The design of a northeastern forest simulator. Can. J. For. Res. 23: 1980⫺1988.
PARSONS, W.F.J., KNIGHT, D.H., MILLER, S.L., 1994: Root gap dynamics in lodgepole pine forest: nitrogen transformations in gaps of different size. Ecol. Appl. 4, 354⫺362.
PRETZSCH, H., BIBER, P., DURSKY, J., 2002: The single tree-based stand simulator SILVA: construction, application and evaluation. For. Ecol. Manage. 162, 3τ21.
READER, R.J., TAYLOR, K.C., LARSON, D.W., 1991: Does intermediate disturbance increase species richness within deciduous forest understorey? In: ESSER,G., OVERDIECKD. (eds.): Modern ecology: basic and applied aspects. Elsevier, Amsterdam. pp. 363⫺373.
ROBERTS, M.R., ZHU, L., 2002: Early response of the herbaceous layer to harvesting in a mixed conife-rous-deciduous forest in New Brunswick, Canada. For. Ecol. Manage. 155: 17⫺31.
SPREAFICO, M., WEINGARTNER, R., 1992: Hydrologischer Atlas der Schweiz. Bundesamt für Wasser und Geologie und Bundesamt für Landestopographie, Bern, Switzerland.
THOMAS, S.C., HALPERN, C.B., FALK, D.A., LIGUORI, D.A., AUSTIN, K.A., 1999: Plant diversity in managed forests: understorey responses to thinning and fertilization. Ecol. Appl. 9: 864⫺879.
TILMAN, D., 1988: Plant strategies and the dynamics and structure of plant communities. Princeton University Press, Princeton.
ZAVITKOVSKI, J., 1976: Ground vegetation biomass production, and efficiency of energy utilization in some northern Wisconsin forest ecosystems. Ecology 57: 694⫺706.
Authors’ address: PETERJ. WEISBERG, CHRISTIANHADORNand HARALDBUGMANNMountain Forest Ecology, Department of Forest Sciences, Swiss Federal Institute of Technology-Zürich, CH-8092 Zürich, Switzerland.
Current address for PW: Department of Environmental and Resource Sciences, Univer-sity of Nevada⫺ Reno, 1000 Valley Road/MS 186, Reno, NV 89512, USA. Fax +01-775-784-4583, Email: pweisberg@cabnr.unr.edu.